3760
On the Precision of Myelin Imaging: Characterizing Ex vivo Dog Spinal Cord with MRI and Histology1NeuroPoly Lab, Polytechnique Montréal, Montréal, QC, Canada, 2Montreal Heart Institute, Montréal, QC, Canada, 3Functional Neuroimaging Unit, CRIUGM, Université de Montréal, Montréal, QC, Canada
Synopsis
There is an ongoing debate in the myelin imaging community about which MR-based biomarker has the greatest precision, sensitivity and specificity to myelin. In this work, we compared several MR-based myelin imaging techniques (quantitative magnetization transfer, myelin water fractions, and macromolecular tissue volume) by evaluating their repeatability and their relation to large-scale histology in dog spinal cord. Qualitatively the contrasts were similar, and all techniques had comparable scan-rescan and correlations with histology. Surprisingly, the correlations between the various myelin measures were almost as high as the scan-rescan correlations. The correlations decreased when only white matter was considered, which could be due to the small dynamic range of the measurement, or due to artifacts related to the preparation and panoramic scanning of the tissue.
Purpose
MR-based myelin imaging shows great potential in the study of demyelinating diseases, such as multiple sclerosis. There are a number of MRI-based metrics that are correlated with myelin content 1, but the relationship between them is not well understood. In this work, we compared the pool size ratio F (obtained from quantitative magnetization transfer 2,3), the myelin water fraction (MWF, obtained from multiexponential T2 fitting 4) and the macromolecular tissue volume (MTV, obtained from proton density imaging 5). We performed a qualitative comparison that focuses on general trends and contrast observation, and a quantitative correlation analysis in white matter (WM) and whole spinal cord (WSC).Methods
Tissue preparation. A sample of cervical dog spinal cord (perfused and post-fixed with paraformaldehyde 4%) was extracted and washed in Phosphate-buffered saline (PBS) solution for 5 days before scanning.
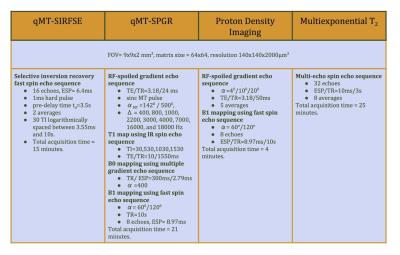
MRI. The sample was scanned on an Agilent 7T animal scanner equipped with 600 mT/m gradients. Two quantitative magnetization transfer (qMT) protocols were applied, one based on selective recovery fast spin-echo (SIR-FSE) and another on MT-prepared spoiled gradient echo (SPGR) sequences. The fitting was performed using the qMTLab software 6. MTV was measured using a T1 mapping procedure utilizing SPGR scans and a dual-angle B1 mapping routine to correct for RF inhomogeneities. A multi-echo spin echo sequence was employed to acquire data with 32 echoes for MWF fitting. The data fitting of MTV and MWF was performed using in-house fitting software. All the protocol settings are listed in Table I.
Histology. The same tissue was then osmified (2% OsO4 for 2 hours), embedded in EMbed 812 Resin, cut using a microtome and polished. A scanning electron microscope (Low-angle backscattered electron mode) (JEOL 7600F) was used to image an entire slice of the spinal cord at a resolution of 0.26µm/px. Myelin volume fraction (MVF) was then segmented using an adaptive OTSU algorithm7 and registered to the MRI-based metrics using an affine transformation.
Statistics. A correlation matrix (Pearson’s correlation coefficient) was generated in order to assess the scan-rescan repeatability of each MRI-based myelin metric, as well as the correlation between metrics in the white matter and in the whole spinal cord.
Results
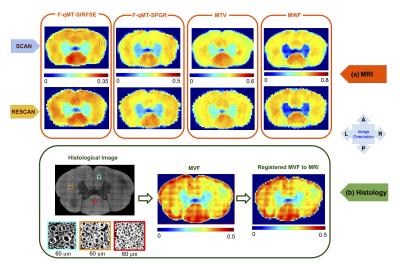
Figure 1 shows the scan-rescan of the MRI-based metrics, as well as the histological image of the same tissue sample. All of the metrics were sensitive to myelin content (MVF), as evidenced by: (i) significantly lower values in the gray matter than in the WM, (ii) values close to zero in the water surrounding the sample, (iii) small coefficient of variation in the WM, consistent with the small variation of myelin content between the different tracts of the spinal cord 8. It can be seen that all the MRI-based metrics predict a similar trend in the myelin content distribution, with higher values in the dorsal column that are consistent with histology.
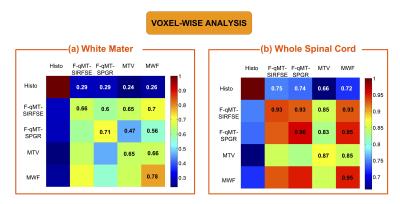
Figure 2 presents the Pearson’s correlation coefficients using voxel-wise analysis between MRI-based metrics and MVF from histology. Scan-rescan metrics (diagonal values) were correlated highly in WSC (0.87-0.96) and moderately in WM (0.65-0.78). High correlation in WSC (0.83-0.95) and moderate correlation (0.47-0.7) in WM were also observed between all the MRI-based metrics. Correlations with histology were lower (0.66-0.75 in WSC and 0.24-0.29 in WM), but statistically significant (p<.0001).
Discussion
All MR techniques exhibit similar trends that are consistent with histology (Fig. 1). The high correlations when including grey matter are primarily due to bulk differences between grey and white matter. In white matter the voxelwise correlations are significantly lower, both between MR metrics and when compared to histology (Fig. 2). This is not surprising given the lower dynamic range in WM, and the observed variance in the scan-rescan experiments. The observation that the correlations between myelin measures are comparable to the scan-rescan correlations (within measures), suggests that all our protocols have similar precision. With respect to the histological validation, it is important to point out several possible confounding factors: (i) poor compaction of the myelin sheaths which results in high MVF values; (ii) high sensitivity to variation of contrast, brightness, and focus (although not visible before downsampling) of the adaptive OTSU segmentation; (iii) imperfect registration with MRI-based metrics using the affine transformation. Future studies will include demyelinating animal models, where greater variation in absolute myelin content is expected. These studies need to be complemented by more robust large-scale histological techniques that minimize fixation and reconstruction artifacts.Acknowledgements
This work was funded by the Canada Research Chair in Quantitative Magnetic Resonance Imaging (JCA), the Canadian Institute of Health Research [CIHR FDN-143263], the Canada Foundation for Innovation [32454], the Fonds de Recherche du Québec – Santé [28826], the Fonds de Recherche du Québec - Nature et Technologies [2015-PR-182754], the Natural Sciences and Engineering Research Council of Canada [435897-2013, 06774-2016] and the Quebec BioImaging Network.
The authors would like to thank Mark Does and Kevin Harkins from Vanderbilt University, Eva Alonso-Ortiz and Ives Levesque from McGill University for their support.
References
[1] Dula et al., Magn Reson Med, 2010. 63:902-909 ;
[2] Sled et al., Magn Reson Med, 2001. 46:923-931;
[3] Gochberg et al., Magn Reson Med, 2007. 57:437–441;
[4] Mackay et al., Magn Reson Med, 1994. 31:673-677;
[5] Mezer et al., Nature medicine, 2013. 19, 1667;
[6] Cabana et al., Concepts in Magn Reson Part A, 2016. Vol. 44A(5) 263–277;
[7] Otsu et al., IEEE Trans. Syst. Man Cybern., 1979. Vol. 9(1) 62-66;
[8] Harkins et al., Magn Reson Med, 2016. 75:1341–1345.
Figures


