3758
Interleaved B0-mapping during dynamic Creatine-CEST for correction of temporarily fluctuating B0 inhomogeneities during plantar flexion exercise at 7T1High Field MR Centre. Biomedical Imaging and Image-guided Therapy, Medical University of Vienna, Austria, Vienna, Austria, 2Christian Doppler Laboratory for Clinical Molecular MR Imaging, Vienna, Austria
Synopsis
Once the time resolution and specificity of Cr-CEST become comparable with 31P-MRS, it may replace it for the diagnosis of muscular disorders and treatment assessment due to its superior spatial resolution and sensitivity. The need of a complete Z-spectrum acquisition for B0 inhomogeneity correction limits the achievable time resolution and is unable to track temporal ∆B0 due to subject movement or B0 field drifts that occur during a CEST experiment. Temporal B0 field tracking allows independent B0 inhomogeneity correction for each z-spectral point, which may substantially improve the reliability of spectral CEST asymmetry analysis.
INTRODUCTION
Chemical Exchange Saturation Transfer (Cr-CEST) is a contrast mechanism that allows the detection of small amounts of metabolites with enhanced sensitivity. Creatine (Cr) is an endogenous metabolite with Amine protons (-NH2) involved in muscle energy metabolism, which can be altered under different disorders.1
Current CEST techniques are very sensitive to motion-induced bias in CEST quantification, which is unavoidable during dynamic muscle exercise studies. One of them arises from the physical variation in the B0 field (∆B0) due to subject movement. The other one from the way the contrast is calculated in the spectral CEST asymmetry analysis, for each voxel along a number of MR images.2
Established B0-inhomogeneity correction methods for CEST can only correct static B0 deviations (i.e., shift the frequency of the entire z-spectrum), but cannot compensate temporal B0 changes that occur during a CEST experiment.
In this study, we propose and compare two alternative methods that allow a dynamic correction of B0 changes for individual z-spectral points. These significant improvements in the acquisition and processing of CEST spectra are mandatory to translate Cr-CEST during exercise to a reliable tool for routine application.
MATERIALS AND METHODS
The first approach (A) that we propose is to track temporal ∆B0 by using the gradient echo images of the CEST scan itself having a certain echo time (TE) and assume a constant phase offset calculated from a previous double echo gradient echo (DE-GE) sequence.3 The other option (B) that we propose is the use of an interleaved dual-echo navigator (NAV) prior to saturation.
These two dynamic correction approaches (A,B) were compared to three established static B0 correction approaches: (C) Water saturation shift reference (WASSR)4, (D) minimum of CEST spectrum, and (E) application of one B0 map obtained from a single DE-GE sequence 5 prior to the CEST experiment.
For this comparisons, the ∆B0 in the x direction shown in Fig. 1 and 2 were calculated as the B0 maps obtained after a manual increase in the voltage of the first order shimming coil in the x direction minus the B0 maps obtained after optimum shimming. The measurements where performed on a commercially homogeneous spherical phantom for calibration from Siemens Healthcare, Erlangen,Germany.
The non-rigid diffeomorphic images registration were performed retrospectively in Matlab 2015b.6 All the MRI scans where performed on a whole body 7T MR Magnetom system from Siemens Healthcare, with a 1H28-channel Tx/Rx knee coil from QED, Mayfield Village,Ohio,USA.
CEST images were acquired with five Gaussian saturation pulses of 100ms each separated by a 31ms delay and amplitude B1=1.2uT. The spectrum range was ±3.2ppm with a step size of 0.25 ppm (26 points).
WASSR images were obtain with the same parameters except for two saturation pulses of B1=0.2uT and a Z-spectrum between ±1.2ppm and a step size of 0.05 ppm (49 points). Phantom and volunteer’s imaging were performed with imaging parameters of slice thickness=6mm, FA=5º and FOV=225x225mm.
The DE-GE images parameters were pixel BW =600 Hz, TR=12ms TE1=2.0ms TE1=5.1ms and 30 averages.
The Navigator EPI images parameters were pixel B1=2790 Hz, TR=1ms TE=6.1ms TE2 9.2ms and EPI factor=3.
RESULTS AND DISCUSSION:
In phantom studies the spatial ∆B0 calculated from NAV shows the same slope and similar variability as the reference DEGE. On the other hand, the one determined from WASSR presents variability within the range of ±15 Hz (Fig.1), which can only be compensated by scanning additional spectral points and hence further increasing scan time.
The alternative of calculating the ∆B0 directly from each of the CEST images provides good results except for those images partially or totally saturated (i.e. acquired after saturation around 0 ppm, Fig 2.c).
The fact that exercise is performed during CEST images acquisition, with intrinsic deformation between consecutive images and that the data post-processing is done voxel-wise, elastic registration of CEST images and Field Maps (FM) become necessary for a reliable quantification in dynamic exams.
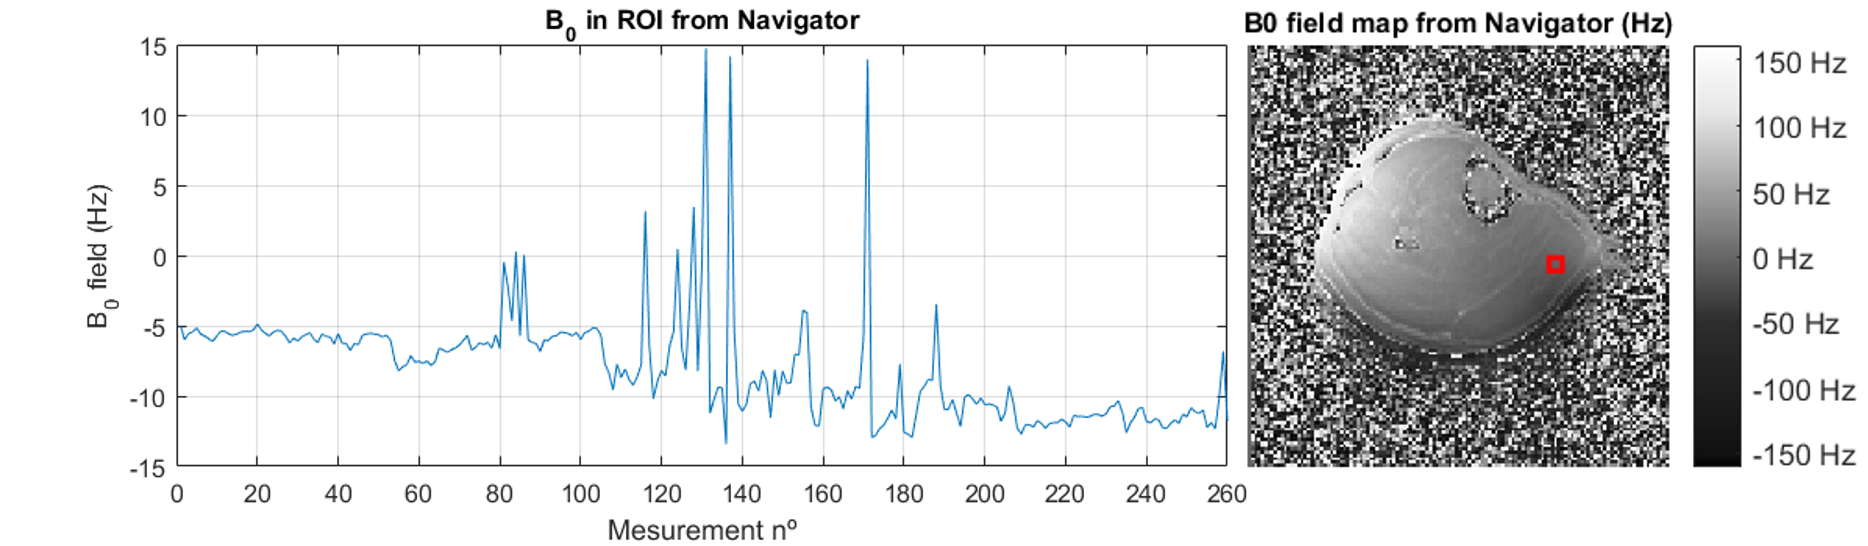
The advantage of the NAV images is that a displacement field can be determined even for saturated CEST images, as those shown in Fig 3. The preliminary results in vivo (Fig4) show how the static B0 map in the ROI selected vary up to 25 Hz during plantar flexion exercise.
CONCLUSION
This study shows the feasibility to map the B0 field repetitively during exercise prior acquisition of each z-spectral point, which can ensure accurate B0-correction for dynamic Cr-CEST experiment in vivo.
In comparison with the static standard methods such as WASSR, which assume constant B0 and no movement, dynamic correction methods (in particular interleaved NAV-based acquisition) can compensate for temporal B0 fluctuations and subject deformation/movement.
Acknowledgements
My gratitude to ÖNB Jubiläumsfonds #16133References
1. Kogan, F., H. Hariharan, and R. Reddy, Chemical Exchange Saturation Transfer (CEST) Imaging: Description of Technique and Potential Clinical Applications. Curr Radiol Rep, 2013. 1(2): p. 102-114.
2. van Zijl, P.C. and N.N. Yadav, Chemical exchange saturation transfer (CEST): what is in a name and what isn't? Magnetic Resonance in Medicine, 2011. 65(4): p. 927-948.
3. Robinson, S., G. Grabner, S. Witoszynskyj and S. Trattnig (2011). "Combining phase images from multi-channel RF coils using 3D phase offset maps derived from a dual-echo scan." Magn Reson Med 65(6): 1638-1648.
4. Kim, M., et al., Water saturation shift referencing (WASSR) for chemical exchange saturation transfer (CEST) experiments. Magn Reson Med, 2009. 61(6): p. 1441-1450.
5. Kawanaka, A. and M. Takagi, Estimation of static magnetic field and gradient fields from NMR image. Journal of Physics E: Scientific Instruments, 1986. 19(10): p. 871.
3. Forsberg, D., M. Andersson, and H. Knutsson, Non-rigid Diffeomorphic Image Registration of Medical Images Using Polynomial Expansion. 2012. 7325: p. 304-312.
Figures
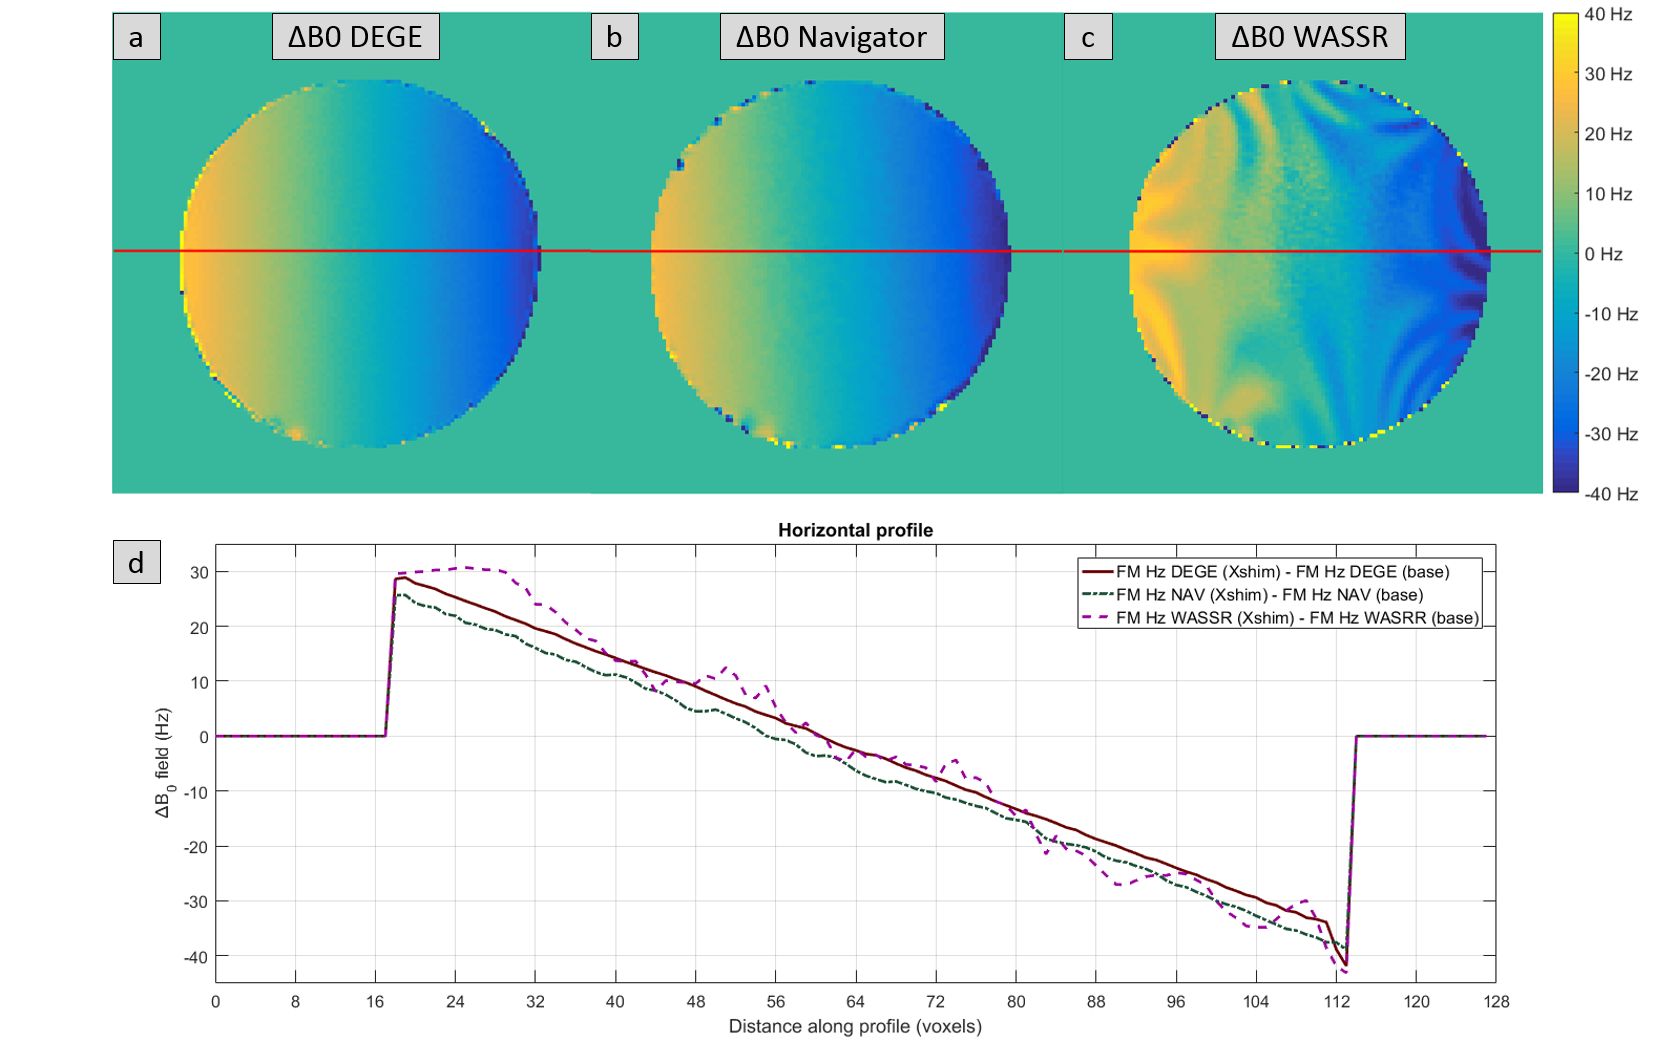
Fig. 1: ∆B0 profile comparison: DE-GE VS Navigator VS WASSR
Spatial ∆B0 in the x direction measured with (a) single DE-GE sequence prior to the CEST experiment, (b) interleaved dual-echo navigator (NAV) prior to saturation and (c) single WASSR sequence prior to the CEST experiment. The ∆B0 profile along the horizontal red line is given in (d). ∆B0 were calculated as the B0 maps obtained after a manual increase in the voltage of the first order shimming coil in the x direction minus the B0 maps obtained after optimum shimming for each of the methods.
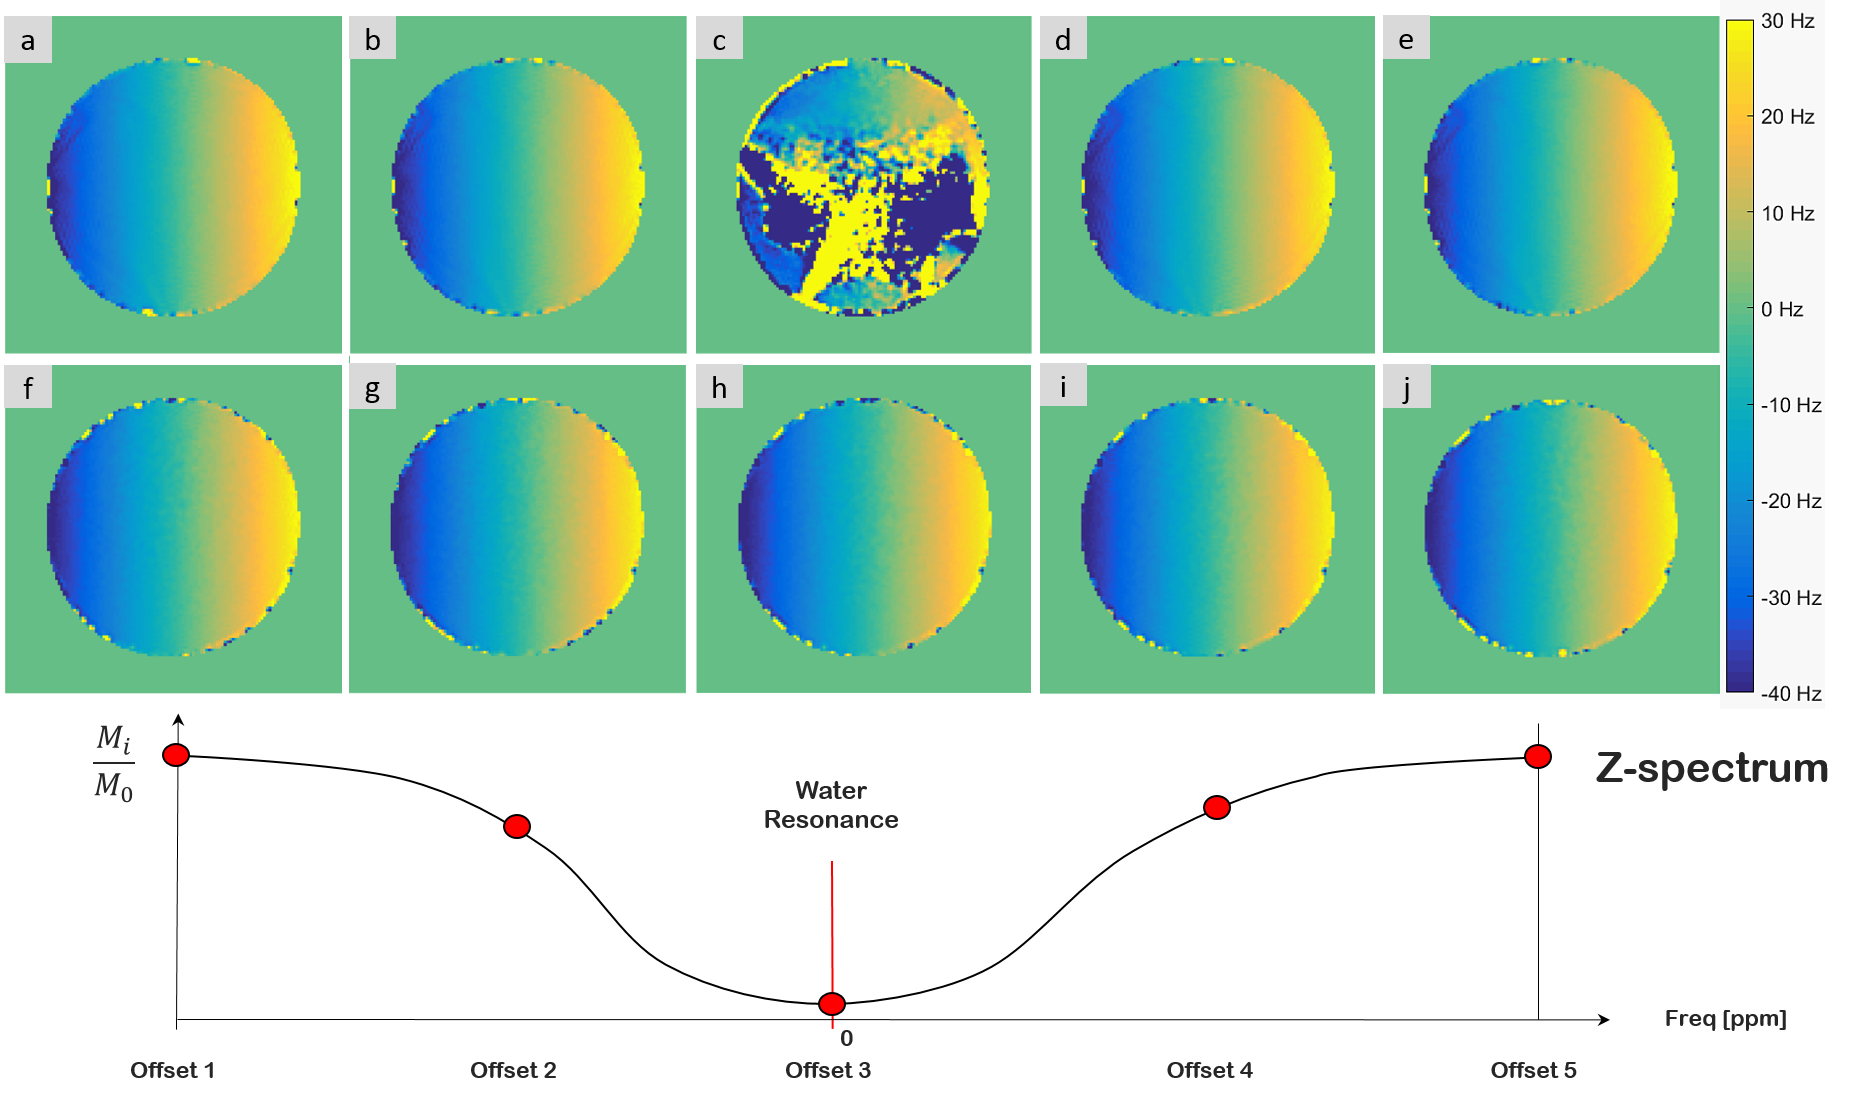
Fig. 2: ∆B0 comparison: DE-GE & CEST VS Navigator
Spatial ∆B0 in the x direction calculated (a-e) from the gradient echo images of the CEST scan and (f-j) from the interleaved dual-echo navigator (NAV) images prior to saturation. Each saturation train of pulses are applied at the Z-spectrum offsets frequencies [1-5], being 0 at water resonance frequency. For the calculation of the ∆B0 maps from CEST images at a certain TE, the phase offset calculated from a single DE-GE sequence prior to the CEST experiment is assumed constant.
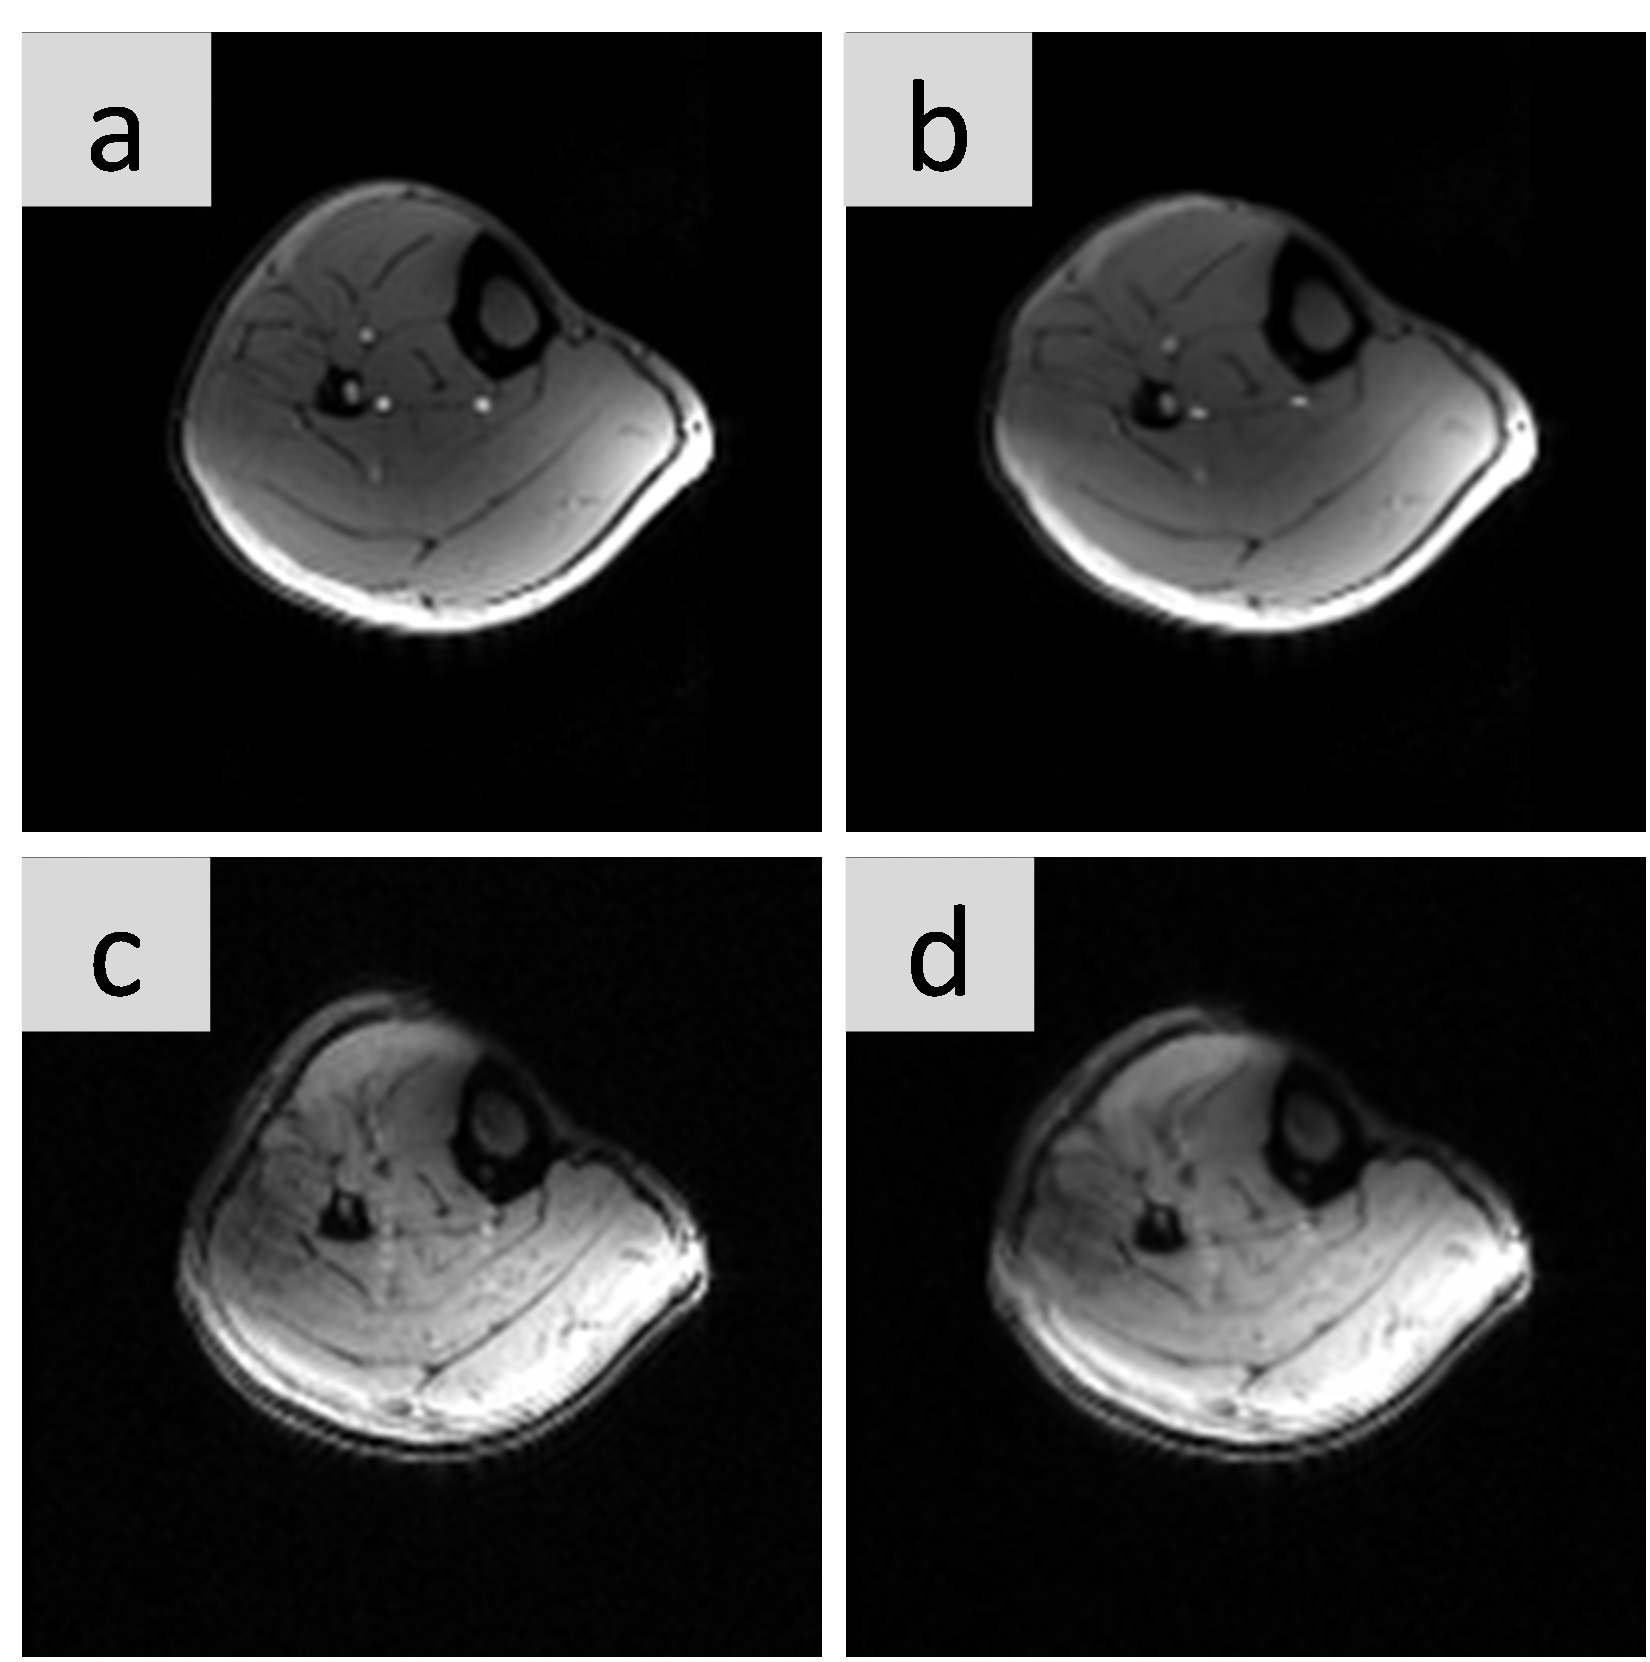
Fig. 3: Non-rigid registration of images from CEST (top row) and Navigator (bottom row) sequences.
Deformed GE magnitude images from CEST sequence acquired before elastic registration and (b) after registration. (c) Deformed EPI magnitude image used before and (d) after elastic registration. The images from the CEST scans don’t show full contrast due to partial water saturation, the EPI images Navigator are acquired just before saturation is applied.