3756
Development of Glutamate-Sensitive CEST at Clinical Field Strength for In Vivo Application1Department of Radiology and Radiological Sciences, Vanderbilt University Medical Center, Nashville, TN, United States, 2Vanderbilt University Institute of Imaging Science, Vanderbilt University Medical Center, Nashville, TN, United States, 3Department of Biomedical Engineering, Vanderbilt University, Nashville, TN, United States
Synopsis
Cognitive impairment (CI) is a significant symptom of multiple sclerosis (MS), is the strongest predictor of unemployment in MS patients, and is critical to the decline of quality of life. There is an unmet need for imaging techniques that probe the pathological substrate of CI at a clinically relevant field strength. To address this need, we have investigated the translation of glutamate-sensitive chemical exchange saturation transfer (GluCEST) MRI to 3T, as glutamate abnormalities have been linked to CI in MS. Our results demonstrate the clinical feasibility of GluCEST imaging for application to studying cortical gray matter glutamate signals in vivo.
Purpose
The lack of robust imaging markers for characterizing early biochemical changes and tissue damage in cortical gray matter (GM) underlying cognitive impairment (CI) in multiple sclerosis (MS) contributes to challenges faced by clinicians in treating this symptom1-3. Dysfunctional regulation of glutamate has been implicated in MS pathogenesis4-7, but clinically-relevant glutamate-sensitive MRI techniques at 3T are poorly explored. Glutamate-sensitive chemical exchange saturation transfer (GluCEST) MRI has been demonstrated at 7T8-10 however, GluCEST at lower field strength has not been developed. The primary hindrance is the rapid exchange rate (kex~2000-5000Hz) of glutamate amine groups and the poorer spectral resolution at 3T. In this work, we investigate the effects of CEST saturation parameters on the GluCEST effect in phantoms and in vivo to demonstrate the feasibility of GluCEST imaging at 3T.Methods
Phantom Imaging: Tubes containing sodium L-glutamate (Sigma-Aldrich) dissolved in PBS (at 0-20mM) at pH 7.4 and a tube of 10% bovine serum albumin (BSA) solution (Sigma-Aldrich) were placed in a plastic container and surrounded by copper sulfate solution (~5mM). Phantom imaging was performed using a 3.0T Philips Achieva with dual channel excitation, and a 16-channel SENSE neurovascular coil. CEST: 2D multi-shot TFE (factor=3, TR/TE/α=8.9ms/5.0ms/20°, 2x2x15mm3). CEST saturation was achieved using a 4μT pulse train (40ms Gaussian pulses, 90% duty cycle, 400ms total duration), sampling asymmetrically at 30 frequency offsets (Δω between +/-5.5ppm). Six interspersed reference dynamics were acquired with no saturation (S0) to correct for signal drift. At 3T, for metabolites with smaller chemical shift, narrower bandwidth may be necessary thus, we also tested a longer CEST saturation duration (4μT pulse train with 950ms total duration: 95ms Gaussian pulses, 90% duty cycle). A WAter Saturation Shift Referencing (WASSR) scan11 was acquired for B0 correction and a B1 map was acquired for B1 correction of CEST data (dual-TR actual flip angle method, TR1/TR2/TE/α =30ms/130ms/2.8ms/60°)12.
In Vivo Imaging: After signed, informed consent, 3 healthy volunteers (2 female, 23-26 years) were enrolled, and imaging was performed at 3T with dual-channel transmit and a 32-channel receive head coil. CEST imaging was identical to that performed in phantoms, except for: axial plane, 2x2x10mm3 resolution, TR/TE/α=5.5ms/3.2ms/20°. 42 frequency offsets were sampled asymmetrically (Δω between +/-7.0ppm) with 15 interspersed S0 to correct for signal drift13. A 3D MP-RAGE was acquired for segmentation of GM, WM, and CSF.
Processing: All CEST dynamics were co-registered in Matlab and normalized to a spline fit of the S0 data13. ΔB0 shift was calculated (WASSR) and applied to CEST data prior to B1 correction. Magnetization transfer ratio (MTR) asymmetry, [S(-Δω)-S(+Δω)]/S0, was calculated to visualize CEST contrast in phantoms and in the brain. GM, WM, and CSF maps were obtained for the MP-RAGE slice corresponding to CEST data using FAST segmentation in FSL14.
Results
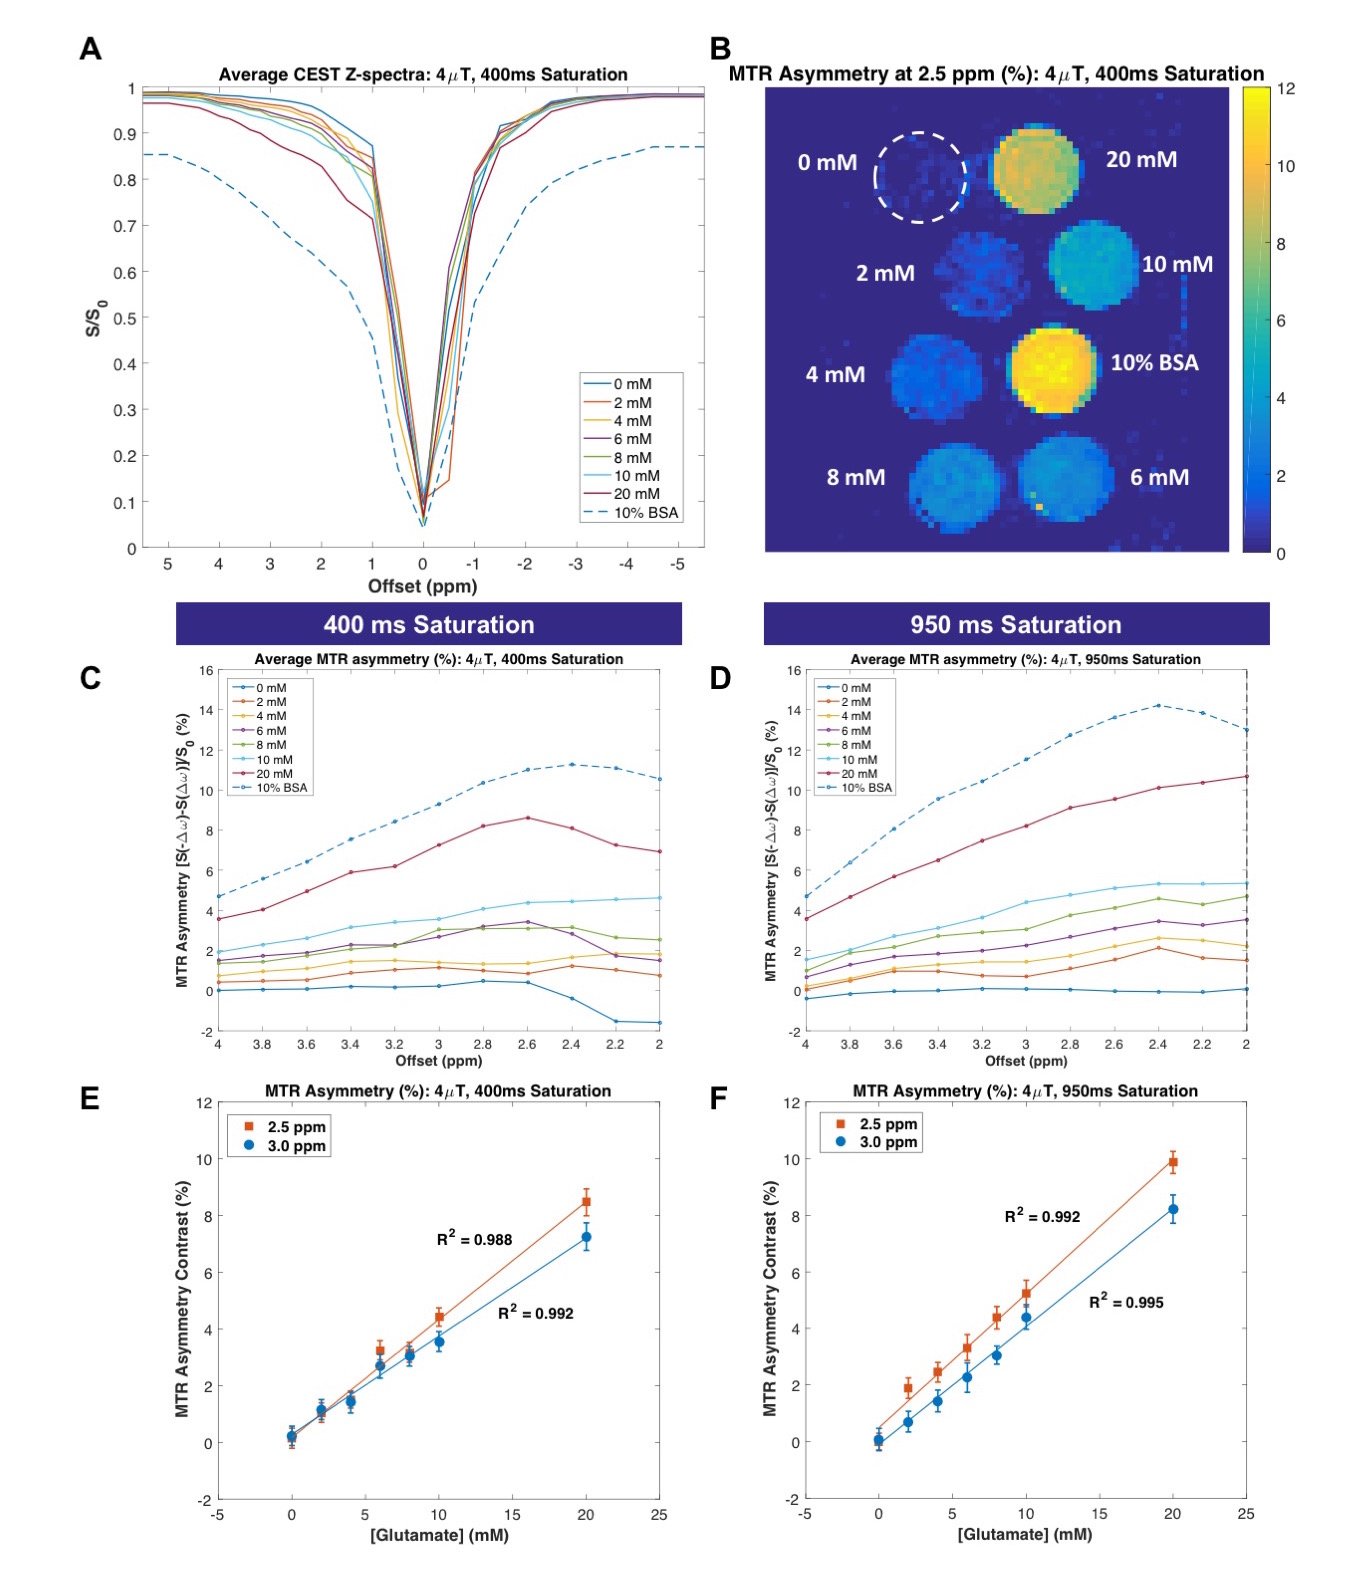
In phantoms, both CEST sequences generated MTRasym that was linearly correlated with glutamate concentration at multiple frequency offsets (Figure 1). Z-spectra (A) and MTR asymmetry (B-D) clearly demonstrate a characteristic CEST effect in the 2-4ppm range for both saturation durations, with improved separation between glutamate concentrations for 950ms saturation (D, F) in comparison to 400ms saturation (C, E). The magnitude of CEST contrast for glutamate concentrations near physiological levels (~6-10mM15-17) is similar for both sequences (E-F).
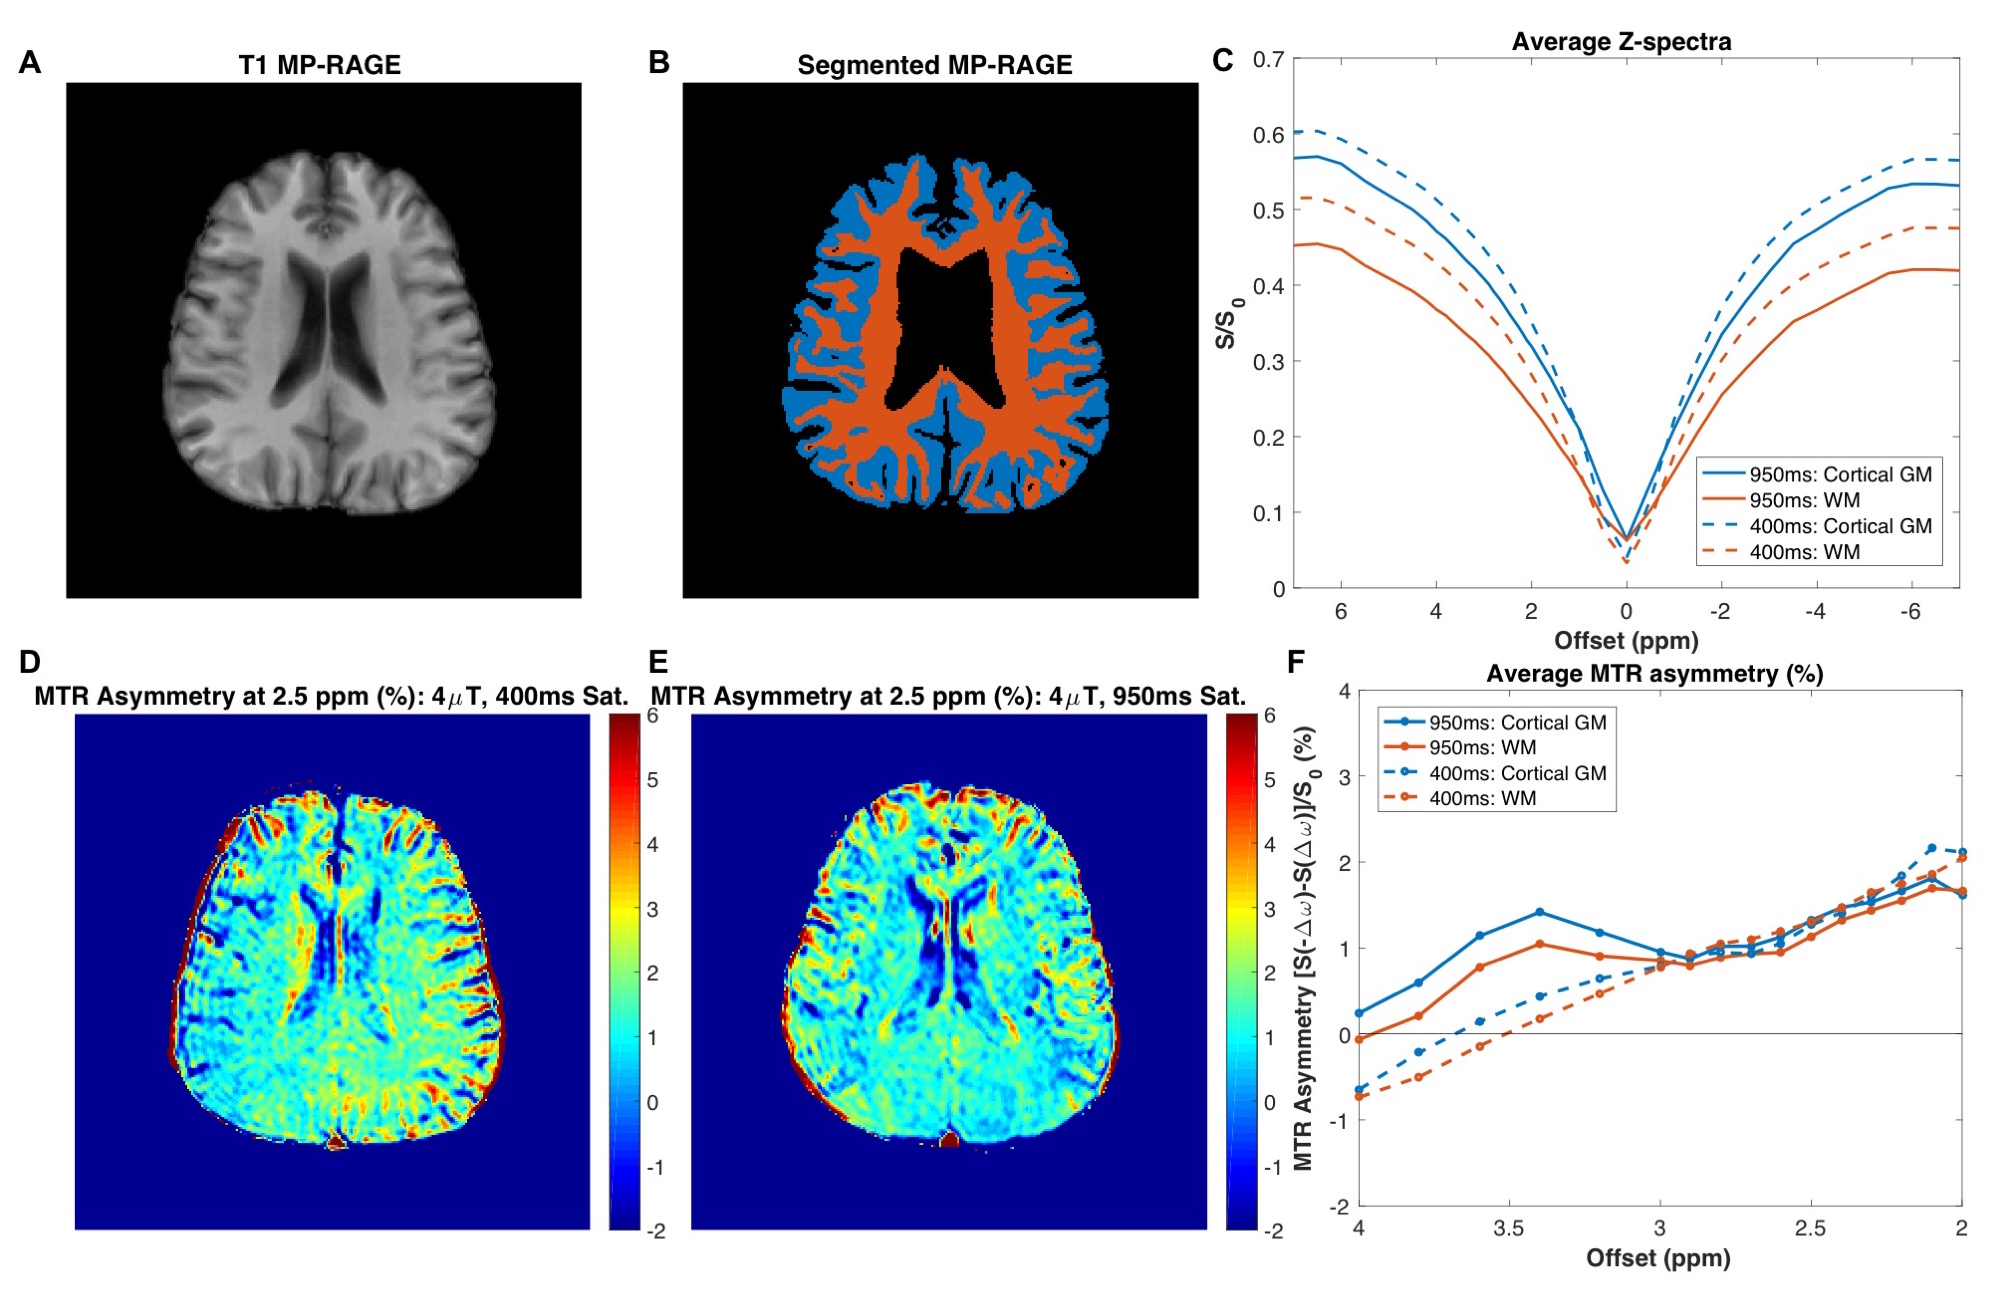
Figure 2 shows the comparison of the two CEST sequences in a healthy volunteer (MP-RAGE in (A) and tissue masks in (B)). Although the z-spectra for GM and WM differed between the two saturation durations (C), CEST contrast in the frequency range associated with glutamate amine protons (2-3ppm8) was similar for the two sequences (D-F). The magnitude of CEST contrast in vivo is 1-2% in both tissue types, which corresponds to the contrast calculated for ~4-6mM glutamate concentration in phantoms.
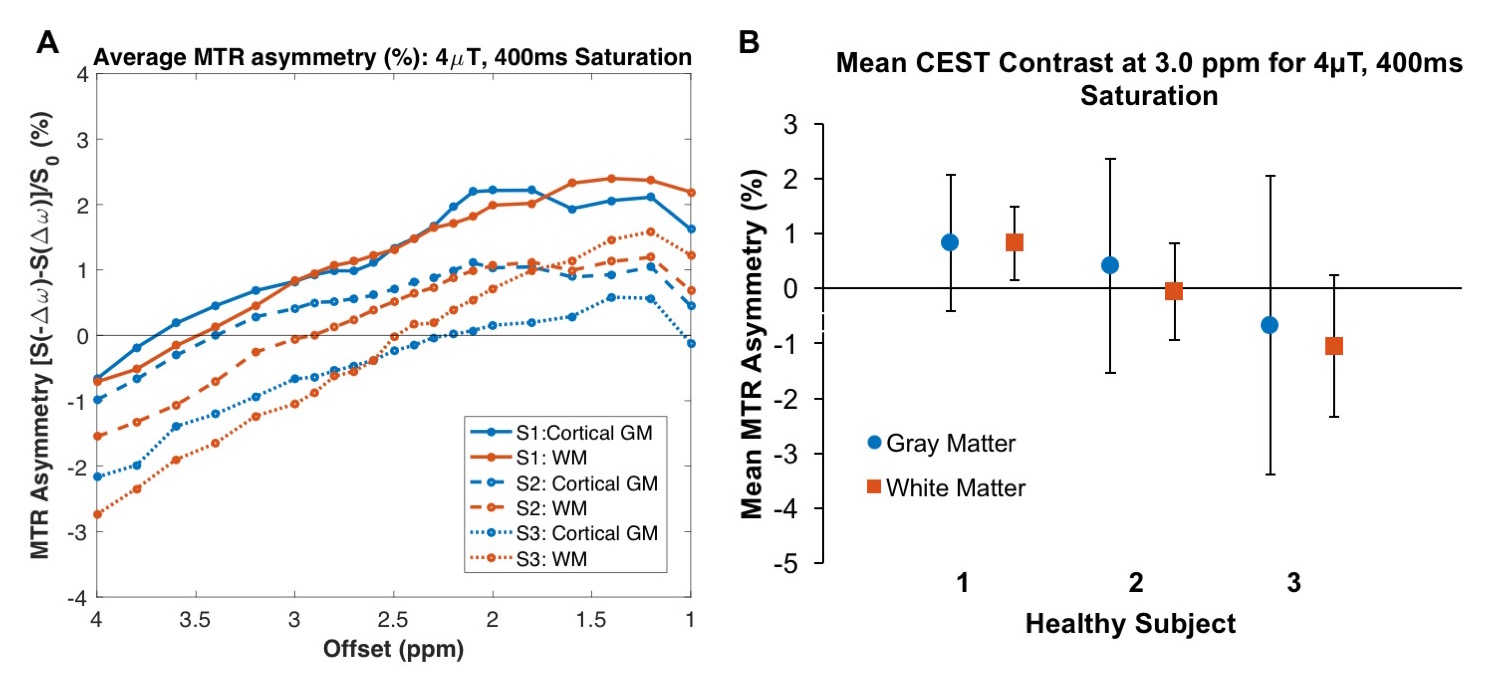
Both saturation durations showed similar amine-proton-associated contrast but scan time cannot be overlooked when eying clinical translation. Thus, we tested 400ms in additional healthy volunteers (Figure 3). MTR asymmetry vs. offset showed similar trends in three subjects (A). Although glutamate-associated CEST contrast in GM varies between (and within) subjects (B), there is a trend toward increased contrast in GM which is expected as glutamate concentration in GM is greater than WM17.
Discussion and Conclusions
We investigated the feasibility of translating GluCEST to 3T and achieved linear concentration-dependent GluCEST contrast in phantoms, along with GluCEST contrast in the brain that corresponds with the range of reported glutamate concentrations15-17. The confounding effects of Nuclear Overhauser effects, direct water saturation, and magnetization transfer may also affect the observed GluCEST contrast18. Overall, these promising results motivate further investigation of CEST saturation parameters for optimization of glutamate contrast at 3T.Acknowledgements
The authors would like to acknowledge all of the subjects who volunteered for our study, and our MRI technologists: Kristen George-Durrett, Leslie McIntosh, Clair Jones, and Chris Thompson. Dr. O’Grady is supported by NIH/NIBIB Training Grant 5T32EB001628-14 (PI: John C. Gore). This work was supported in part by funding from DoD W81XWH-13-1-0073, NIH/NINDS R21NS087465, National MS Society, and NIH R01 EY023240 (Smith).References
1. Rocca MA, et al. Clinical and imaging assessment of cognitive dysfunction in multiple sclerosis. Lancet Neurol. 2015; 14(3): 302-17.
2. Chiaravalloti ND and DeLuca J. Cognitive impairment in multiple sclerosis. Lancet Neurol. 2008; 7(12): 1139-51.
3. Rao SM, et al. Cognitive dysfunction in multiple sclerosis. I. Frequency, patterns, and prediction. Neurology. 1991; 41(5): 685-91.
4. Meldrum BS, Glutamate as a neurotransmitter in the brain: review of physiology and pathology. J Nutr. 2000; 130(4S Suppl): 1007S-15S.
5. Ciccarelli O, et al. Pathogenesis of multiple sclerosis: insights from molecular and metabolic imaging. Lancet Neurol. 2014; 13(8): 807-22.
6. Srinivasan R, et al. Evidence of elevated glutamate in multiple sclerosis using magnetic resonance spectroscopy at 3 T. Brain. 2005; 128(Pt 5): 1016-25.
7. Muhlert N, et al. Memory in multiple sclerosis is linked to glutamate concentration in grey matter regions. J Neurol Neurosurg Psychiatry. 2014; 85(8): 833-9.
8. Cai K, et al. Magnetic resonance imaging of glutamate. Nat Med, 2012. 18(2): 302-6.
9. Kogan F, et al. Imaging of glutamate in the spinal cord using GluCEST. Neuroimage. 2013; 77: 262-7.
10. Davis KA, et al. Glutamate imaging (GluCEST) lateralizes epileptic foci in nonlesional temporal lobe epilepsy. Sci Transl Med. 2015; 7(309): 309ra161.
11. Kim M, et al. Water saturation shift referencing (WASSR) for chemical exchange saturation transfer (CEST) experiments. Magn Reson Med. 2009; 61(6): 1441-50.
12. Yarnykh VL. Actual flip-angle imaging in the pulsed steady state: a method for rapid three-dimensional mapping of the transmitted radiofrequency field. Magn. Reson. Med. 2007; 57: 192–200.
13. Jones CK, Huang A, Xu J, et al. Nuclear Overhauser enhancement (NOE) imaging in the human brain at 7T. Neuroimage. 2013; 77: 114-124.
14. Zhang Y, Brady M, and Smith S. Segmentation of brain MR images through a hidden Markov random field model and the expectation-maximization algorithm. IEEE Trans Med Imag. 2001; 20(1): 45-57.
15. McKenna MC. The glutamate-glutamine cycle is not stoichiometric: fates of glutamate in brain. J. Neurosci. Res. 2007; 85: 3347-3358.
16. Geurts JJ, et al. Measurement and clinical effect of grey matter pathology in multiple sclerosis. Lancet Neurol. 2012; 11(12): 1082-92.
17. Donadieu M, Le Fur Y, Lecocq A, et al. Metabolic voxel-based analysis of the complete human brain using fast 3D-MRSI: Proof of concept in multiple sclerosis. J. Magn. Reson. Imaging. 2016; 44(2): 411-9.
18. Zaiss M and Bachert P, Chemical exchange saturation transfer (CEST) and MR Z-spectroscopy in vivo: a review of theoretical approaches and methods. Phys Med Biol. 2013; 58(22): R221-69.
Figures