3755
Optimization of Amide Proton Transfer (APT) Imaging Experimental Parameters for Brain Tumors: Does RF Saturation Length Always Increase APT Contrast?1Russell H Morgan Department of Radiology and Radiological Science, Johns Hopkins University, Baltimore, MD, United States, 2F.M. Kirby Research Center for Functional Brain Imaging, Kennedy Krieger Institute, Baltimore, United States, 3F.M. Kirby Research Center for Functional Brain Imaging, Kennedy Krieger Institute, Baltimore, MD, United States
Synopsis
Current APT imaging studies have used a moderate repetition time or relaxation delay to reduce the scan time. However, when a relatively short relaxation delay compared with T1 is applied, the steady-state water longitudinal magnetization is reduced, resulting in a decrease in APT effect. Therefore, experimental parameters must be optimized on a combination of the RF saturation power, saturation length, and relaxation delay. Here, we quantitatively investigated the dependence of APT and NOE signals on the experimental parameters using Bloch simulations and rat brain tumor models at 4.7 T.
Introduction
The effect of the RF saturation length has a similar influence on the Z-spectrum to that of the saturation power, in which dilution effects by direct water saturation (DS) and semisolid MT increase with the saturation length (1,2). In addition, a steady-state water longitudinal magnetization is reduced when a short relaxation delay compared with T1 relaxation time is applied, resulting in a decrease in water signal reduction and APT effect on Z-spectrum. Therefore, the APT experimental parameters must be optimized on a combination of the RF saturation power, RF saturation length, and relaxation delay for maximizing APT signal and tumor contrasts. Herein, we evaluated and optimized the experimental parameters using Bloch equation-based simulations and rat tumor models.Methods
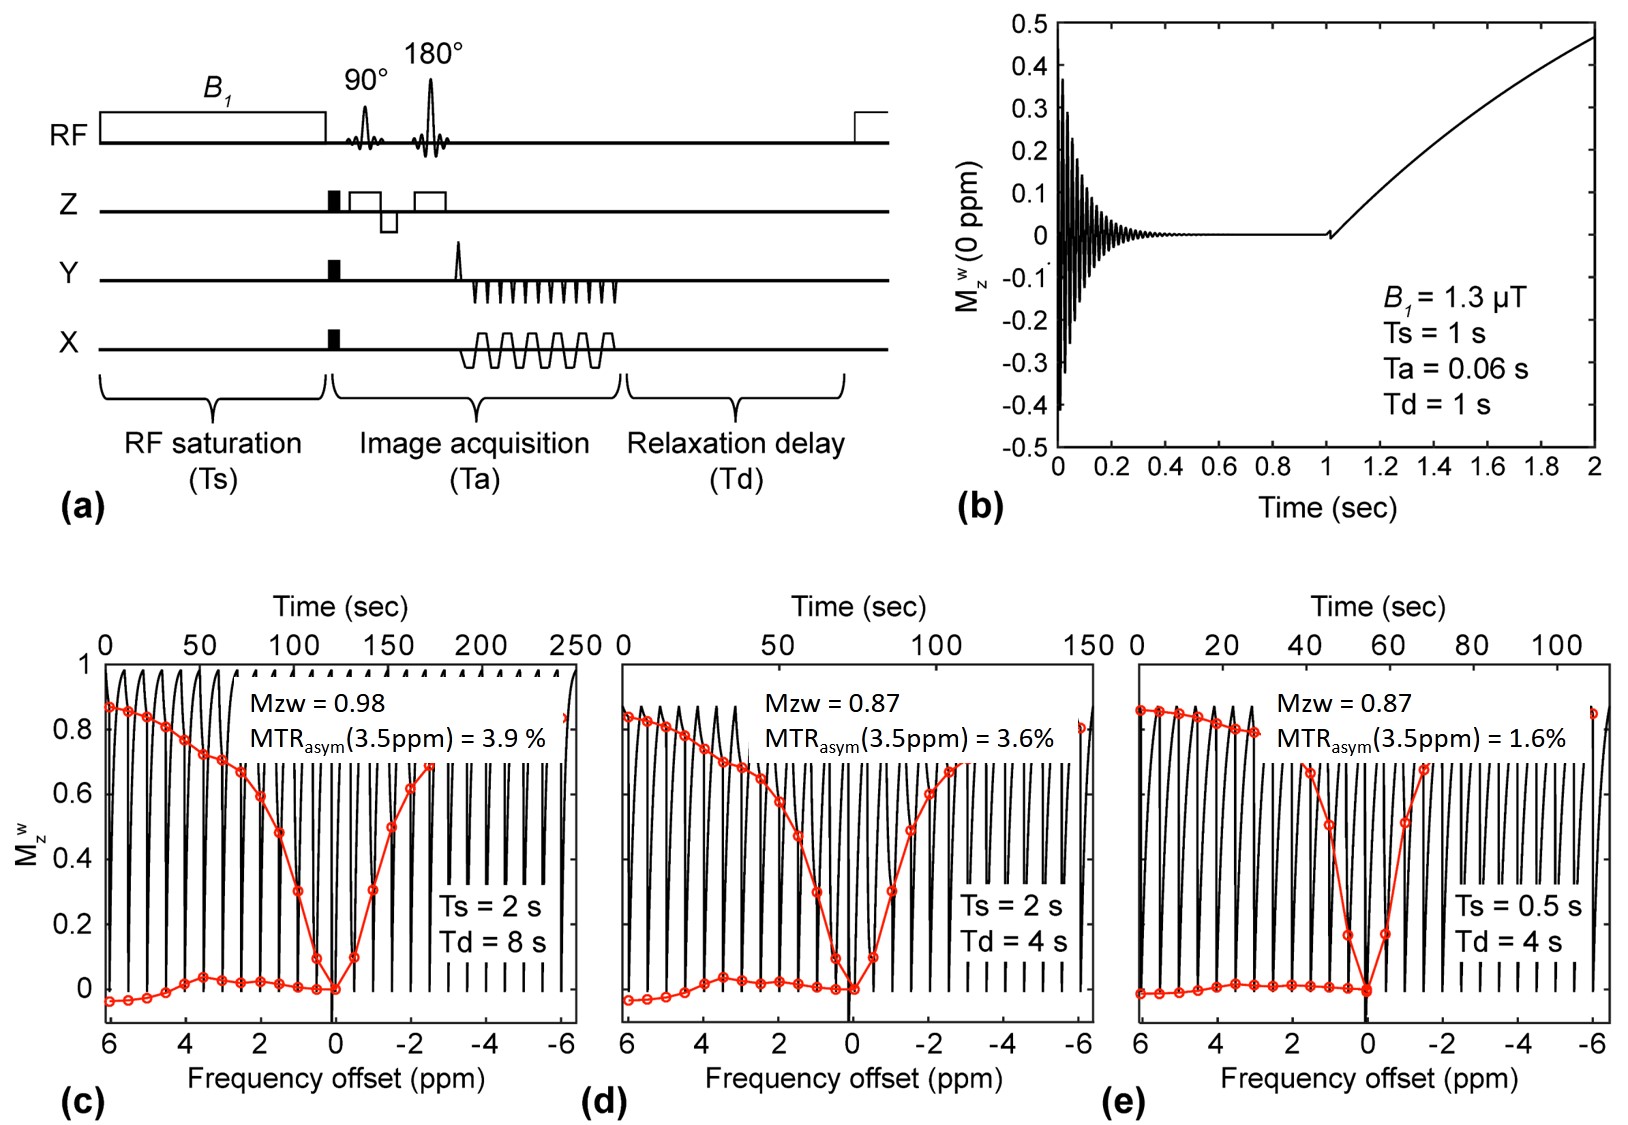
For Bloch simulation, all magnetization evolutions were numerically simulated following the CEST spin-echo EPI sequence (Fig. 1a-b). Simulated Z-spectrums were generated after five dummy scans with various RF saturation powers, saturation lengths, and relaxation delays. Simulations parameters (tumor) were: fractional pool sizes of s1 (amide), s2 (NOE), s3 (amine), and m (semisolid) relative to w (water) are 0.39, 0.93, 0.059, 3.1%, T1 of w, s1, s2, s3, and m are 1.95, 1.8, 1.8, 1.8, 1.8 sec, T2 of w, s1, s2, s3, and m are 64.9, 2.50, 0.48, 2.12 ms, 19 μs, exchange rates of s1, s2, s3, and m are 29, 11, 440, 22 Hz, and chemical shifts of s1, s2, s3, and m from water are 3.5, -3.5, 2, 0 ppm, respectively. The parameters above were determined by a five-pool exchange model fitting procedure using rat tumor models (3-5). For animal studies, six human glioblastoma-bearing adult rats were scanned using a single-shot EPI based spin-echo CEST sequence at 4.7 T. For data processing, after B0 correction with water saturation shift-referencing (6), quantitative APT (APT#) and NOE (NOE#) signals were measured by an extrapolated semi-solid MT model reference (EMR) method (7) and compared them with the commonly used MTR asymmetry (8).Results and Discussion
The steady-state water longitudinal magnetization increased with the relaxation delay. In result, the water signal reduction resulting from APT saturation effect was diminished as shown in Fig 1c-d. In addition, the APT effect on the water signal was reduced at short saturation length due to insufficient accumulation of the exchanged protons in the water as shown in Figures 1e.
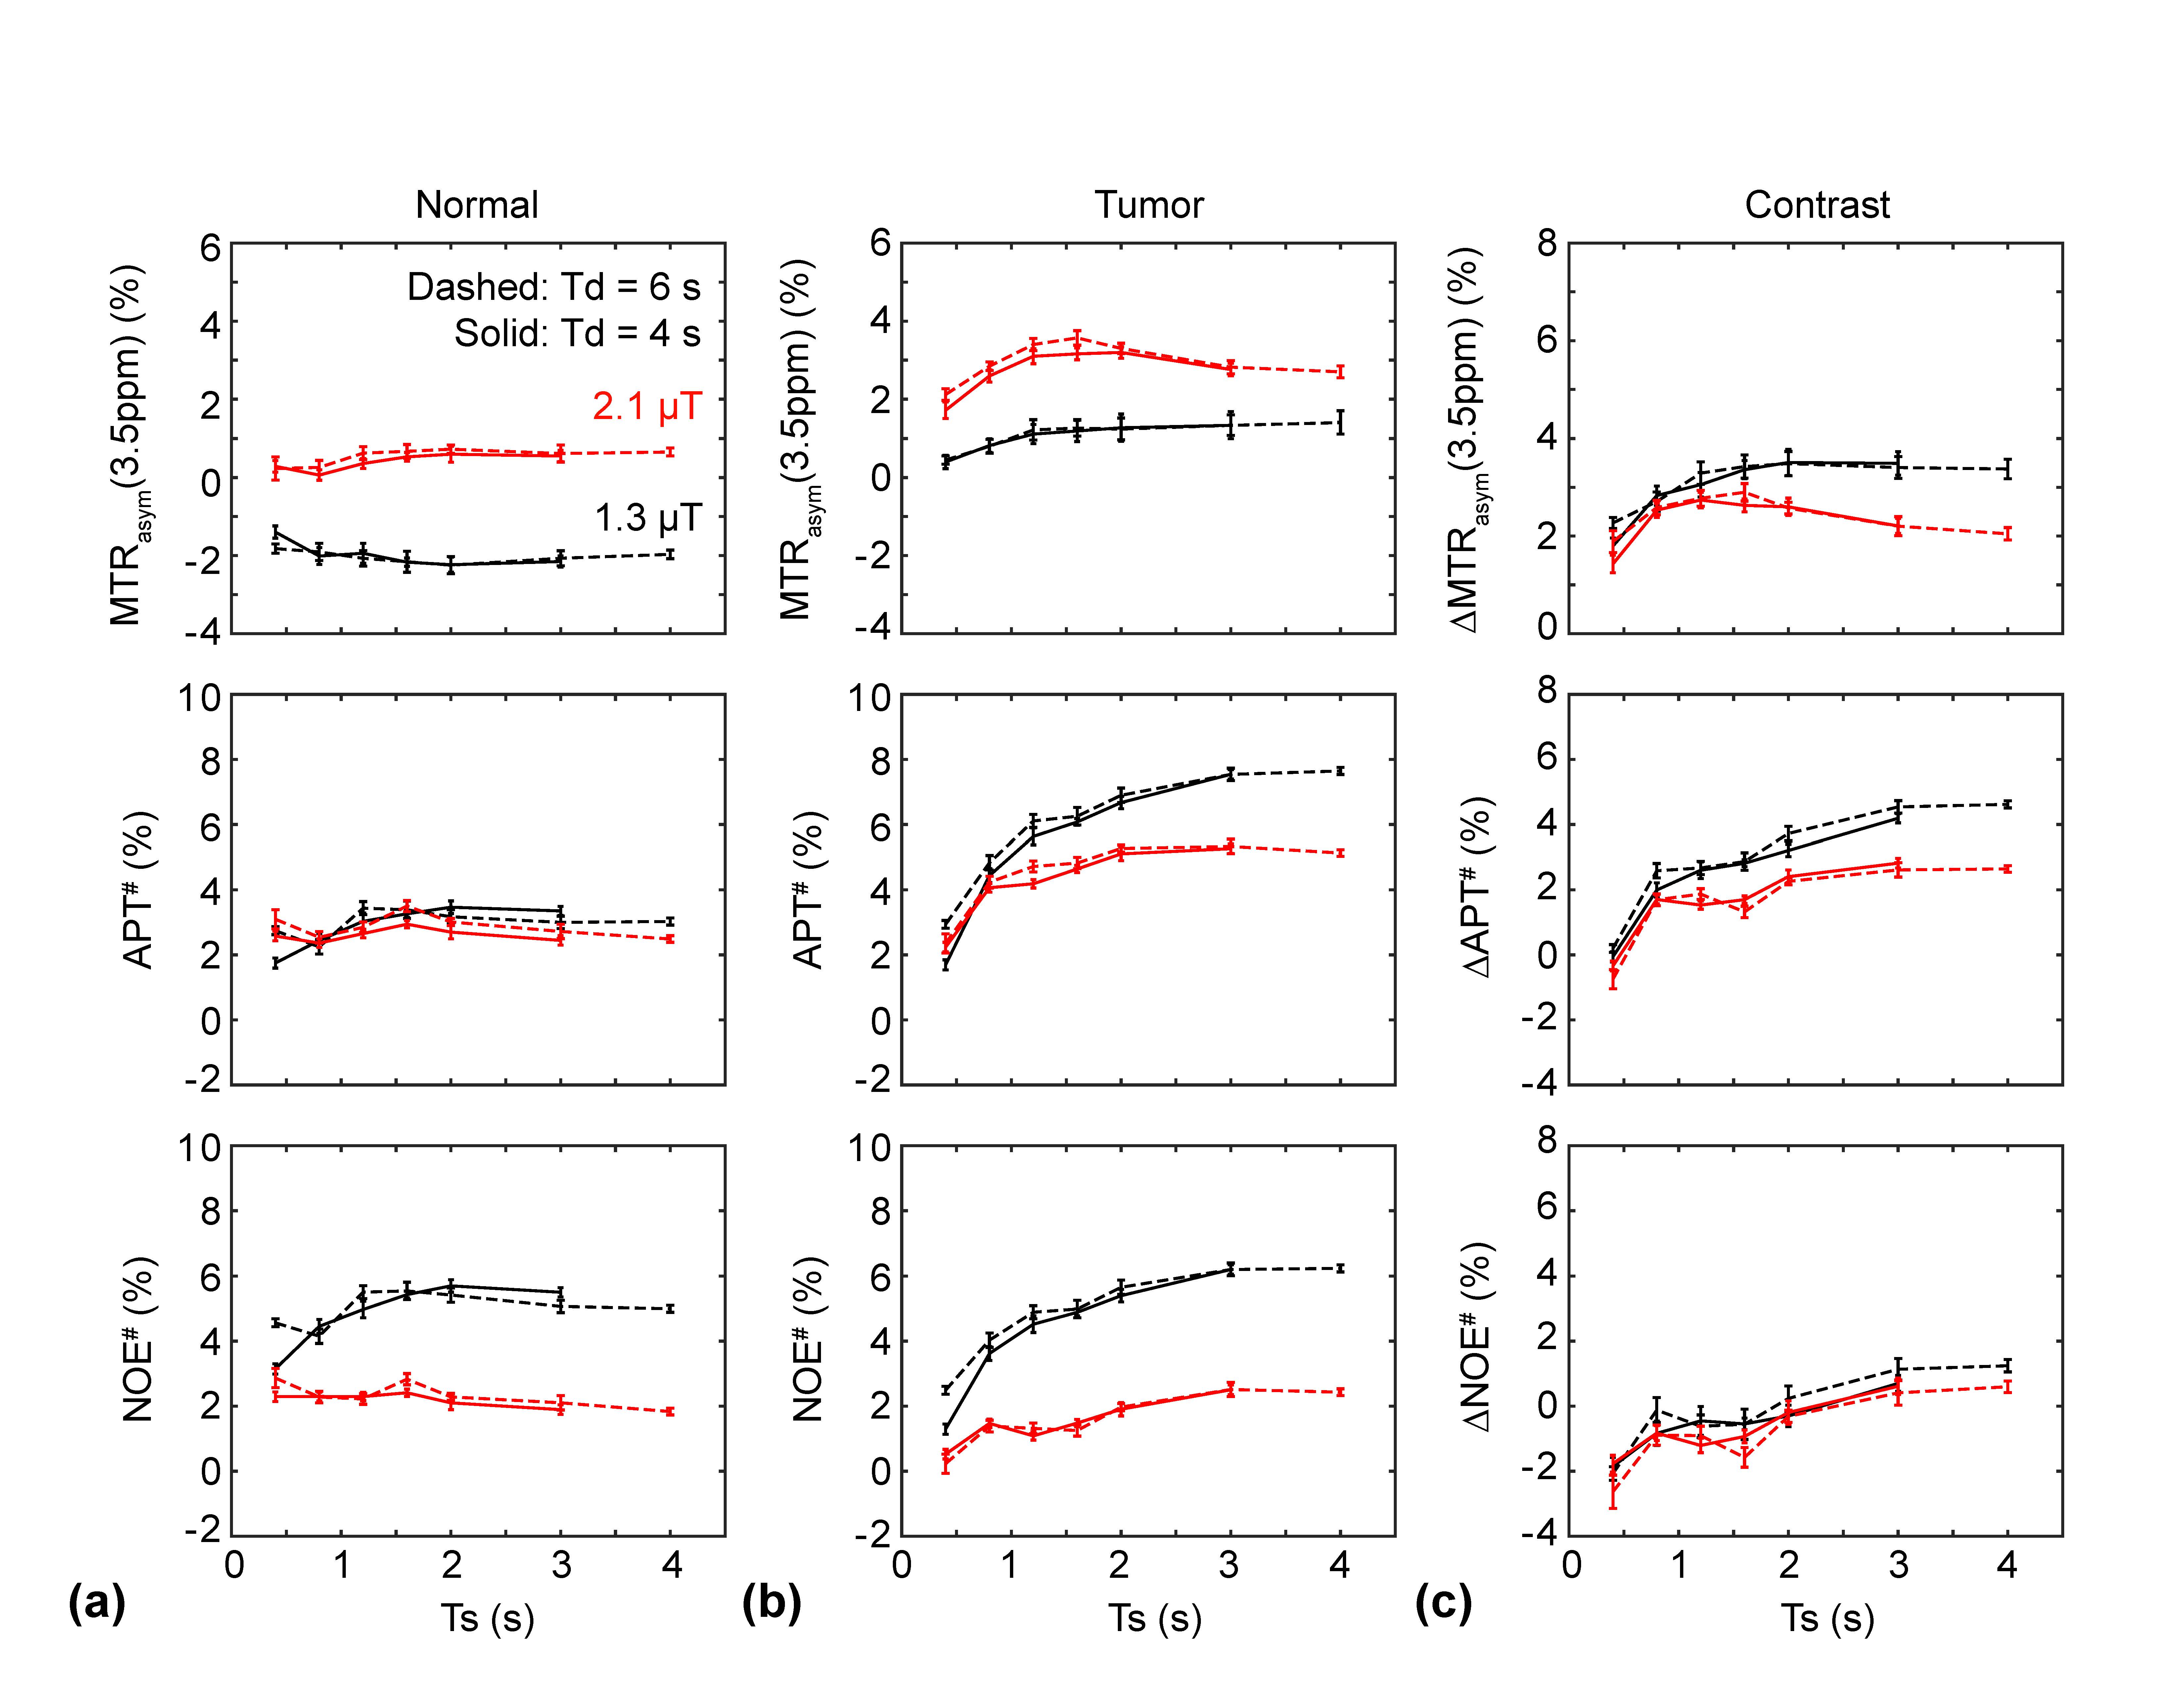
Figure 2 shows MTRasym(3.5ppm), APT#, and NOE# signal features as a function of RF saturation length. At high saturation powers (> 2.1 μT) and a long relaxation delay (8 sec), the MTRasym(3.5ppm) signals initially increased with the saturation length, then peaked, and eventually reached a plateau. In addition, both APT# and NOE# signals showed a similar trend with the MTRasym(3.5ppm) signals as shown in Figures 2b-c.
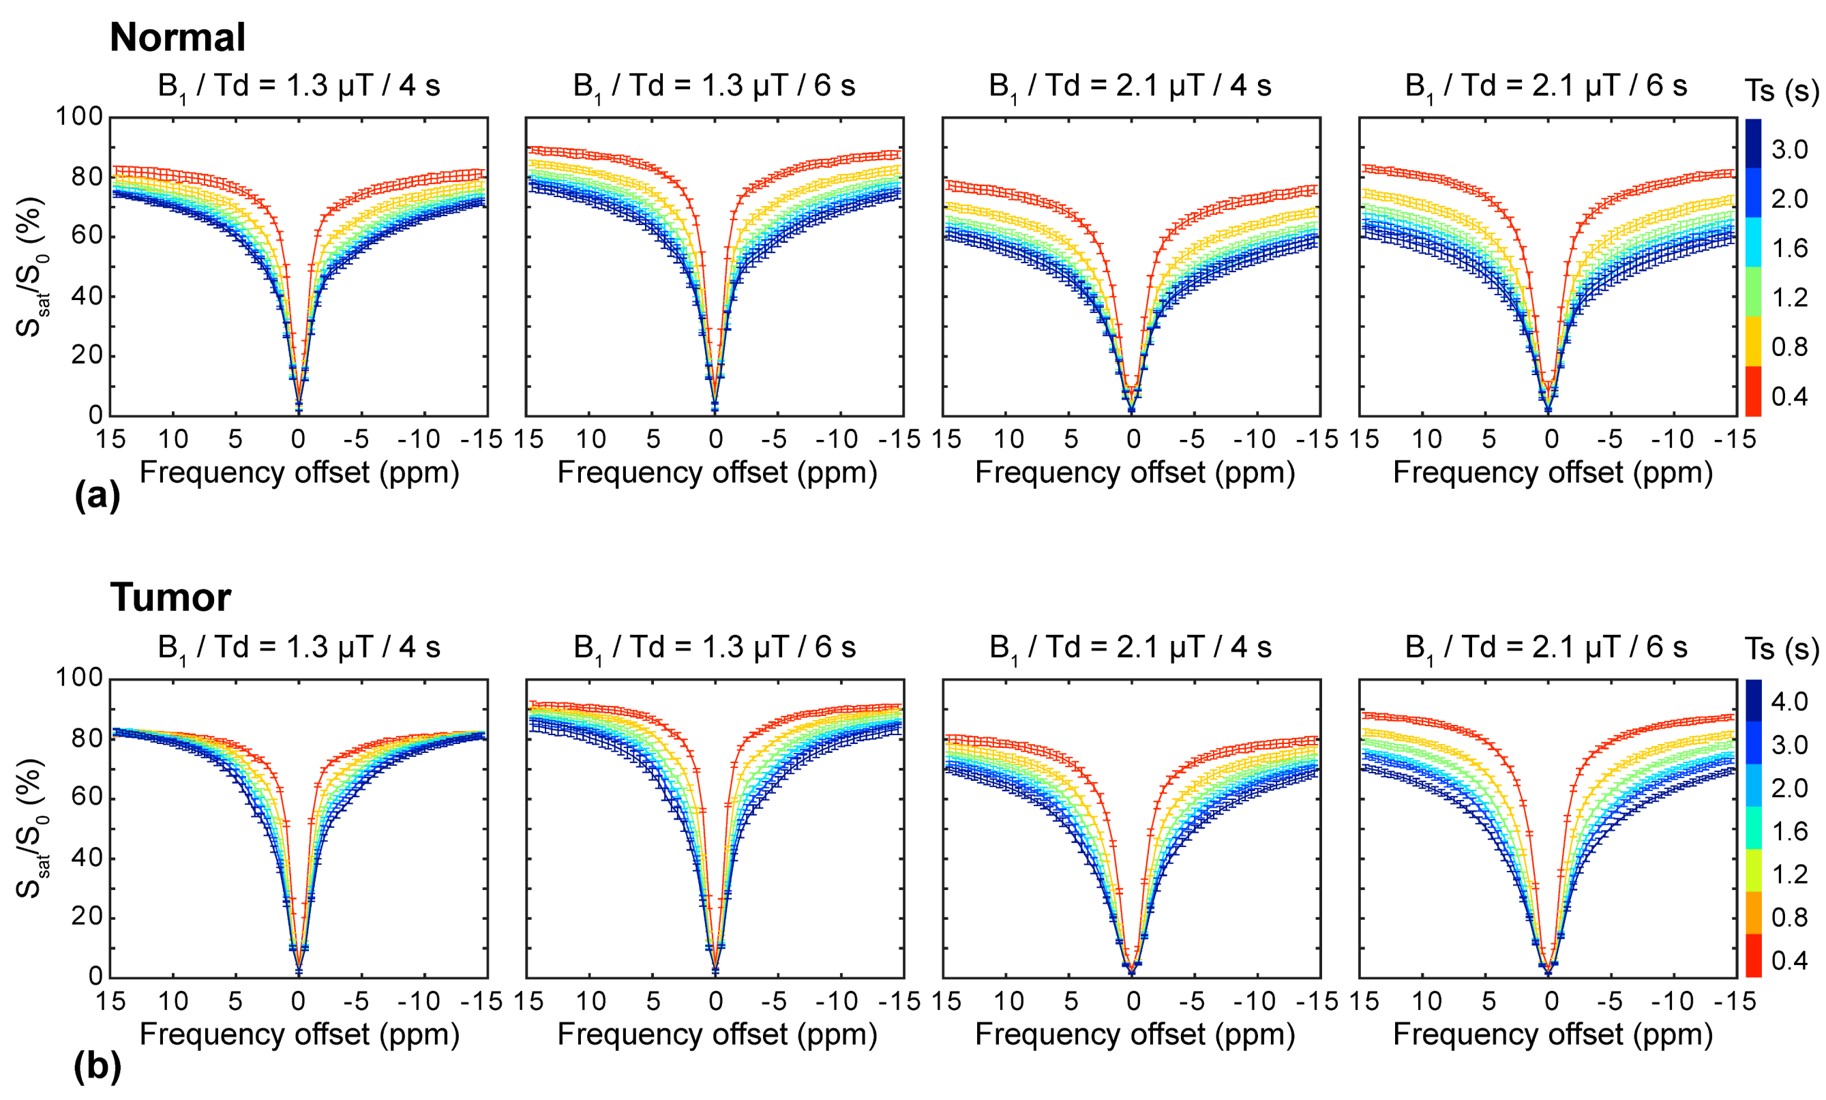
Figure 3 shows experimentally acquired Z-spectrums from normal and tumor brain regions. As expected, the RF saturation power, saturation length, and relaxation delay dependencies of the dilution effects from water DS and semisolid MT signals can be clearly seen. Broad Z-spectrums were observed at the higher saturation power levels and longer saturation lengths due to large RF saturation bandwidth and saturation effects. In addition, Z-spectrums were significantly reduced with decreasing relaxation delays.
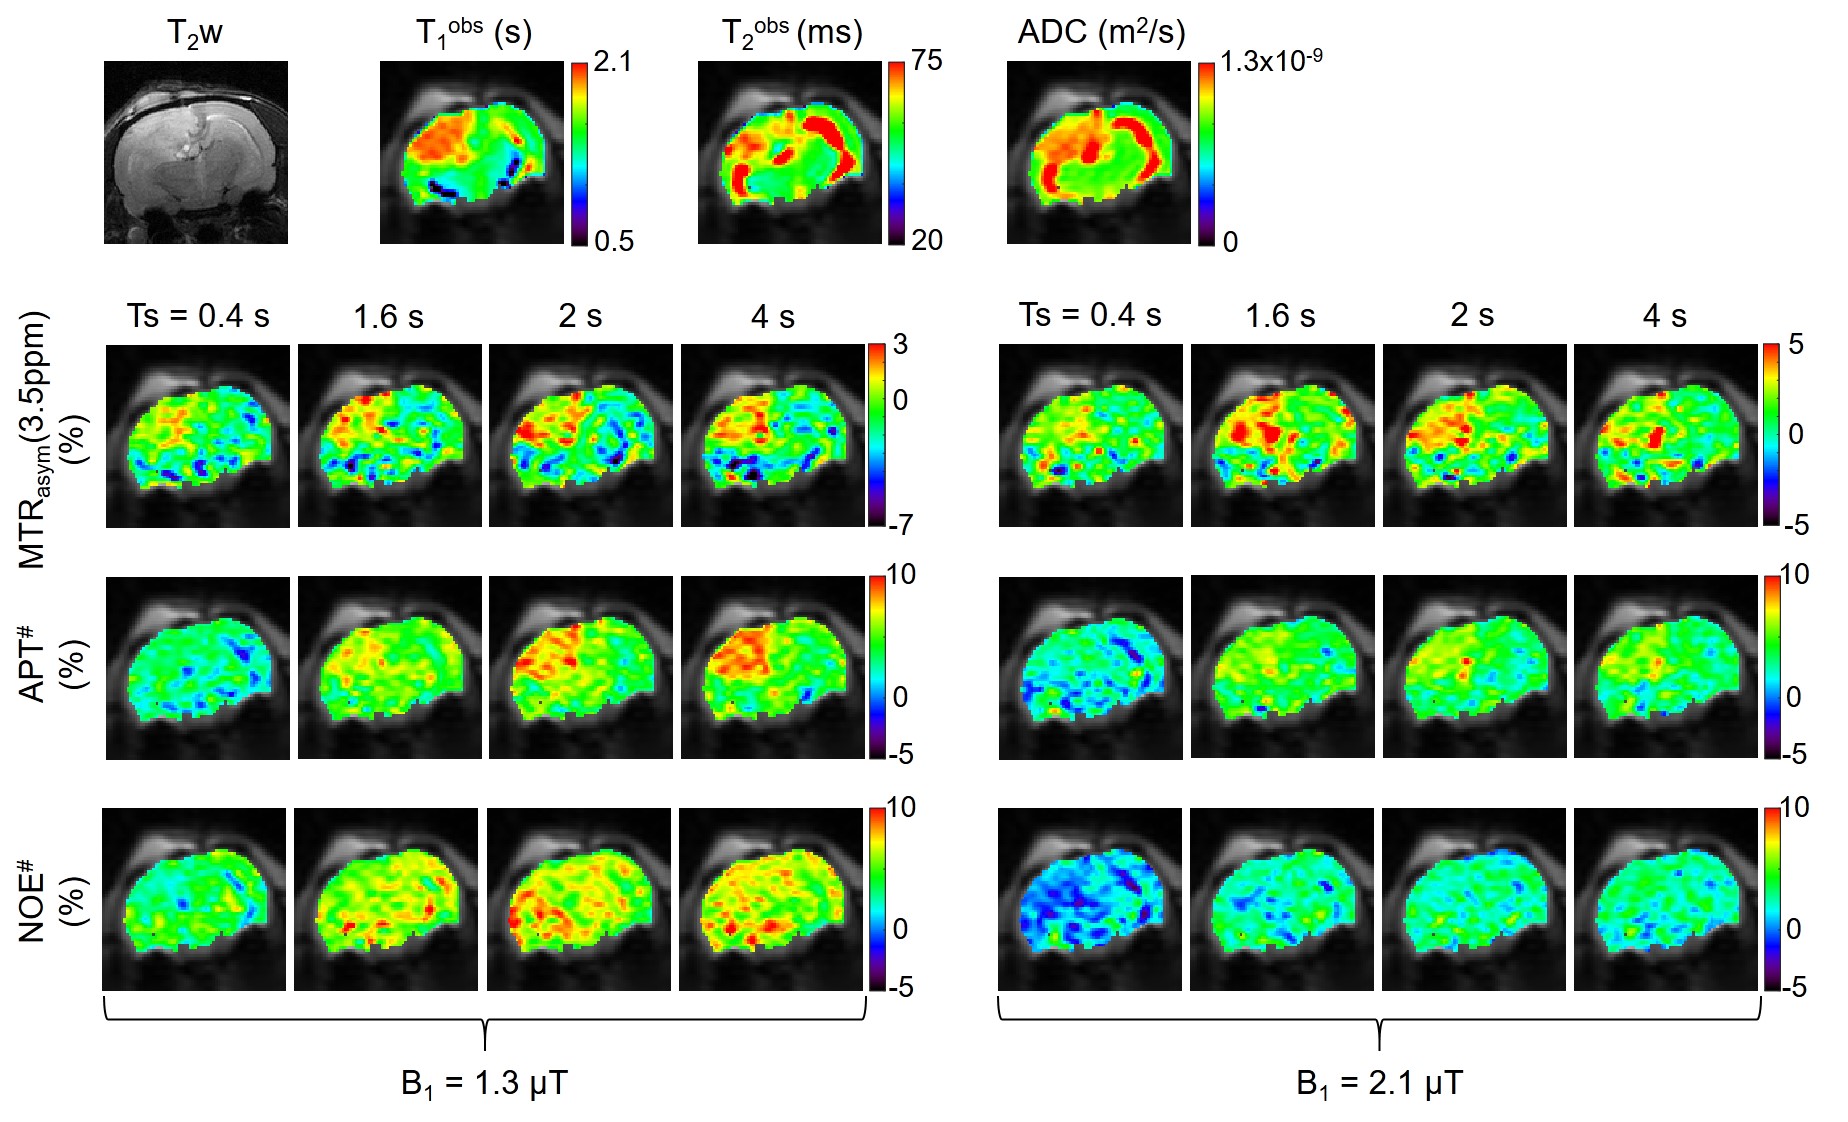
As shown in Figure 4 and 5, the overall APT# and NOE# signal intensities of the tumor at 1.3 μT were higher than at 2.1 μT while the MTRasym(3.5ppm) signal intensities of the tumor at 1.3 μT were smaller than at 2.1 μT because of the different RF saturation power and length dependences of the APT and NOE signals based on the factor that the NOE-related protons exchange rate is slower than the amide proton exchange rate. MTRasym(3.5ppm) signals at 1.3 μT increased with the RF saturation length while the MTRasym(3.5ppm) signals at 2.1 μT seemingly peaked at the RF saturation length of 1.6 sec. The APT# signals of the tumor at 1.3 μT increased with the RF saturation length while the APT# signals of the tumor at 2.1 μT seemingly reached a plateau after a RF saturation length of 1.6 sec. Overall NOE# signals were lower at 2.1 μT than at 1.3 μT.
Conclusions
At relatively low RF saturation power levels (< 1.3 μT) and short RF saturation lengths (< 1 s) at 4.7 T, the MTRasym(3.5ppm) image contrast was higher than the APT# contrast because the NOE# contrast is negative. However, the NOE# contrast became positive and the MTRasym(3.5ppm) contrasts was lower than the APT# contrast when relatively high saturation powers and long saturation lengths are applied. An elongated RF saturation (e.g. 2 sec) under a high RF saturation power (> 2 μT) reduces rather than increases MTRasym(3.5ppm) brain tumor contrasts. A further study on the clinical B0 strength 3 T is in progress.Acknowledgements
This work was supported in part by grants from the National Institutes of Health (R01EB009731, R01CA166171, and R01NS083435).References
1. Sun PZ, Lu J, Wu Y, Xiao G, Wu R. Evaluation of the dependence of CEST-EPI measurement on repetition time, RF irradiation duty cycle and imaging flip angle for enhanced pH sensitivity. Phys Med Biol 2013;58:N229-240.
2. Togao O, Hiwatashi A, Keupp J, Yamashita K, Kikuchi K, Yoshiura T, Yoneyama M, Kruiskamp MJ, Sagiyama K, Takahashi M, Honda H. Amide Proton Transfer Imaging of Diffuse Gliomas: Effect of Saturation Pulse Length in Parallel Transmission-Based Technique. PLoS One 2016;11:doi:10.1371/journal.pone.0155925.
3. Zhou J, Wilson DA, Sun PZ, Klaus JA, van Zijl PCM. Quantitative description of proton exchange processes between water and endogenous and exogenous agents for WEX, CEST, and APT experiments. Magn Reson Med 2004;51:945–952.
4. Woessner DE, Zhang S, Merritt ME, Sherry AD. Numerical solution of the Bloch equations provides insights into the optimum design of PARACEST agents for MRI. Magn Reson Med 2005;53:790–799. 5. Heo HY, Zhang Y, Lee DH, Hong X, Zhou J. Quantitative assessment of amide proton transfer (APT) and nuclear overhauser enhancement (NOE) imaging with extrapolated semi-solid magnetization transfer reference (EMR) signals: Application to a rat glioma model at 4.7 tesla. Magn Reson Med 2015;75:137-149.
6. Kim M, Gillen J, Landman BA, Zhou J, van Zijl PC. Water saturation shift referencing (WASSR) for chemical exchange saturation transfer (CEST) experiments. Magn Reson Med 2009;61:1441-1450.
7. Heo HY, Zhang Y, Jiang S, Lee DH, Zhou J. Quantitative assessment of amide proton transfer (APT) and nuclear overhauser enhancement (NOE) imaging with extrapolated semisolid magnetization transfer reference (EMR) signals: II. Comparison of three EMR models and application to human brain glioma at 3 Tesla. Magn Reson Med. 2015;75:1630-1639.
8. Zhou, J., Payen, J., Wilson, D.A., Traystman, R.J. & van Zijl, P.C.M. Using the amide proton signals of intracellular proteins and peptides to detect pH effects in MRI. Nature Med. 2003;9:1085-1090.
Figures