3754
The Chemical Exchange Saturation Transfer (CEST) and Nuclear Overhauser Enhancement (NOE) effects observed in human blood at 7 T under different physiological conditions.1Sir Peter Mansfield Imaging Centre, School of Physics and Astronomy, University of Nottingham, Nottingham, United Kingdom
Synopsis
CEST maps at 7T display higher APT and amine signal from the sagittal-sinus compared to elsewhere in the brain. We investigate CEST and NOE signals detected in ex-vivo blood under with varying oxygenation, haematocrit levels, pH and cell structure. Showing that human blood produces significant amounts of CEST and NOE, dominated by the cellular components of blood and independent of blood oxygenation. Clotting and lysing red-blood-cells has no impact on the observed CEST and NOE. We also observed increased APT and NOE with increasing pH. These result are important when interpreting exchange in conditions associated with blood volume change.
Background
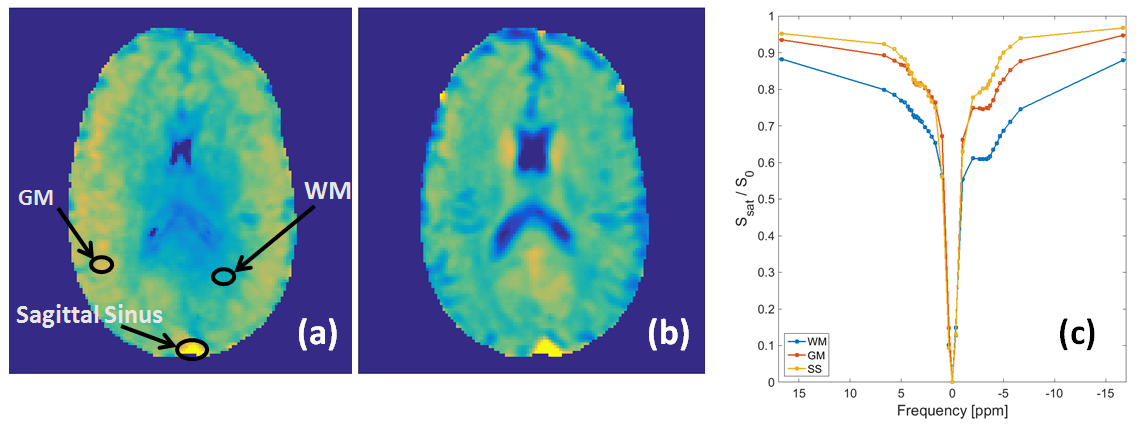
CEST maps at 7T display higher APT and amine signal from the sagittal-sinus compared to the rest of the brain (Figure 1): this motivated us to investigate further the source of this signal, particularly since it will contribute to the CEST signal from tissue. One previous study reported high CEST signal from blood1 but used z-spectrum asymmetry, which has low specificity to CEST and cannot separate APT and NOE at ±3.5ppm.Aim
To investigate the CEST and NOE signals detected in ex-vivo blood under with varying oxygenation, haematocrit (Hct) levels, pH and cell structure.Methods
Following local ethics committee approval, 37ml of venous blood was taken from 4 healthy male volunteers and stored in 4ml vials containing heparin, an anticoagulant and one 5ml vial actively clotting the red-blood-cells (RBC). Oxygenation levels of three 4ml samples were modulated by bubbling either 120ml of nitrogen gas or 100% medical-oxygen through the vials, to deoxygenate two samples and oxygenate the other. 0.25mM Gadolinium (ProHance) was added to one deoxygenated sample.
5 samples were spun in a centrifuge (15mins at 800rpm) and plasma was removed to produce a concentrated RBC (cRBC) sample with higher Hct level than whole blood. 3 samples were washed with a phosphate-saline-buffer to modify the pH to 6.8, 7.0 and 7.4. After MRI scanning, the blood was frozen and defrosted, lysing the blood before repeating the scan. A blood gas analyzer (i-STAT, Abbott) was used to measure the samples’ saturation of oxygen (sO2), pH and Hct levels.
MRI experiments were conducted on a 7T Philips Achieva, (32ch/Rx Nova head coil). Vials were placed in a temperature controlled water phantom at 37oC (PMT Instruments). Blood sedimentation was avoided by rotating the phantom between scans. 84 off-resonances were acquired using a saturation-prepared 3D-TFE sequence2. B1,rms=0.43, 0.87 and 1.52µT were achieved by applying a train of 40 sinc-pulses (bandwidth=200Hz, duty-cycle=50%). B0 and B1 maps were acquired for field inhomogeneity corrections3, along with T1 and T2* maps.
Proton pools sizes were estimated for MT, NOE, APT and amines using AREX4, or Lorentzian lineshape Difference (LD) fitting5 when T1s matched between samples.
Results
Oxygenation and Haematocrit Levels
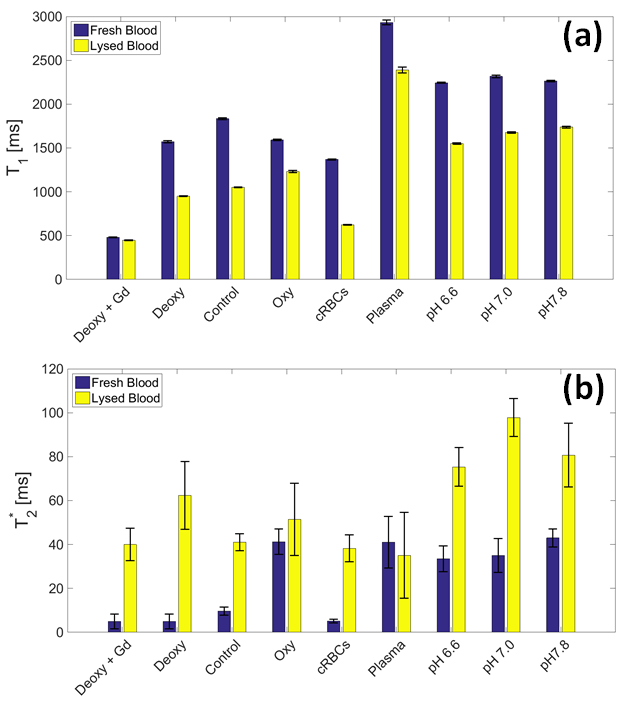
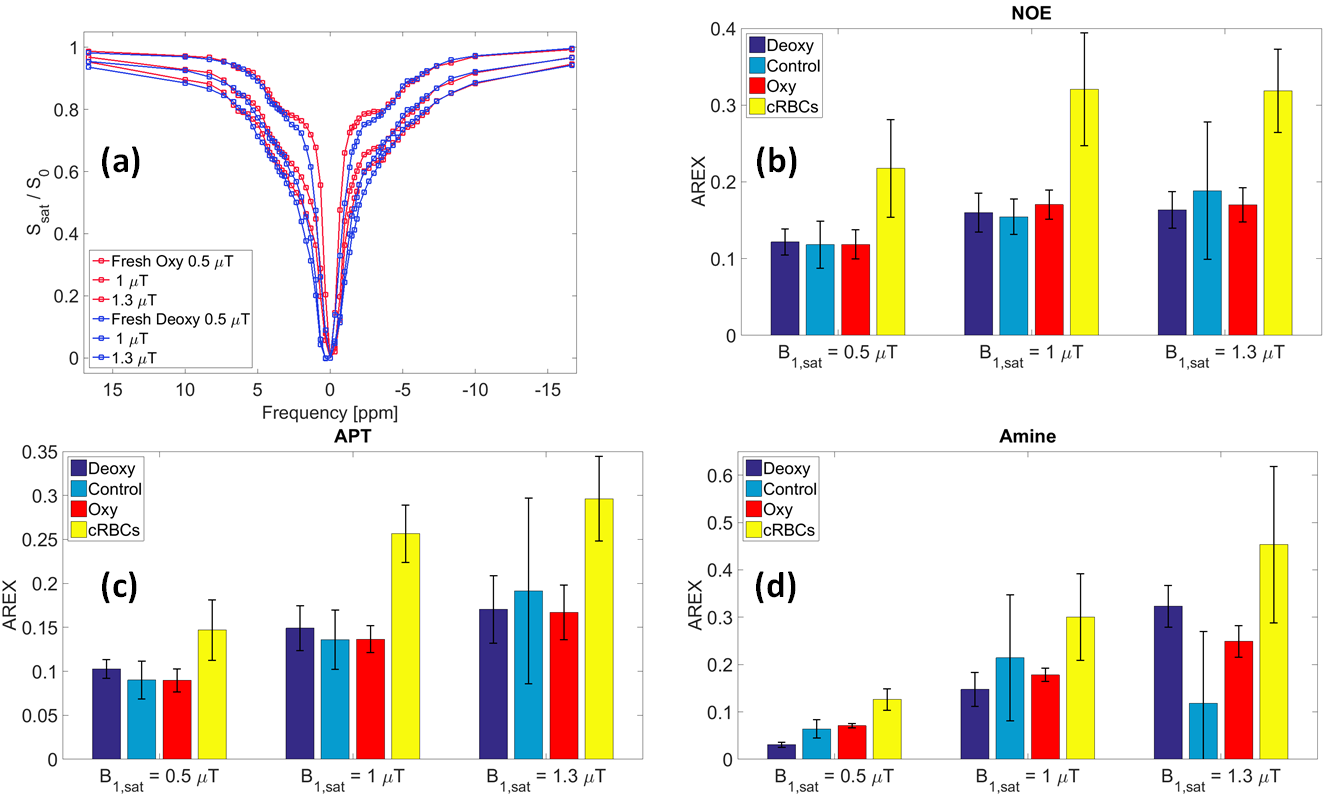
Z-spectra for fresh oxygenated and deoxygenated blood indicates that the shorter T2* of deoxygenated blood (Figure 2a) results in the broadening of the direct-water saturation (Figure 3a). Figure 3b-d shows that the NOE, APT and amines pool sizes assessed by AREX were not affected by the change in oxygenation. The NOE, APT and amines AREX signals increased by 47±2%, 41±4% and 49±8% respectively, comparing oxygenated, control and deoxygenated blood with the cRBC blood sample across the 3 saturation powers, which agrees well with the measured 40±2% increase in Hct level between the whole blood and cRBCs sample.
Cell Structure
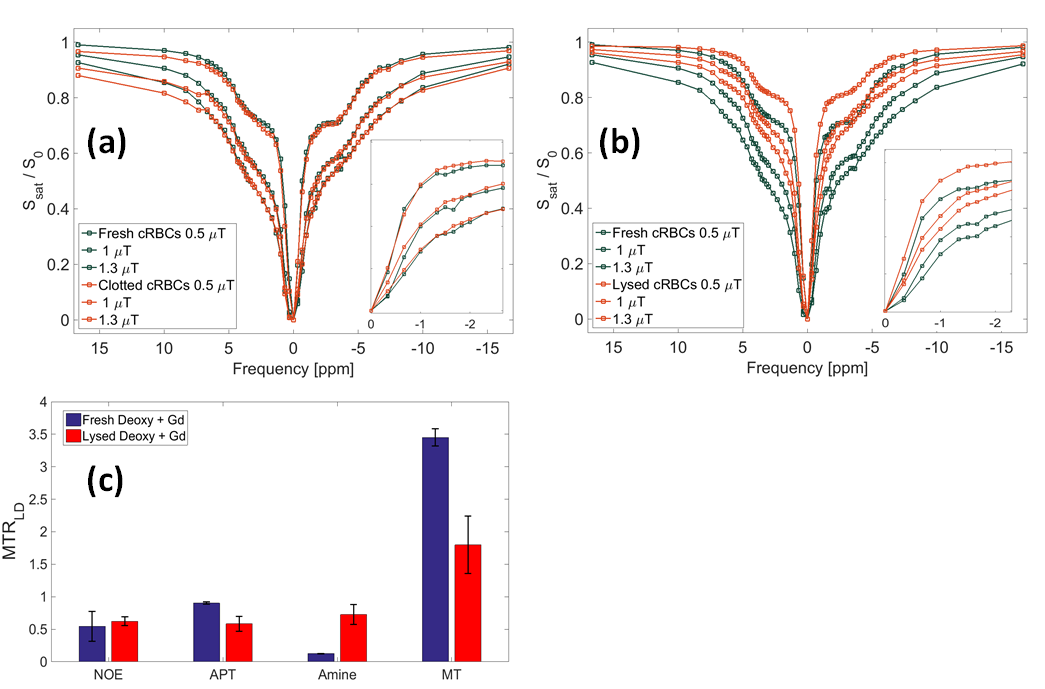
Little difference was seen between the spectra of fresh and clotted cRBCs (Figure 4a), although a peak seen at -1.7 ppm in fresh cRBC disappears after clotting. Similar effects were seen after lysing the cells (Figure 4b). Gd was added to match T1 before and after lysing (Figure 2a) to simplify quantification, and Figure 4c then showed that lysing produced a reduction in MT but little change in APT and NOE. The narrowing of the line width reduced direct water saturation leading to an increase in measured amines.
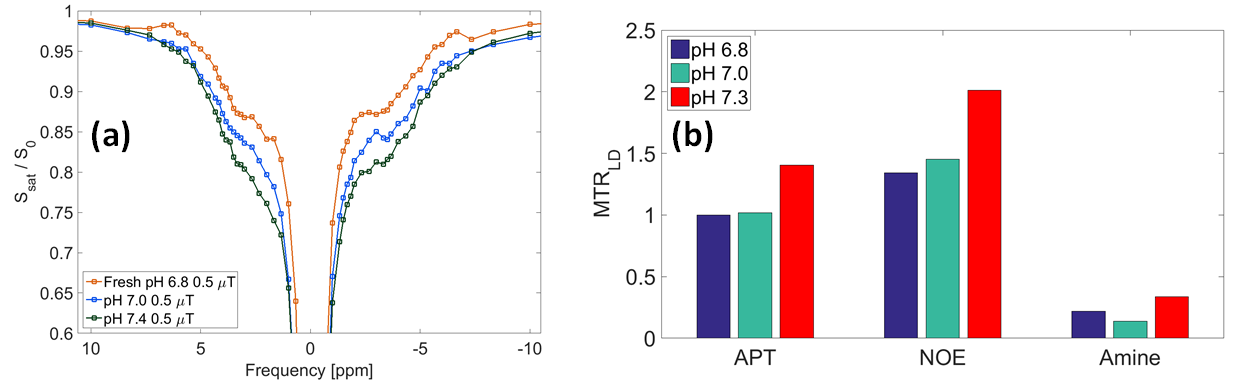
pH Effects
Figure 5a-b shows that measured APT, NOE and amines increased with increasing pH.
Discussion
Human blood produces significant amounts of CEST and NOE, dominated by the cellular components of blood and independent of blood oxygenation. Since APT signal is not affected by oxygenation in blood, assuming a total grey matter blood volume of 5% we can assume that a significant fraction of the small APT signal observed in the healthy brain originates in blood, and the contribution will be greater in conditions where the blood volume is pathologically increased.
Clotting and lysing cRBCs has no impact on the observed CEST and NOE, apart from the NOE at -1.7ppm, previously reported to decrease in stroke rat tissue relative to healthy tissue6. MT decreased on lysing but was unchanged on clotting.
APT level increased with increasing pH, as expected since the exchange is base-catalyzed7. NOE also behaved similarly suggesting that it is at least partly exchange relayed8.
This result is important when interpreting exchange in conditions associated with blood volume change. For instance, the APT increase reported in tumours9 could come partly from blood volume changes.
Acknowledgements
No acknowledgement found.References
[1] Zheng, Shaokuan, et al. "Chemical exchange saturation transfer effect in blood." Magnetic resonance in medicine 71.3 (2014): 1082-1092.
[2] Mougin, Olivier, et al. "High-resolution imaging of magnetisation transfer and nuclear Overhauser effect in the human visual cortex at 7 T." NMR in Biomedicine 26.11 (2013): 1508-1517.
[3] Windschuh, Johannes, et al. "Correction of B1-inhomogeneities for relaxation-compensated CEST imaging at 7 T." NMR in Biomedicine 28.5 (2015): 529-537.
[4] Zaiss, Moritz, et al. "Inverse Z-spectrum analysis for spillover-, MT-, and T1-corrected steady-state pulsed CEST-MRI–application to pH-weighted MRI of acute stroke." NMR in biomedicine 27.3 (2014): 240-252.
[5] Zaizz, Moritz, Benjamin Schmitt, and Peter Bachert. "Quantitative separation of CEST effect from magnetization transfer and spillover effects by Lorentzian-line-fit analysis of z-spectra." Journal of magnetic resonance211.2 (2011): 149-155.
[6] Zhang, Xiao-Yong, et al. "A new NOE-mediated MT signal at around− 1.6 ppm for detecting ischemic stroke in rat brain." Magnetic resonance imaging34.8 (2016): 1100-1106.
[7] Zhou, Jinyuan, et al. "Using the amide proton signals of intracellular proteins and peptides to detect pH effects in MRI." Nature medicine 9.8 (2003): 1085-1090.
[8] Jones, Craig K., et al. "Nuclear Overhauser enhancement (NOE) imaging in the human brain at 7T." Neuroimage 77 (2013): 114-124.
[9] Yan, K., et al., Assessing amide proton transfer (APT) MRI contrast origins in 9 L gliosarcoma in the rat brain using proteomic analysis. Molecular Imaging and Biology, 2015. 17(4): p. 479-487.
Figures