3752
Repeatability study of APT CEST quantification techniques for identification of ischaemic penumbra in stroke1Engineering Science, University of Oxford, Oxford, United Kingdom, 2Centre for Doctoral Training in Healthcare Innovation, University of Oxford, Oxford, United Kingdom, 3Radcliffe Department of Medicine, University of Oxford, 4Department of Mechatronics and Biomedical Engineering, Universiti Tunku Abdul Rahman, 5Nuffield Department of Clinical Neurosciences, University of Oxford
Synopsis
The aim of this study was to identify the analysis technique with the optimum repeatability for quantifying APT CEST imaging for use in the clinical setting. The repeatability of eight quantification techniques was assessed across imaging time points in healthy subjects, and between the contralateral hemispheres of stroke patients. Model-based techniques exhibited better repeatability compared to simpler model-free methods, and are thus better-suited for use in clinical imaging at 3T.
Purpose
To identify the analysis technique with the optimum repeatability for quantifying amide proton transfer (APT) CEST imaging for use in hyperacute stroke.
Methods
Six healthy individuals were recruited where they underwent four repeated CEST scans at three time-points (initial, 24h, one week). Thirty patients were recruited immediately after ischemic stroke under UK NRES agreed research protocols (12/SC/0292 and 13/SC/0362) and had a CEST scan1. All patient scans were performed on a 3T Siemens Verio scanner using a 32-channel head coil and included a 2D CEST with voxel dimensions 3.4 x 3.4 x 5.0mm3. Pulsed CEST saturation was performed with an average B1 of 0.55μT. The z-spectrum was sampled with a higher density of points around the amide resonance frequency (32 samples in total). The mean patient age was 77 years and the mean symptom onset to scan time was 2h 45min ±54min.
The APT quantification methods compared were: multipool apparent APT ratio (APTR*), Lorenztian Difference Analysis (APTRLDA)2, three-point offset method3 (APTRoffset), MTRRex, AREX4, classical asymmetry (MTasym), and enhanced asymmetry (MTenhasym). In multipool APTR*, after fitting multiple pools to the spectral data, only a subset were simulated to get a single metric for each pool. APTR*3pool comprises a bulk water pool, an amide pool, and a third pool which attempts to account for both semisolid and NOE effects5, whereas APTR*4pool has an additional pool attempting to separate them.
The repeatability of each method between individuals was assessed separately in healthy subjects and in patient contralateral tissue, and between time points. Repeatability was measured using the coefficient of variation. Additionally, the coefficient of variation within subjects was computed; a measure of spatial variability that is expected to be low in well-behaved metrics due to homogeneity of the APT signal in brain tissue.
Results
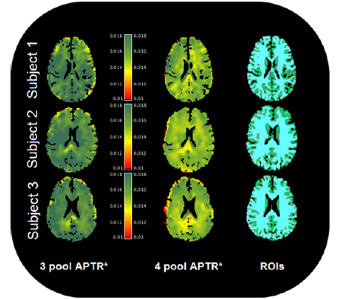
Representative maps of the healthy subjects are shown in Fig. 1. The healthy subject maps exhibited homogenous APTR* using both APTR*3pool and APTR*4pool.
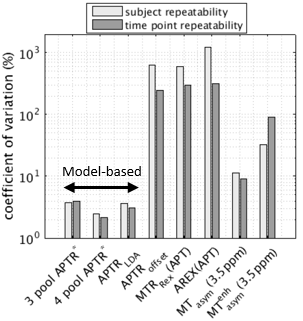
The repeatability of the APTR signal across healthy subjects and time points is shown in Fig. 2. Model-based quantification exhibited a coefficient of variation at least three times smaller than model-free methods. APTR* did not vary significantly across patients or time-points in healthy volunteers (two-way ANOVA p>0.01). APTR*4pool had the optimum repeatability (smallest coefficient of variation: 2.2% across time points, 2.5% across subjects), followed by the LDA method (3.0%, 3.7%) and APTR*3pool (4.0%, 3.8%). The best-performing model-free method was classical MTasym (9.0%, 11.0%).
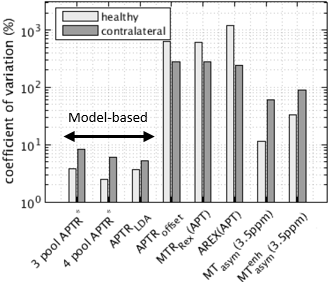
Repeatability of APTR* across patients (Fig. 3) provided a very similar ranking of model-based methods, with lower repeatability seen in this group. APTR* repeatability across patients for APTR*3pool, APTR*4pool, APTRLDA was 8.2%, 5.9%, and 5.3% respectively.
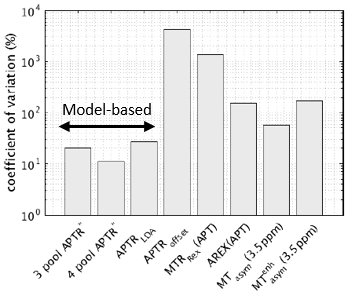
APTR*4pool had the lowest spatial variability (Fig. 4, 11.2%) followed by APTR*3pool (20.0%).
Discussion
In healthy brain tissue pH is tightly regulated to 7.1 reflected in the consistency of multipool APTR* across healthy subjects and time points. Repeatability of multipool APTR* was lower in contralateral tissue compared to healthy tissue. This is may be explained by variations in the burden of white matter disease in clinical populations, and by noise from motion artefact. Increasing the number pools can lead to overfitting which would result in higher spatial variation, however adding a fourth pool to the model-based analysis yielded more repeatable APTR* in healthy subjects and a lower coefficient of variation within brain tissue, suggesting better signal separation.
In this clinical study at 3T it was difficult to accurately identify the spectral boundaries of the solute pools. The performance of APTRoffset, MTRRex, and AREX is predicated on having well-defined boundaries and these metrics demonstrated very good detection sensitivity in the 9.4T studies where they have been used. Similarly, with the LDA method, the amplitude of the difference spectrum was small compared to the 7T study it was introduced in.
Conclusion
Multipool model-fitting provided the most robust and repeatable measure of APT signal in healthy subjects and in stroke patients at 3T compared to simpler model-free methods, and is thus better-suited for use in clinical imaging.Acknowledgements
Yunus Msayib acknowledges the support of the RCUK Digital Economy Programme grant number EP/G036861/1 (Oxford Centre for Doctoral Training in Healthcare Innovation).References
G. W. Harston, Y. K. Tee, and N. Blockley, et al. “Identifying the ischaemic penumbra using pH-weighted magnetic resonance imaging,” Brain, vol. 138,no. Pt 1, pp. 36–42, Jan 2015.
C. K. Jones, A. Huang, and J. Xu, et al. “Nuclear Overhauser enhancement (NOE) imaging in the human brain at 7T,” Neuroimage, vol. 77, pp. 114–124, Aug 2013.
H. Li, Z. Zu, and M. Zaiss et al. “Imaging of amide proton transfer and nuclear Overhauser enhancement in ischemic stroke with corrections for competing effects,” NMR Biomed, vol. 28, no. 2, pp. 200–209, Feb 2015.
M. Zaiss, J. Xu, and S. Goerke, et al. “Inverse Z-spectrum analysis for spillover-, MT-, and T1 -corrected steady-state pulsed CEST-MRI–application to pH-weighted MRI of acute stroke,” NMR Biomed, vol. 27, no. 3, pp. 240–252, Mar 2014.
Y. K. Tee, G. W. Harston, and N. Blockley, et al. “Comparing different analysis methods for quantifying the MRI amide proton transfer (APT) effect in hyperacute stroke patients,” NMR Biomed, vol. 27, no. 9, pp. 1019–1029, Sep 2014.
Figures