3751
Voxel-wise comparison of amide proton transfer (APT) weighted image and fluorodeoxyglucose (FDG)-PET in brain tumors with a PET/MR system1Department of Clinical Radiology, Kyushu University Graduate School of Medical Sciences, Fukuoka, Japan, 2Department of Molecular Imaging and Diagnosis, Kyushu University Graduate School of Medical Sciences, Fukuoka, Japan, 3Healthcare, Philips Electronics Japan, 4Philips Research
Synopsis
Amide proton transfer (APT) imaging has been reported to be useful for assessing malignancy or evaluating treatment efficacy. In this study, we evaluated the validity of APT signals in brain tumors by direct voxel-wise comparison with standardized uptake values (SUVs) from fluorodeoxyglucose positron emission tomography (FDG-PET) on a PET-magnetic resonance (PET/MR) system. APT imaging showed discrepancies with FDG-PET due to structural inhomogeneity, and the correlation between APT signals and SUVs was poor. The correlation was significantly improved after correcting for the apparent diffusion coefficient (ADC). APT/ADC could be a reliable metabolic marker with better correlation with SUVs.
Purpose
Amide proton transfer (APT) imaging is a chemical exchange saturation transfer (CEST) imaging method. It involves the visualization of the exchange of protons between free tissue water and the amide groups (-NH) of endogenous mobile proteins and peptides.1 APT imaging is useful for differentiating high-grade glioma from low-grade glioma,2 and evaluating the efficacy of chemotherapy.3 However, to our knowledge, the reliability of the APT signal has not been validated by comparisons with other metabolic imaging techniques.
The positron emission tomography-magnetic resonance (PET/MR) system can simultaneously acquire functional MR and fluorodeoxyglucose (FDG)-PET scans with precise image co-registration. Further, this system enables direct voxel-by-voxel comparison of standardized uptake values (SUV) from PET and other functional MR parameters such as the apparent diffusion coefficient (ADC)4 and APT signal.
The purpose of the present study was to investigate the relationship between the APT signals and SUVs of FDG-uptake for brain tumors in a voxel-wise manner.
Methods
<Image Acquisition> Five patients with known brain tumors (three high-grade and two low-grade glioma) were included in this study and scanned using an Ingenuity TF PET/MR scanner (Philips Healthcare, Cleveland, OH). After the scout image and a 3D-T1WI for attenuation correction were acquired, the participants underwent FDG-PET imaging with 3D-ordered subset expectation maximization and time of flight. The sampling time was 5 minutes, and the images were reconstructed with 23 mm voxels. After PET imaging, transverse 2D-T2WI and T1WI were obtained to cover the entire tumor volume. A DWI with a single shot EPI (b = 0 and 1000) was obtained after the anatomical images, and an ADC map was generated. Finally, APT imaging with the 3D fast spin-echo Dixon method5 was performed. Briefly, a saturation pulse (duration: 2.0s, power: 2.0μT) was applied to obtain Z-spectra at seven different frequency offsets: ± 2.7 ppm, ± 3.5 ppm, ± 4.3 ppm, and -1560 ppm. The scan was repeated three times at +3.5 ppm with echo shifts (ΔTE = 0.4 ms) for Dixon B0 mapping. The APT image corrected by a three-point Dixon-type B0 map was generated. Other parameters were: TR/TE = 3500/5.7 ms, FOV = 212 × 183 mm, acquisition matrix = 116 × 116, voxel size = 1.8 × 1.8 mm, slice thickness = 4.4 mm, slices = 9, and scan duration = 3m52s.
<Image Processing> Image registration with rigid transformation was performed between the T2WI, ADC map, APT, and PET image on an IntelliSpace Portal workstation (version 6.0, Philips Healthcare). The T2WI, ADC map, and FDG-PET image were then resliced in accordance with the APT image (4.4 mm). Subsequent image processing was performed using the ImageJ software (version 1.43, NIH, Bethesda, MD). APT and PET image were divided by the ADC map, and APT/ADC and SUV/ADC maps were generated. On T2WI, regions of interest (ROIs) were manually drawn along the border of the tumor in all slices. The ROIs were then copied onto the other images. After extracting the tumor area, in-plane image resolution was interpolated to 22 mm. The APT signals, SUVs, APT/ADCs, and SUV/ADCs were recorded on a voxel-by-voxel basis for all slices, and scatter plots were generated for each tumor. The voxels with ADC < 0.5 ×10⁻³ mm2/s were excluded from analysis. The correlation coefficient between APT vs. FDG-SUV, APT/ADC vs. FDG-SUV and APT/ADC vs. FDG-SUV/ADC were analyzed by Pearson’s correlation, and compared by ANOVA followed by Tukey’s test.
Results and Discussion
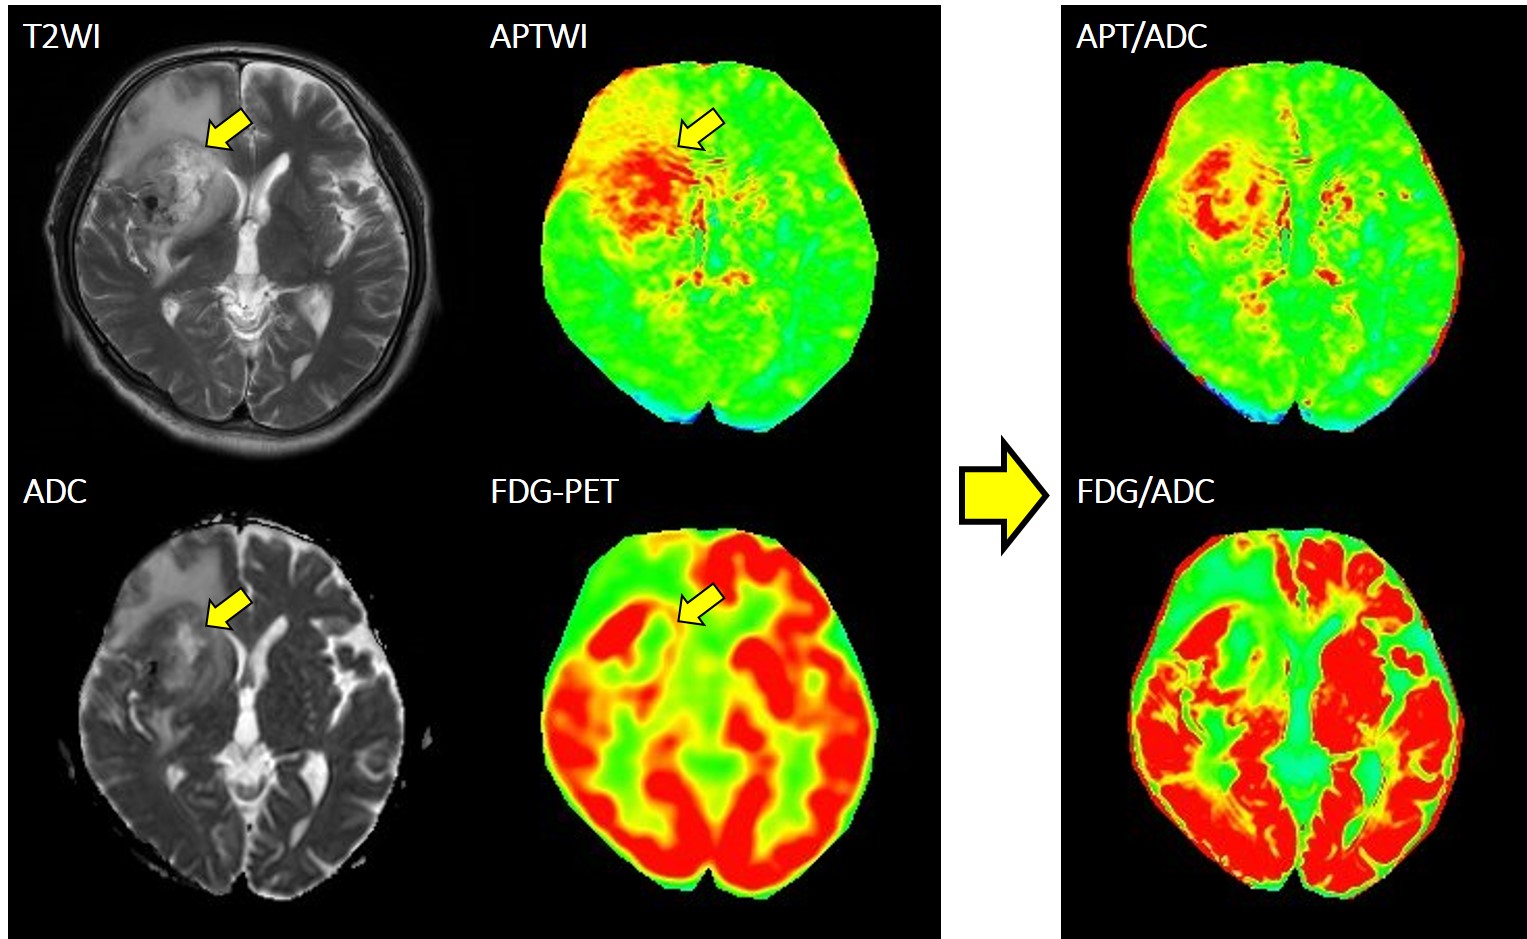
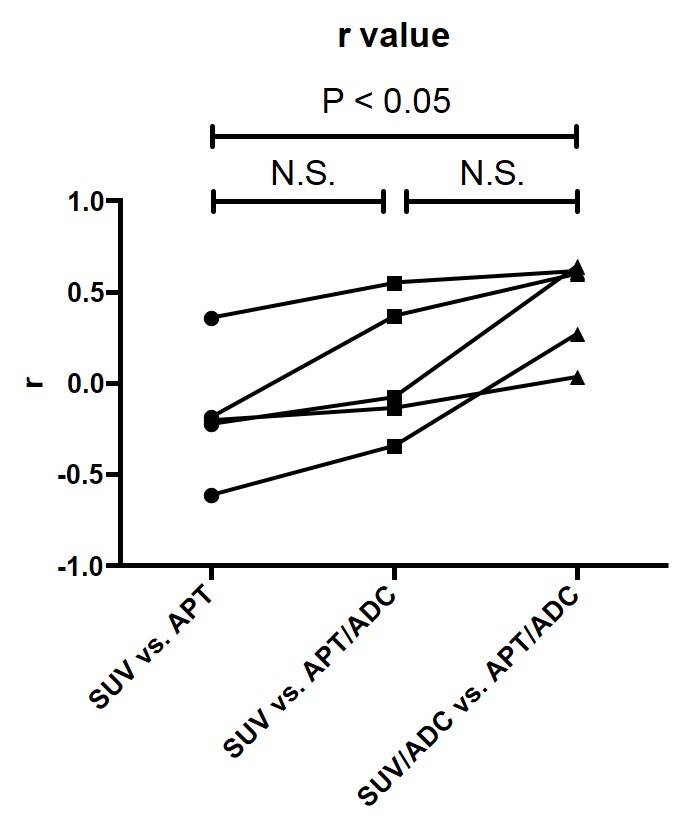
A representative case of glioblastoma is shown in Figure 1. The tumor is heterogenic, and a necrotic area with prolonged T2 and ADC (arrows) shows a higher APT signal despite lower FDG uptake, resulting in discrepancies between the images. After dividing by the ADC map, the agreement improved remarkably. The APT signal did not show a positive correlation with FDG-SUV (r = -0.17 ± 0.35) in voxel-based comparison (Fig.2). After correction by ADC, APT/ADC showed slightly better correlation with FDG-SUV in all cases (r = 0.07 ± 0.37), and APT/ADC vs. SUV/ADC showed a significantly better correlation (r = 0.43 ± 0.27, P < 0.05).
APTWI is determined by both amide-proton concentration and magnetization transfer (MT), or T1/T21, which might be affected by structural inhomogeneity in tumors such as necrotic portion of high proteinaceous fluid. Therefore, ADC-correction of APT signals and FDG-uptake could compensate the inhomogeneity and help to demonstrate correlation of metabolic images between protein and glucose.
Conclusion
Voxel-wise comparison of APTWI and FDG-PET in brain tumors revealed that APT did not correlate well with SUV due to structural inhomogeneity, but correction with ADC could help improve the correlation between the two functional imaging.Acknowledgements
This study has received funding by JSPS KAKENHI Grant Number JP16K19827 and Fukuoka Foundation for Sound Health Cancer Research Fund.References
1. Vinogradov E, Sherry AD, Lenkinski RE. CEST: from basic principles to applications, challenges and opportunities. J Magn Reson. 2013;229:155-72.
2. Togao O, Yoshiura T, Keupp J, et al. Amide proton transfer imaging of adult diffuse gliomas: correlation with histopathological grades. Neuro Oncol. 2014;16(3):441-8.
3. Sagiyama K, Mashimo T, Togao O, et al. In vivo chemical exchange saturation transfer imaging allows early detection of a therapeutic response in glioblastoma. Proc Natl Acad Sci U S A. 2014;111(12):4542-7.
4. Sagiyama K, Watanabe Y, Kamei R, et al. Multiparametric voxel-based analysis of standardized uptake values and apparent diffusion coefficients in soft-tissue tumors with a positron emission tomography-magnetic resonance system: Application for evaluation of treatment effect. ISMRM 2016.
5. Togao O, Keupp J, Hiwatashi A, et al. Amide proton transfer imaging of brain tumors using a self-corrected 3D fast spin-echo dixon method: Comparison With separate B0 correction. Magn Reson Med. 2016.
Figures