3750
A longitudinal study of brain tumors in the course of radiotherapy using protein CEST MRI at 7T1Medical Physics in Radiology, German Cancer Research Center, Heidelberg, Germany, 2Radiation Oncology, University Hospital of Heidelberg, Heidelberg, Germany, 3Radiology, German Cancer Research Center, Heidelberg, Germany
Synopsis
Chemical Exchange Saturation Transfer (CEST) offers unique contrasts sensitive to micro environmental information such as protein concentration and pH. Thus CEST could be a promising biomarker to investigate radiotherapy-induced changes in tissue. In this study we examine brain tumor patients in the course of definitive radiotherapy on a 7 T whole-body scanner using the relaxation compensated contrast AREX. We compare the results of CEST imaging to Single Voxel Spectroscopy and high-resolution T2-weighted imaging.
Purpose
Radiotherapy is commonly used in the management of glioblastoma1. However, reliable biomarkers to assess treatment response in early stages are urgently needed. Chemical Exchange Saturation Transfer (CEST) allows the indirect
detection of mobile proteins. Several studies have shown that CEST contrasts depend on protein concentration, protein folding state
and pH2-5. Consequently CEST may be a promising contrast to assess radiotherapy-induced changes. Here we present the first results of a follow-up study of inoperable glioma patients in the course of radiotherapy using relaxation compensated CEST at a 7T whole–body scanner.
Methods
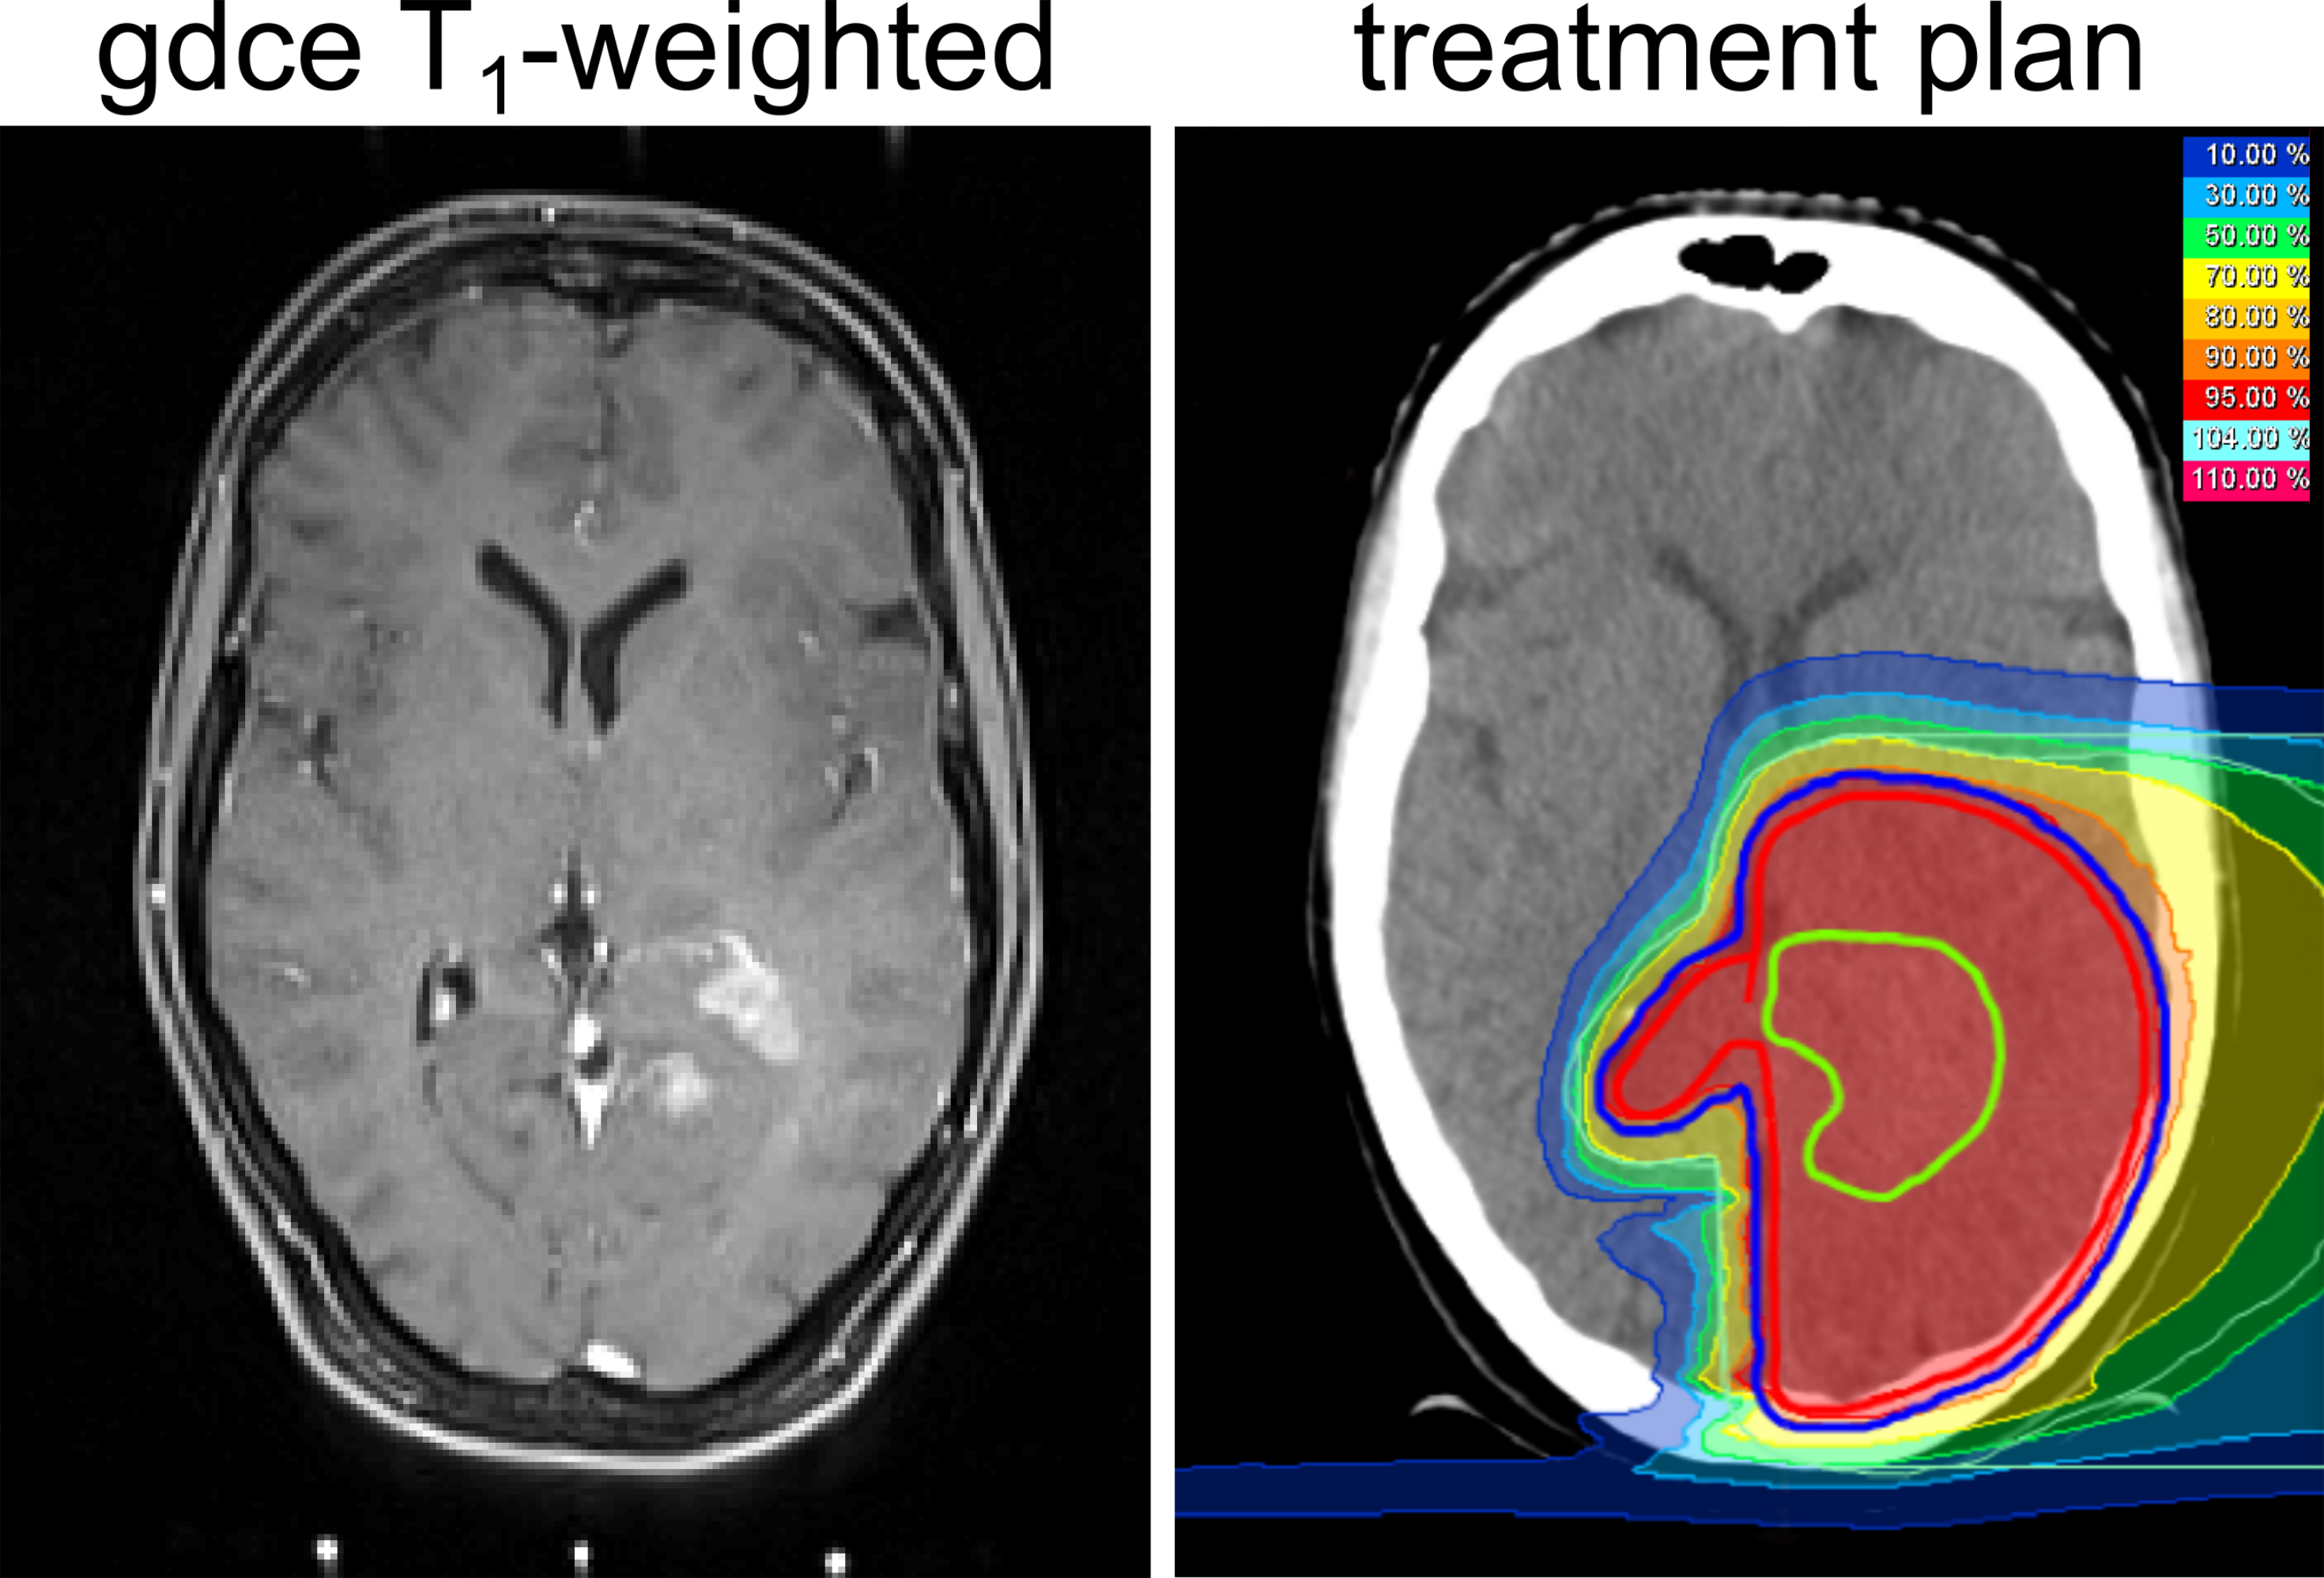
One patient with newly diagnosed glioblastoma was examined one day before definitive proton radiotherapy (total duration 6 weeks, 60 Gy(RBE) in 30 fractions, Figure 1), one week after the end of radiotherapy and a third time 6 weeks follow-up. The examinations and radiation treatments were approved by the local ethics committee of the Medical Faculty of the University of Heidelberg and written consent was received from the patient.
Imaging: Spectral highly-resolved Z-spectra were obtained by a centric-reordered 2D-GRE-CEST sequence (3 slices with resolution of 1.72x1.72x5mm3) implemented on a 7 T whole body scanner (Siemens Healthineers, Erlangen, Germany) using a 24-channel head coil for reception. Two CEST measurements with different B1 were performend (150 Gaussian-shaped pulses with tp=15ms, DC=60% and 59 adapted frequency offsets). T1–mapping was achieved by adiabatic inversion recovery GRE. High resolution 3-dimensional T2–weighted imaging was performed using a TSE sequence (resolution: 0.3x0.3x2mm3). The WASABI6 sequence was used to map B0 and B1 field inhomogeneities. Water-suppressed 1H single-voxel spectra (SVS) of tumor tissue and contralateral white matter (CLWM) were acquired with a semiLASER sequence7 (voxel size: (2cm)3, TR/TE/α = 4000ms/144ms/90°, 48 averages).
Post processing: Image registration was performed to first measurement (pre treatment) using the MITK software8. Lorentzian fit analysis allowed the isolation of the CEST peaks in B1-corrected Z-spectra9. Application of the inverse metric at -3.5ppm yields the relaxation compensated CEST contrast AREXNOE10. The downfield rNOE suppressed AREX (dnsAREX2) effect was calculated using the ratio rrNOE = 0.2:
$$dnsAREX (+3.5ppm) = AREX(+3.5ppm) - r_{rNOE} \cdot AREX(-3.5ppm)$$
Results
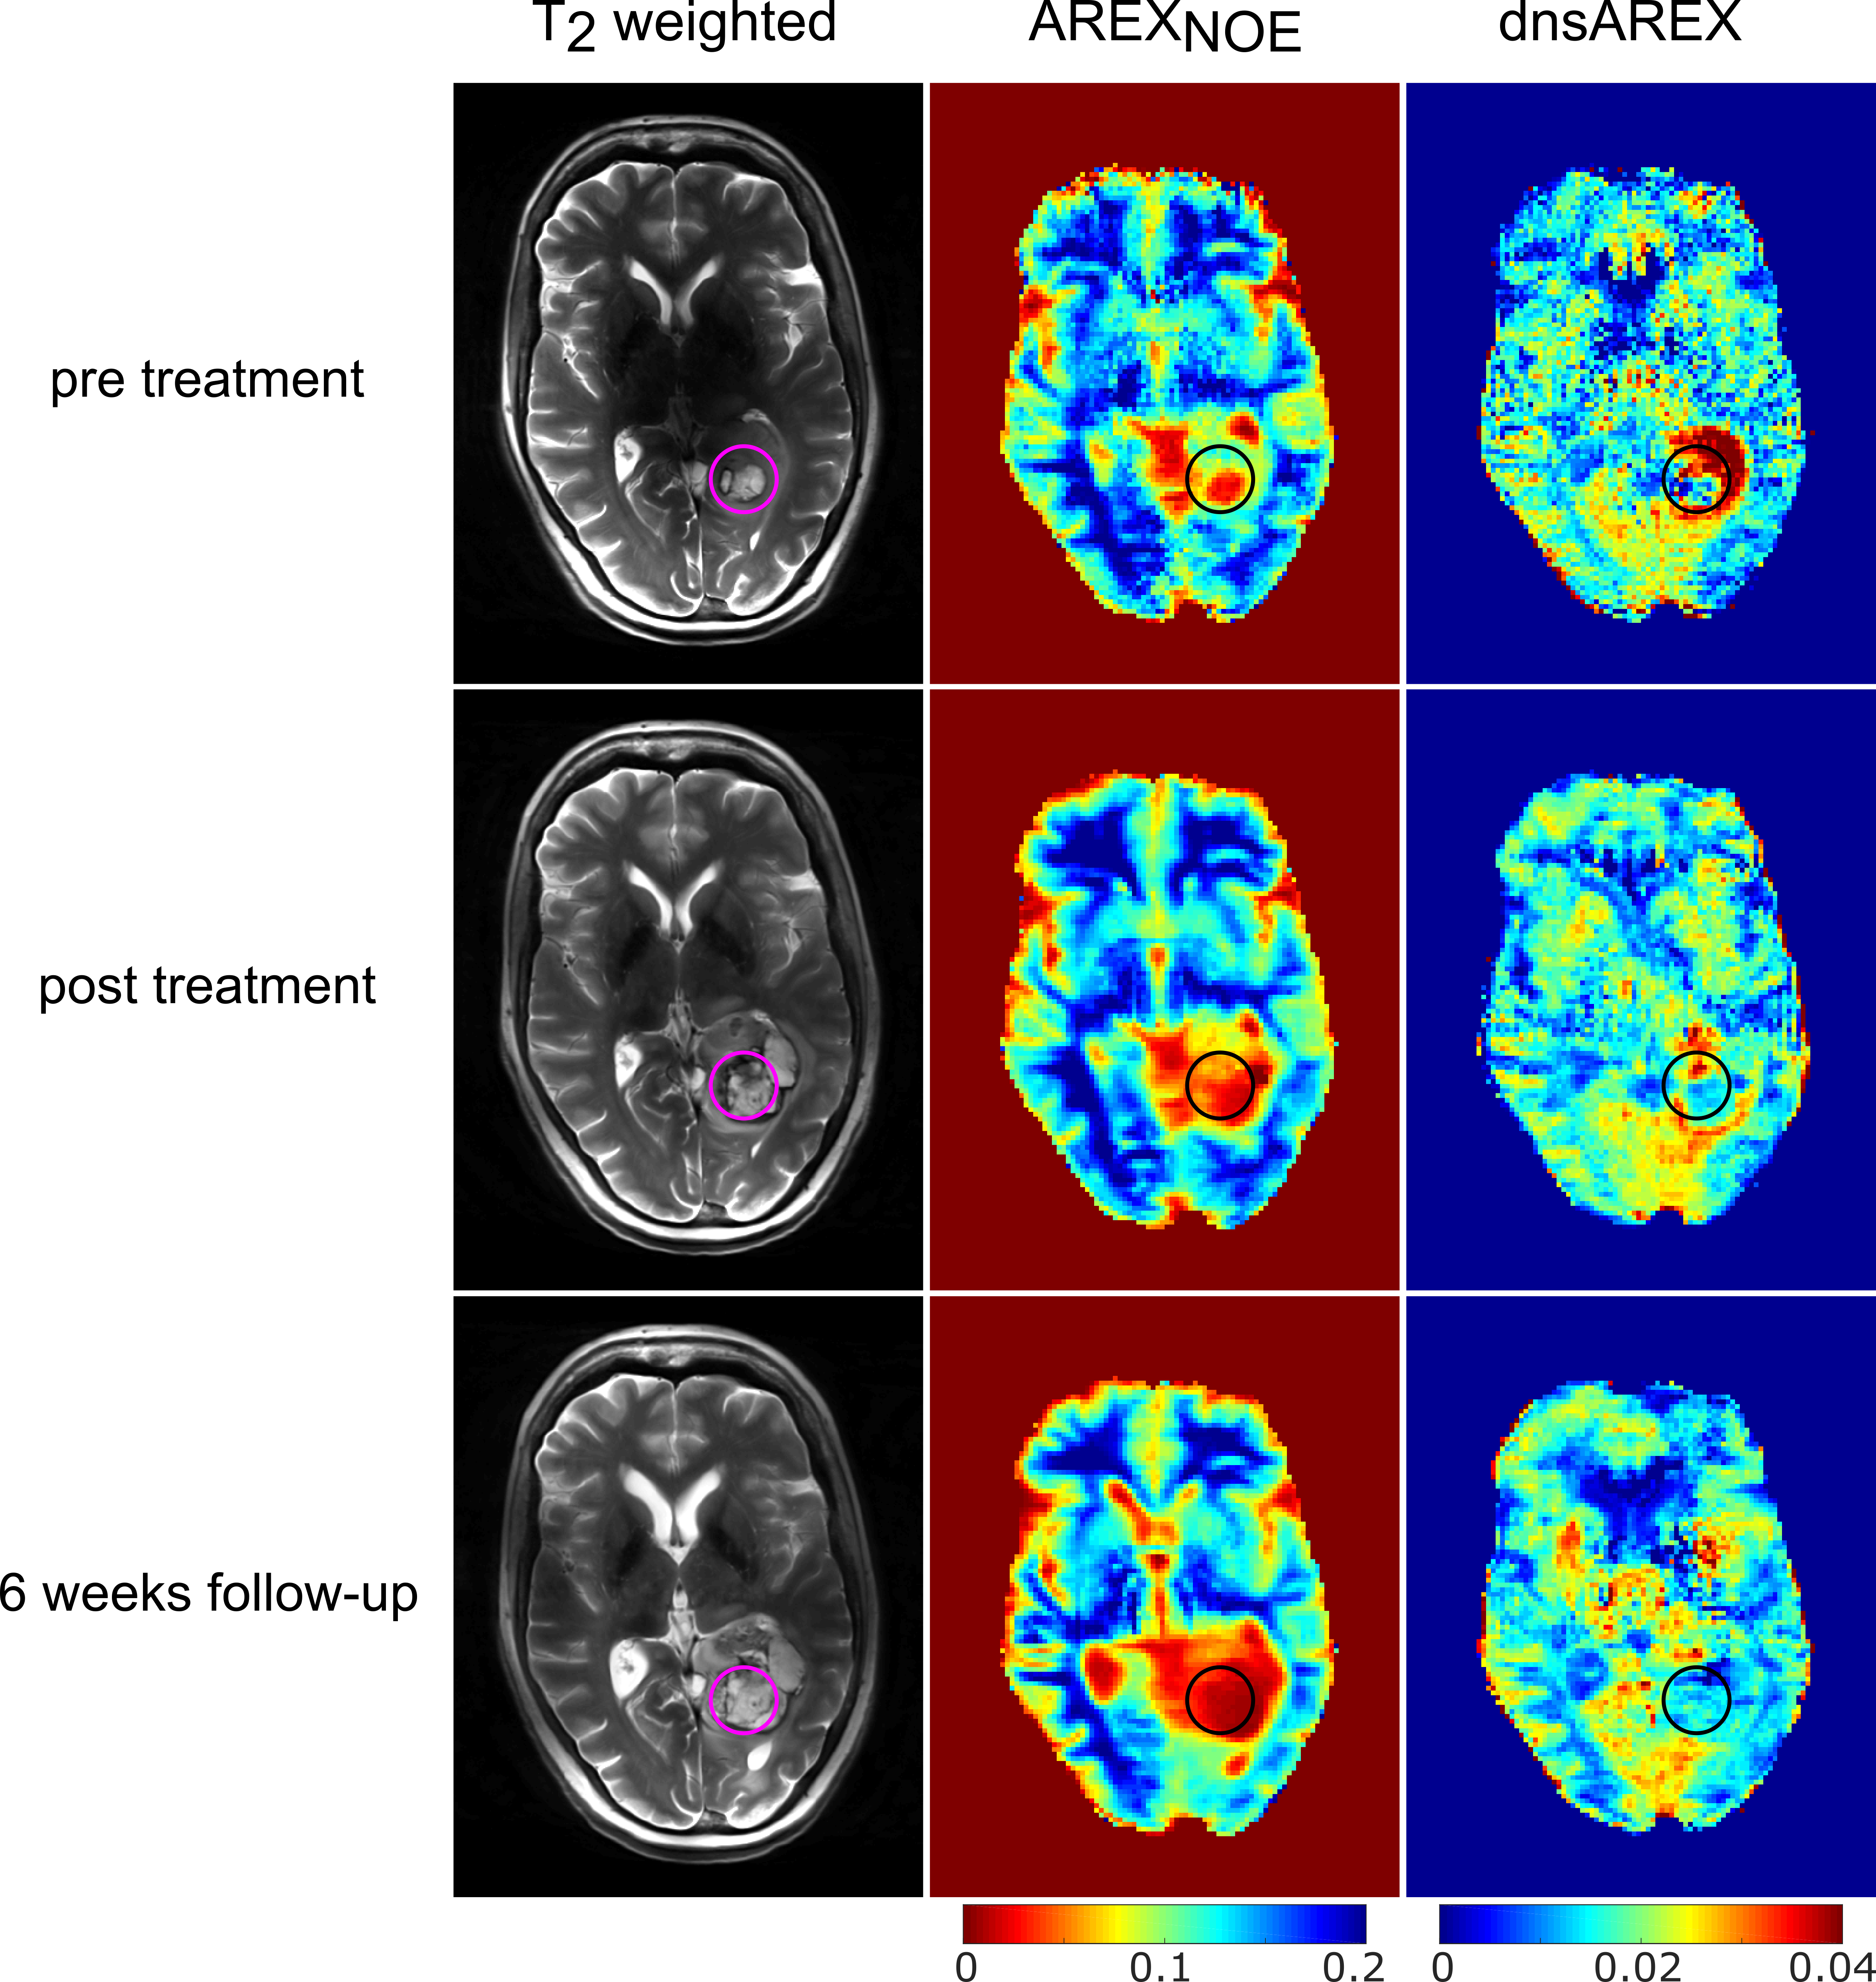
Application of an external registration transformation allows direct and robust comparison of 2D CEST images, which were acquired in different examinations (Fig. 2). The external registration transformation was determined by the co-registration of T2-weighted 3D image datasets. Results for an exemplary slice are depicted in Figure 2. The dilated ventricles in the third measurement are due to a constriction caused by tumor expansion in a lower part of the cerebrospinal fluid system (not visible in the demonstrated slice).
Tumor volume apparent on T2–weighted images increases after therapy. AREXNOE is decreased in the tumor regions, whereby the likely necrotic
part has values close to zero.
The AREXNOE hypointense region enlarges after therapy. dnsAREX before treatment shows no direct correlation to the tumor region on T2, however it depicts a hyperintense ring structure in the edema around the necrotic part (see Figure 2 ROI). After treatment this hyperintensity is vastly reduced in size and intensity.
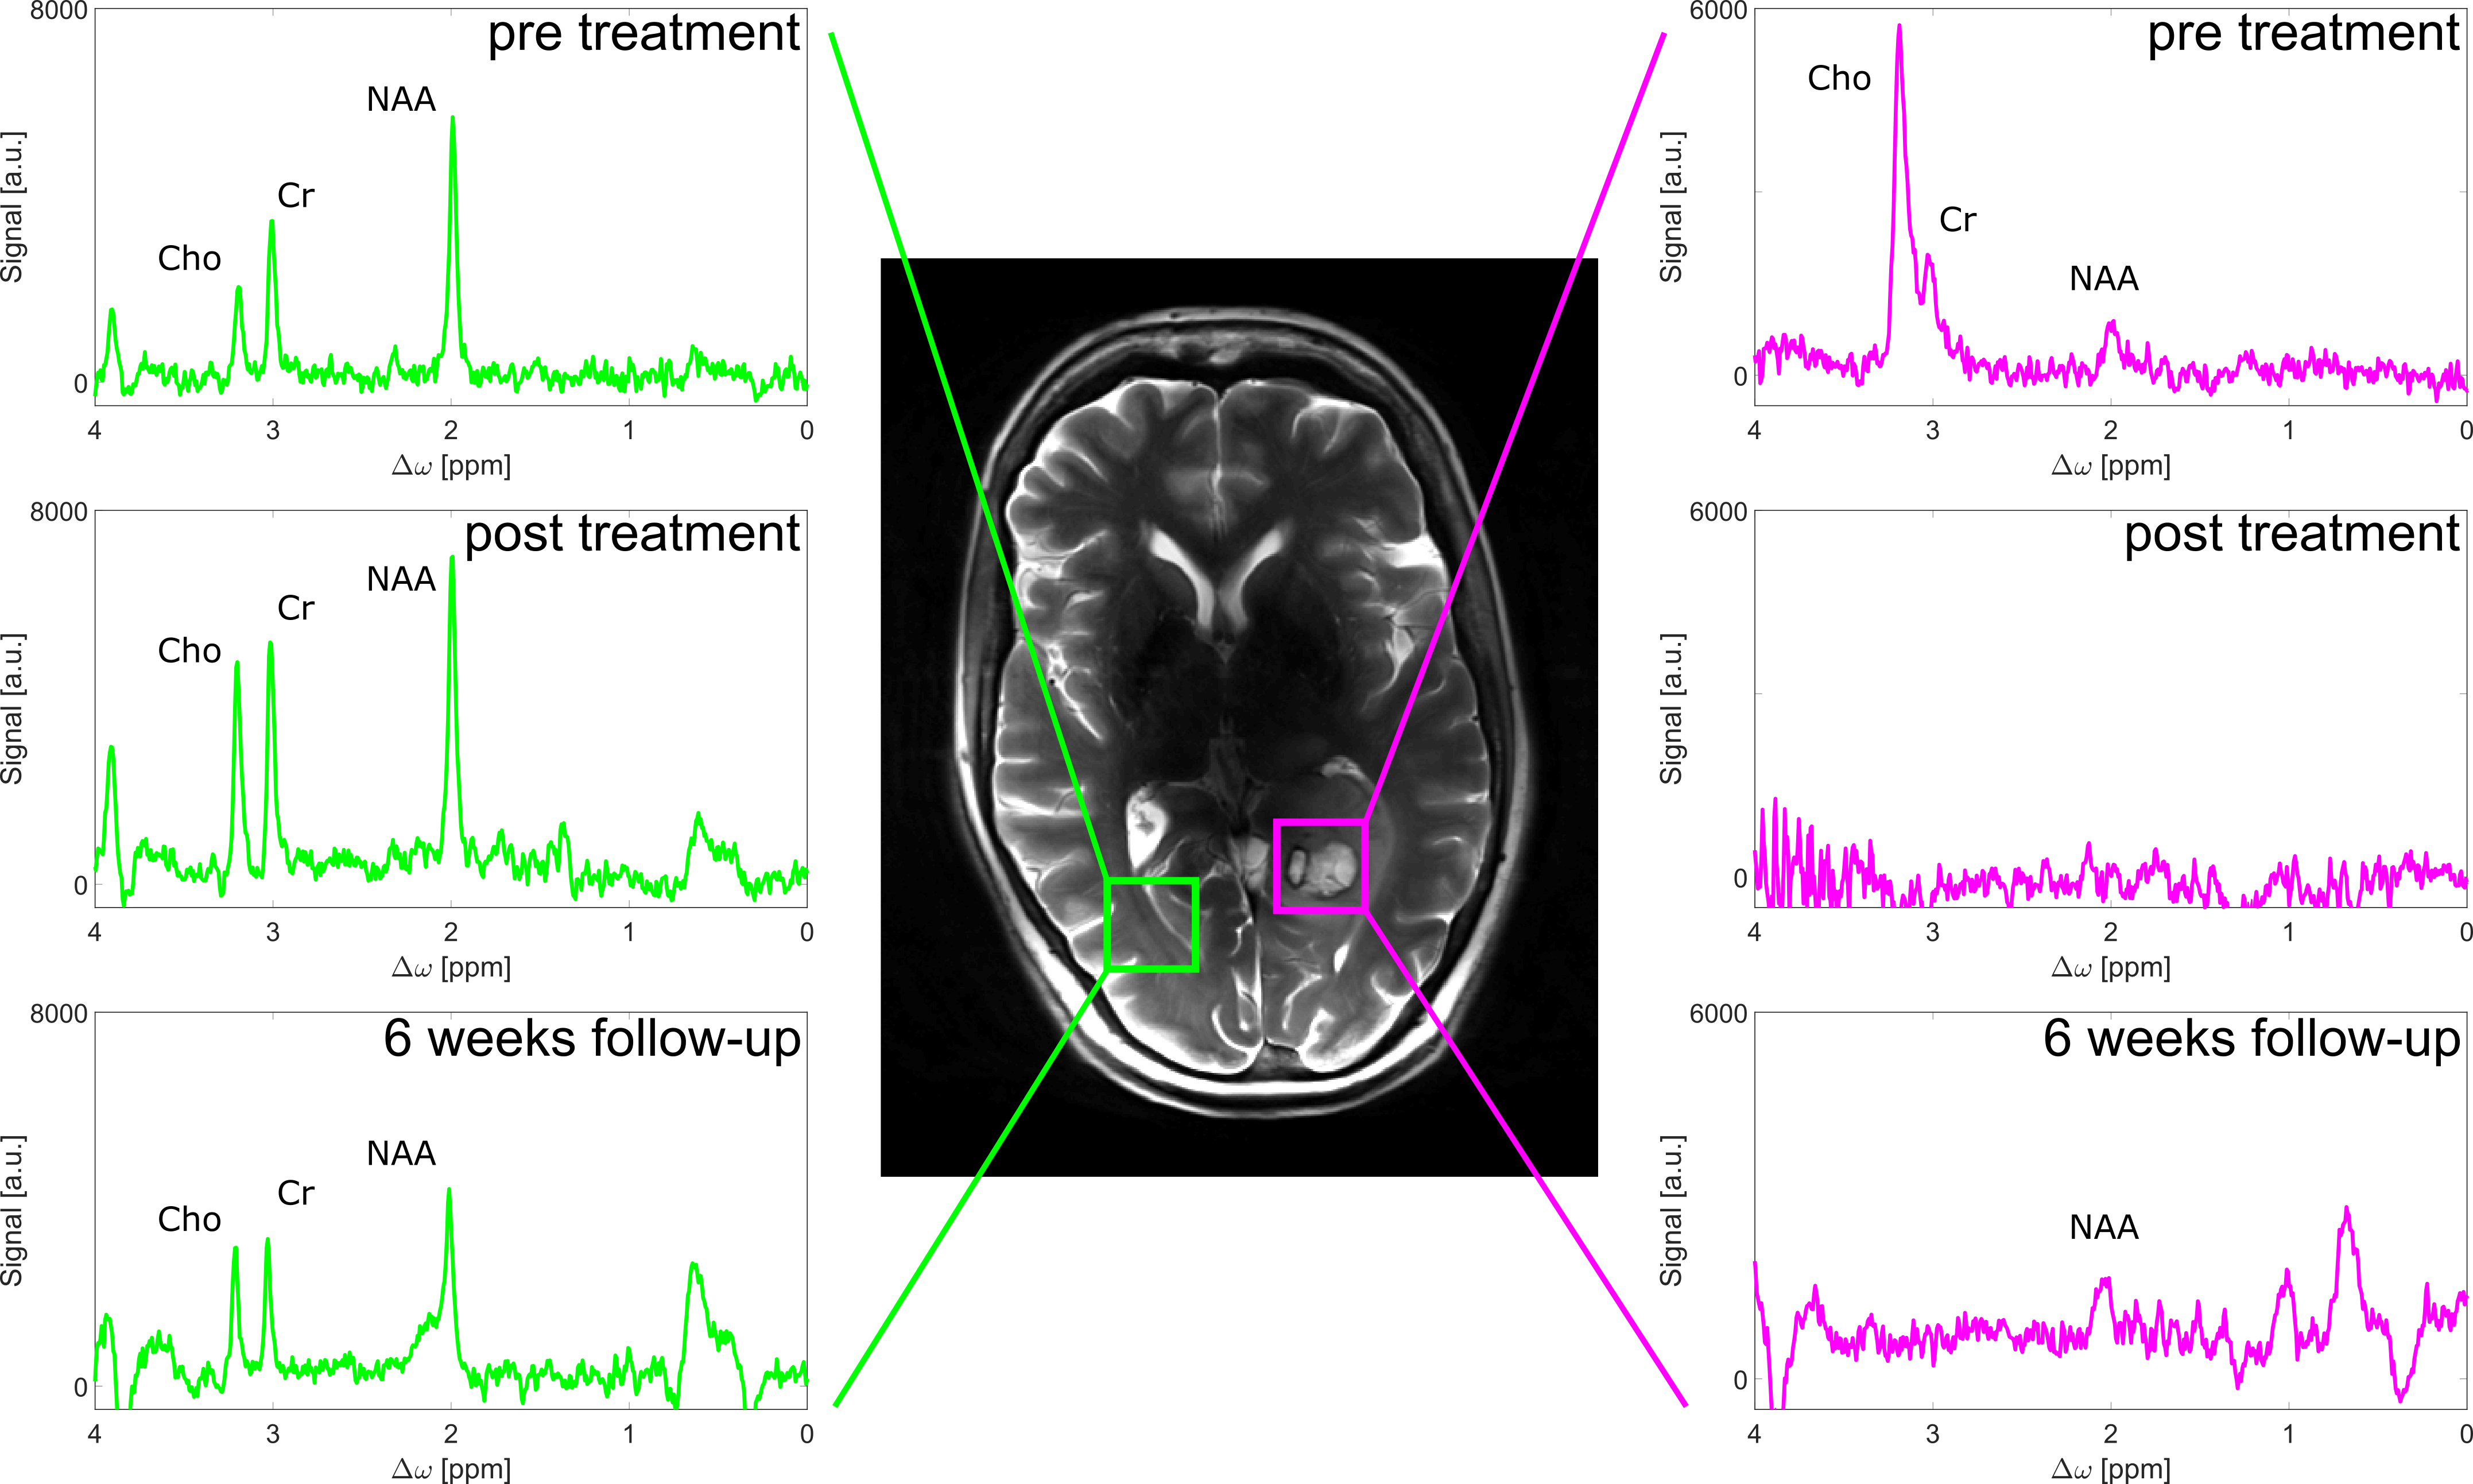
SVS (Figure 3) exhibits the expected signal intensities of N-Acetyl aspartate (NAA), Choline (Cho) and Creatine (Cr) in healthy tissue (green voxel). The Choline amplitude in the tumor (magenta voxel) is increased before treatment. After treatment the CLWM shows only slight changes, however the tumor region does not contain any significant resonances anymore.
Discussion
AREXNOE values pre treatment are in accordance to reported values10. The hypointense AREXNOE region enlarges after therapy, which indicates a waterlike composition. This finding is verified by SVS, where the absence of characteristic peak indicates that only a negligible amount of mobile metabolites is apparent. The reduction of the protein concentration dominated contrast dnsAREX2 after treatment also confirms this hypothesis. Contrary to these findings tumor volume visible in the T2-weighted images increases after treatment. Consequently CEST might be able to distinguish pseudo from true progression. For a definitive statement about the response the 6 month follow-up has to be examined.
Additionally dnsAREX pre treatment might be helpful for an identification of starting infiltration and malignization of the tumor using CEST10. Thus the longitudinal study design might allow to investigate the possible prediction of tumor growth on CEST images.
Conclusion
This is the first study to longitudinal investigate inoperable brain tumors in the course of radiotherapy with CEST at 7T. The mapping of AREXNOE and dnsAREX provided distinct insights into glioblastoma substructure before and after treatment and might help to guide and improve the treatment planning and monitoring.
We will continue to explore the potential of CEST imaging to monitor effects due to therapy response or tumor progression.
Acknowledgements
No acknowledgement found.References
1. Stupp, R. et al. Radiotherapy plus concomitant and adjuvant temozolomide for glioblastoma. N Engl J Med 2005, 352:987–996
2. Zaiss, M. et al. Downfield-NOE-suppressed amide-CEST-MRI at 7 Tesla provides a unique contrast in human glioblastoma. Magn. Reson. Med. 2016; doi: 10.1002/mrm.26100
3. Jones, CK. et al. Amide proton transfer imaging of human brain tumors at 3T. Magn. Reson. Med. 2006; 56:585–592.
4. Zaiss, M. et al. MR imaging of protein folding in vitro employing Nuclear-Overhauser-mediated saturation transfer. NMR Biomed. 2013; 26(12):1815-1822
5. Zhou, J. et al. Using the amide proton signals of intracellular proteins and peptides to detect pH effects in MRI. Nat Med. 2003;9:1085–1090.
6. Schuenke, P. et al. Simultaneous mapping of water shift and B 1 (WASABI)-Application to field-Inhomogeneity correction of CEST MRI data. Magn. Reson. Med. 2016;doi: 10.1002/mrm.26133
7. Scheenen, TW. et al. Towards 1H-MRSI of the human brain at 7T with slice-selective adiabatic refocusing pulses. Magn Reson Mater Phy. 2008; 21:95-101
8. Nolden, M. et al. The Medical Imaging Interaction Toolkit: challenges and advances. International Journal of Computer Assisted Radiology and Surgery. 2013 doi:
10.1007/s11548-013-0840-8
9. Windschuh,
J. et al. Correction of B1-inhomogeneities for relaxation-compensated CEST imaging at 7 T. NMR Biomed. 2015; 28:529–37.
10. Zaiss, M. et al. Relaxation-compensated CEST-MRI of the human brain at 7T: Unbiased insight into NOE and amide signal changes in human glioblastoma. Neuroimage 2015; 112:180-188
Figures