3749
3D Quantitative CEST MRI of the human brain at 9.4T1Magnetic Resonance Center, Max-Planck-Institute for biological cybernetics, Tuebingen, Germany
Synopsis
Selective quantitative CEST MRI was shown to be feasible at 7T and for single-slice readout. In this study we extend qCEST MRI to a field strength of 9.4 T making use of the increase spectral resolution, and by employing a single-shot 3D CEST approach, more coverage of the human brain was realized.
Purpose
Chemical exchange saturation transfer (CEST) signals contain relevant information on the molecular and microenvironmental level [1,2], however, CEST signals also depend on B0 and B1 inhomogeneity, on T1 and T2 relaxation as well as MT. Also various effects at certain chemical shifts must be separated to yield a quantitative insight. As shown previously [2], multi-Lorentzian-fit analysis of Z-spectra that yield the reference and label Z-values Zref and Zlab, allows to calculate the relaxation compensated AREX metric for each CEST effect:
AREX = R1∙ (1/Zlab -1/Zref) (1)
yields the apparent exchange dependent relaxation rate Rex
Rex = f∙ ksw∙ (γB1)2 / [(γB1)2 + ksw(ksw+R2s)]. (2)
Together with algorithms that correct for B0 and B1 inhomogeneity [3], AREX(B1) gives a quantitative value that depends on the solute pool concentration fs and the exchange rate to water ksw. The purpose of this work is to explore 3D in vivo qCEST by AREX at 9.4T which may be an interesting imaging tool for future clinical studies.
Materials and Methods
3D CEST imaging consists of a spectral
but not spatial selective saturation period of 5s (a train of 150
Gaussian-shaped RF pulses, tpulse =
15 ms, tdelay = 15 ms, tsat = 4.5 s, B1,mean
= 0.5, 0.8 and 1.2 µT) and a subsequent readout phase of 2.5 s realized by
a single-shot centric-spiral reordered 3D GRE readout (680 k-space lines,
FA=5°, TE=1.85ms , TR=3.64, Grappa=3, elliptical scanning, BW=700Hz/px. resolution
1.5x1.5x4mm3, FOV=22x18x8 cm3. With snapCEST, 97 offsets
were acquired between -50 and 50 ppm with denser sampling between -5 and 5 ppm (TA
= 12 min). T1 maps were calculated from adiabatic inversion recovery images (same
readout). B0 and B1 maps were acquired using WASABI [4] based on the same readout. In vivo CEST imaging was performed on a 9.4 T
whole body MRI tomograph (Siemens) on a healthy volunteer with informed consent
and approval by the local ethics committee. A custom-built head coil [5] was
used for signal transmission/reception (16 transmit / 31 receive channels).
Motion correction was performed using the 3Dvolreg function of AFNI [6].
Results and Discussion
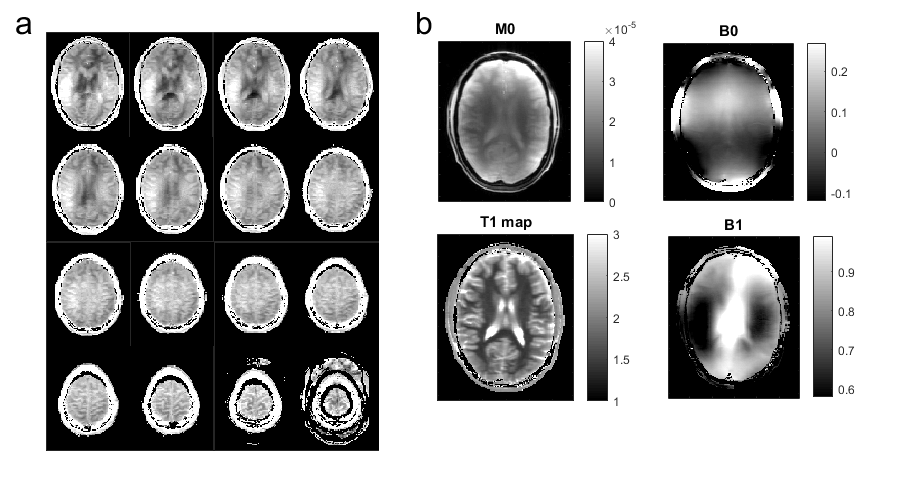
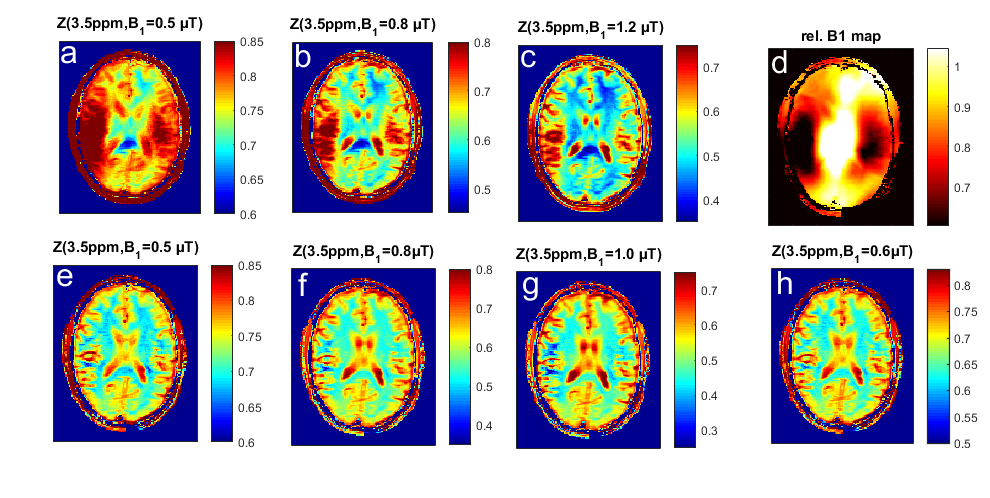
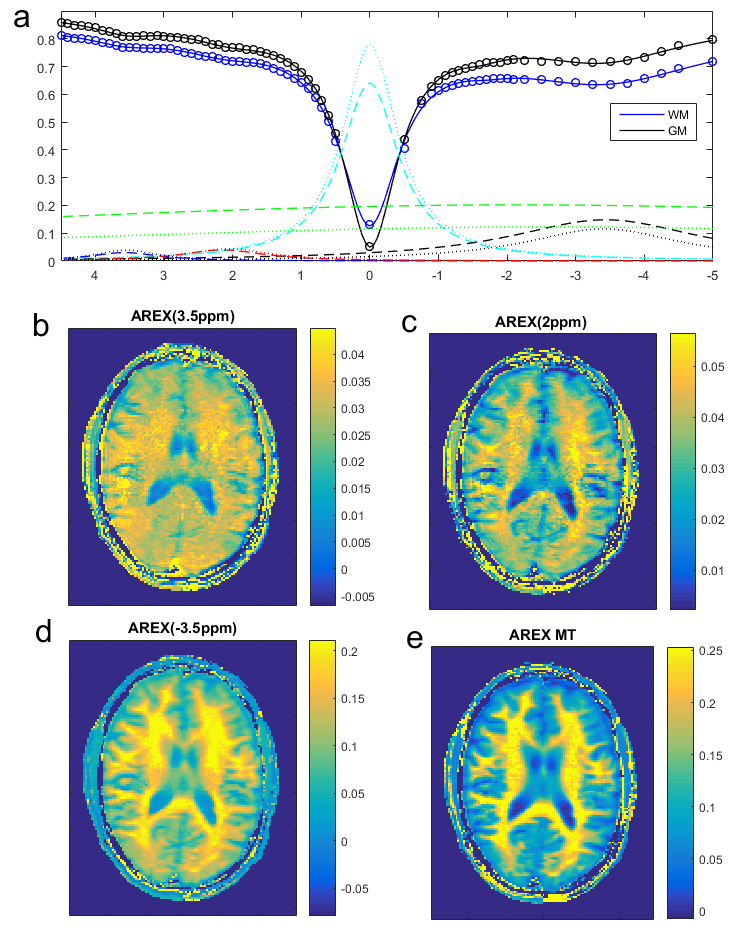
Fig 1 shows that the 3D CEST sequence yields presaturated images of good quality in all but the outermost slices and covers a large part of the brain (Fig1a). In addition to the presaturated images quantification requires acquisition of: (Fig 1b) the thermal equilibrium image M0, T1, as well as B0 and B1 maps. The B0 correction requires sampling of several offsets (see Fig3a), and B1 correction requires collection of several differently saturated images. Fig 2 shows images at one offset (-3.5ppm) of the acquired Z-spectra at different B1. The uncorrected saturated images (Fig2a-c) clearly show correlation with the B1 inhomogeneity map; after correction (Fig2e-h) the images look much more homogeneous. The highest homogeneity was found for B1=0.6µT and this dataset was thus chosen in the following as B1-corrected CEST data. Fig 3a shows B1 and B0 corrected Z-spectra for B1=0.6µT in ROIs of GM and WM. In addition to water (cyan) and MT (green), peaks at 3.5ppm, 2ppm and -3.5ppm were evaluated by Lorentzian fit analysis (dashed (WM) and dotted (GM) lines in Fig 3a). Zref and Zlab maps for each contrast were calculated from the Lorentzian fits and AREX maps were calculated with the help of the T1 map from Eq.(1). Where AREX(3.5ppm) appears to be relatively homogeneous, AREX (-3.5ppm) shows clear correlation with MT, and AREX(2ppm) shows something in between. This matches our expectation (see [2]) as at 3.5 ppm mostly amide proton transfer contributes to the signal, which is similar in gray and white matter, whereas at -3.5ppm an NOE appears which correlates with structure and also lipids, both elevated in WM. CEST at 2ppm has contributions from exchanging protons of creatine and other amines, but at this low power the aromatic NOE is dominant with a similar correlation as NOE at 3.5ppm.Conclusion
We could show that we can acquire spectrally high resolved (97 offsets in 12 minutes) 3D CEST data in the human brain at 9.4T. We showed that we can handle both B0 and B1 inhomogeneity which enables quantitative CEST MRI at 9.4T with decent SNR. AREX outcomes show similar outcomes as comparable studies at 7T, with increased contrast for the peak at 2ppm. Thus, qCEST at 9.4T can now be applied to clinical studies of various diseases.Acknowledgements
No acknowledgement found.References
1. Zhou et al. Using the amide proton signals of intracellular proteins and peptides to detect pH effects in MRI, Nature Medicine 9, 1085 - 1090 (2003)
2. Zaiss M, Windschuh J, Paech D, et al. Relaxation-compensated CEST-MRI of the human brain at 7 T: Unbiased insight into NOE and amide signal changes in human glioblastoma. NeuroImage. 2015;112:180-188.
3. Windschuh J, Zaiss M, Meissner J-E, Paech D, Radbruch A, Ladd ME, u. a. Correction of B1-inhomogeneities for relaxation-compensated CEST imaging at 7 T. NMR Biomed. Mai 2015;28(5):529–37.
4. Schuenke P, Windschuh J, Roeloffs V, Ladd ME, Bachert P, Zaiss M. Simultaneous mapping of water shift and B1 (WASABI)-Application to field-Inhomogeneity correction of CEST MRI data. Magn Reson Med. 9. Februar 2016;
5. Shajan G, Kozlov M, Hoffmann J, Turner R, Scheffler K, Pohmann R. A 16-channel dual-row transmit array in combination with a 31-element receive array for human brain imaging at 9.4 T. Magn Reson Med. 1. Februar 2014;71(2):870–9.
6. Cox RW, Hyde JS. Software tools for analysis and visualization of fMRI data. NMR Biomed. 1997;10(4–5):171–8. (https://afni.nimh.nih.gov)
Figures