3748
Are MT and NOE (at -3.5 ppm) in z-spectroscopy coupled in the brain?1Sir Peter Mansfield Imaging Center, University of Nottingham, Nottingham, United Kingdom
Synopsis
The origin of the Nuclear Overhauser Enhancement (NOE) signal observed in the CEST spectrum of the brain is still under debate. The effect is detected upfield from water, in the frequency range of non-exchangeable aliphatic/olefinic protons, indicating that the transfer of magnetization is not occurring via proton or chemical exchange; furthermore the lineshape is relatively narrow, suggesting the signal is coming from mobile protons with T2 of the order of 300μs. This study investigates the correlation between NOE and MT in the human brain at 7T, and shows the two effects are strongly coupled, across a wide age range.
Purpose
The origin of the Nuclear Overhauser Enhancement (NOE) signal observed in the CEST spectrum of the brain is still under debate. The effect is detected upfield from water, in the frequency range of non-exchangeable aliphatic/olefinic protons[1], indicating that the transfer of magnetization is not occurring via proton or chemical exchange; furthermore the lineshape is relatively narrow, suggesting the signal is coming from mobile protons with T2 of the order of 300μs. These observations indicate that the transfer of magnetization in NOE occurs primarily via dipolar interactions, possibly relayed by a secondary chemical exchange mechanism[1]. Nonetheless the origin and clinical relevance of this parameter in the brain remains unknown.
Aims
To investigate the relationship between MT and the NOE signal at -3.5 ppm in the human brain.Methods
Acquisition: With appropriate ethics approval, 53 healthy patients were scanned using a 7T Philips Achieva system. Z-spectra were acquired at 3 different B1 saturation powers (B1rms=0.38μT, 0.75μT, and 1.25μT) together with B0 and B1 maps, and PSIR used to produce a T1 map. All scan parameter details can be found in[2]. 4 multiple sclerosis patients were also scanned 6 times each. Z-spectra were acquired in a similar manner except at only 2 powers (0.38μT, 0.75μT).
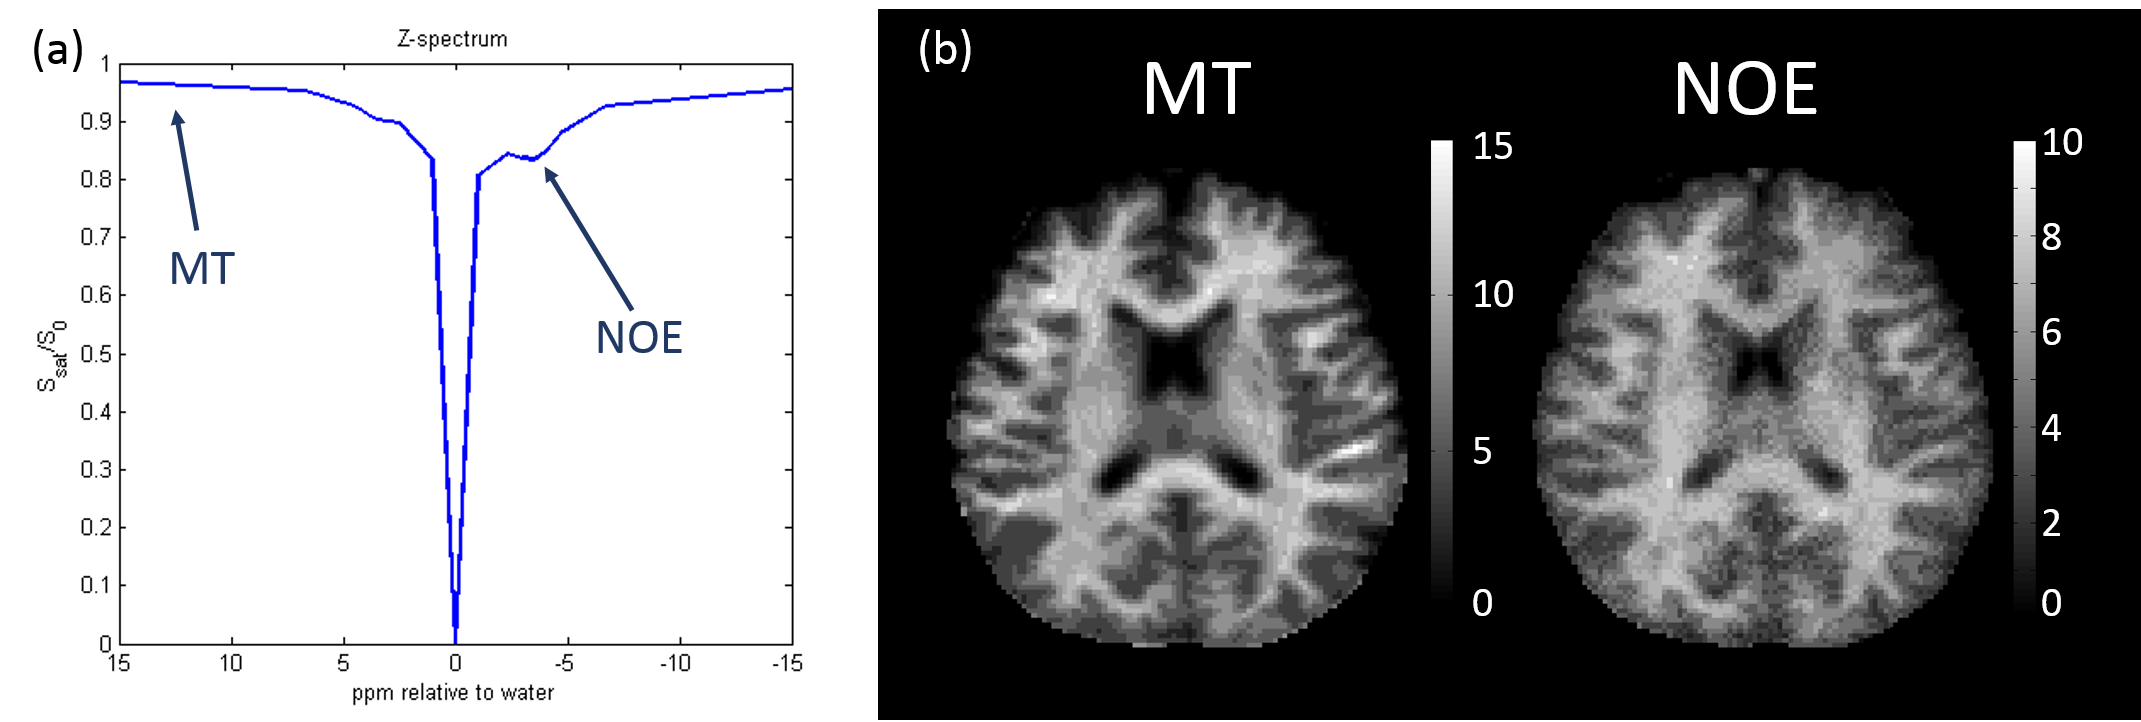
Fitting: For each subject, B0 corrected z-spectra were fitted voxel-wise for the amplitude of 3 pools (MT, NOE at -3.5 ppm and APT) to a look-up-table of Bloch-simulated spectra[2], correcting for B1 and T1 to produce quantitative MT and NOE maps (Figure 1).
Segmentation: All PSIR images were segmented using FreeSurfer[3] and brain tissue classified using the Desikan-Killiany[4] atlas (35 White Matter(WM) regions, 35 Grey Matter(GM) regions). For the MS patients, lesion masks were created to separate normal appearing GM(NAGM) from normal appearing WM(NAWM) and lesions.
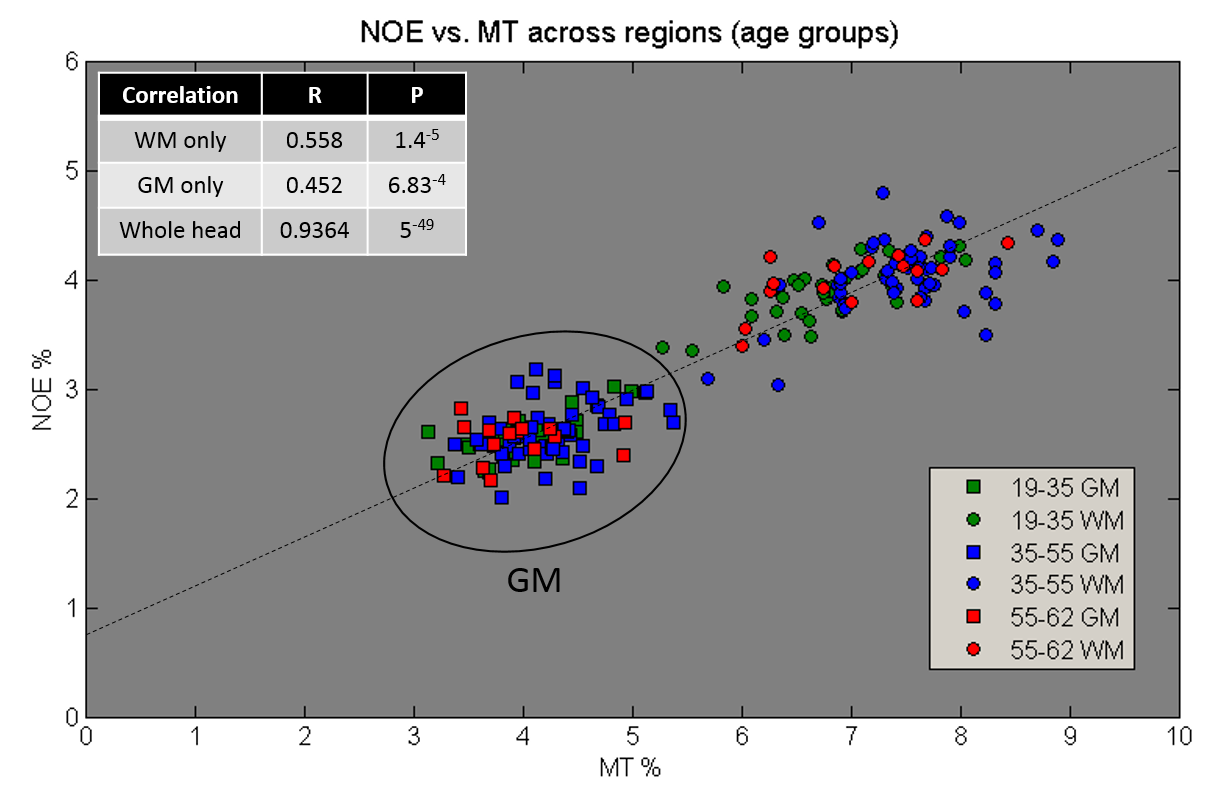
Correlation: NOE signal was correlated against MT for the individual regions (averaged over subjects), and for individual subjects (averaging the regions into whole head WM and GM). The subjects were also split into three age groups to investigate any age effect. Similar region averaged plots were also made for the MS data.
Results
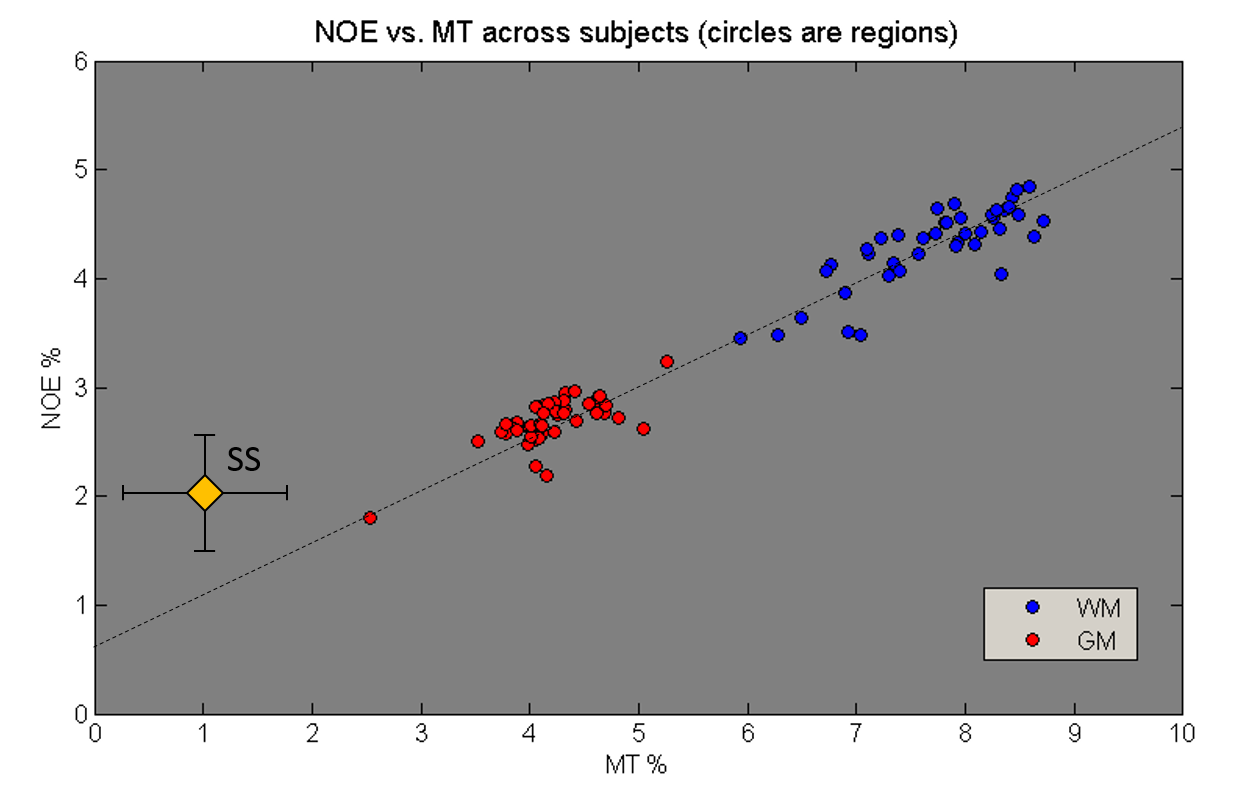
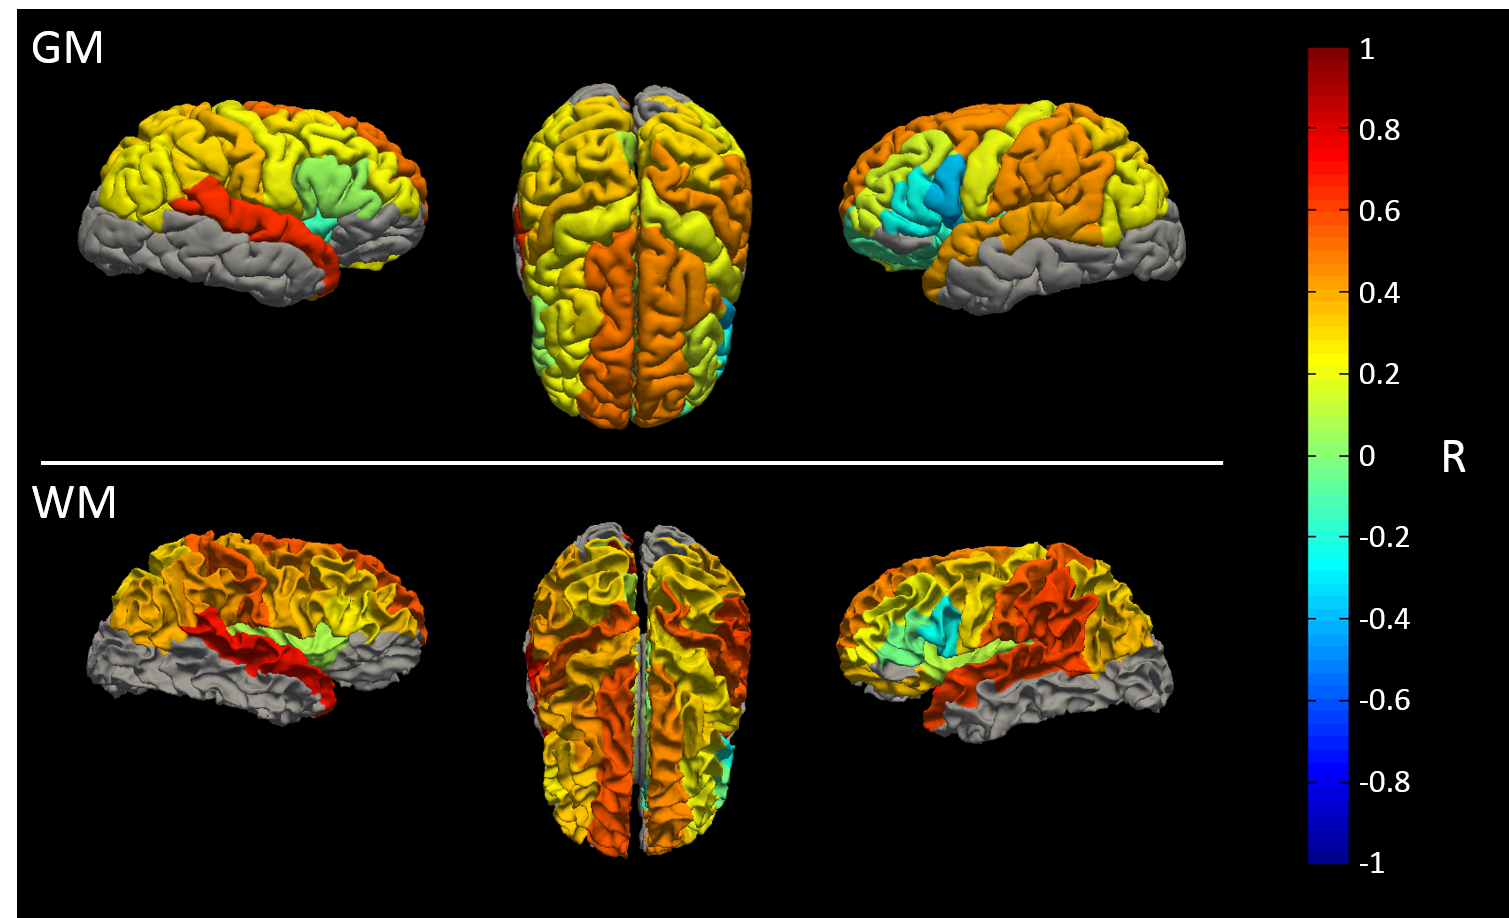
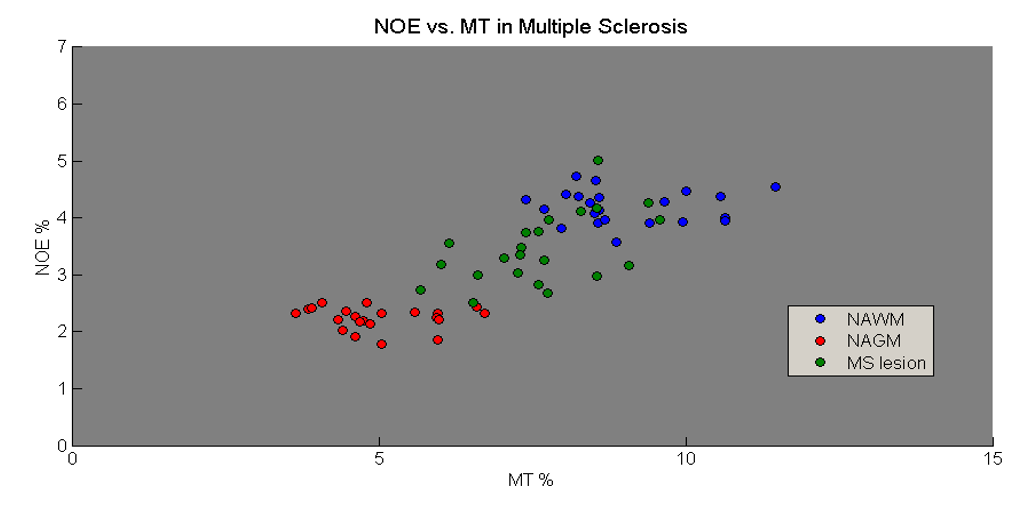
Figure 2 correlates NOE and MT averaged over all WM and GM separately for all 53 subjects. A strong correlation between NOE and MT values across subjects can be seen (R=0.9364, P=5-49). Three different age groups were separated, showing no change in correlation with age. Figure 3 shows a strong correlation between NOE and MT for the subject averaged values within 38 segmented regions. Figure 4 shows the correlation between MT and NOE in each of the 38 regions, plotted on surface maps. Figure 5 shows the relationship between NOE and MT in the MS study.Discussion
We have shown that for the normal brain the z-spectrum NOE signal is tightly coupled to the MT signal across GM and WM regions, and across subjects irrespective of age. Although the MS and healthy control data cannot be directly compared due to the difference in acquisition parameters, a similar tight coupling is found in MS, even within lesions.
MT has previously been linked to myelination: this result suggests that NOE is also closely related to myelination, which is not surprising since it results from saturation over the fat peak in the myelin proton spectrum[5]. However although NOE is a smaller signal, the sensitivity in the fitted amplitude compares favourably to that for MT (intrasubject standard deviation over repeated visits 0.61% vs 1.55%[2]) since it is less sensitive to B1. Furthermore it can be quantified at lower saturation powers reducing SAR. This suggested that NOE might provide an alternative marker of myelin at 7T.
Despite the fact that MT and NOE are tightly coupled, the NOE signal shows an offset (non-zero intercept). This could be due to a contribution from other tissue compartments including blood which found had a relatively higher NOE signal compared to MT (see Figure 3). This suggests that blood volume changes may alter the relationship between MT and NOE in some pathology.
Previous work has shown that the NOE signal in BSA is pH dependent and therefore probably exchange relayed[1], although other work did not show pH dependency with NOE[6]. The tight coupling observed in-vivo might thus provide a non-invasive and sensitive method of monitor pH which should be investigated in ischaemic regions.
Conclusion
This study shows that the z-spectrum NOE signal is tightly coupled to MT in the healthy brain across all age ranges with similar results in MS lesions. The relationship will be affected by blood contributions, and the NOE/MT ratio may also provide a method of monitoring pH in-vivo.Acknowledgements
This work was funded by Medical Research Council (MRC) UK Partnership Grant, MR/K005464/1, MRC New Investigator Research Grant (MR/M006301/1), MRC Doctoral Training Grant, MR/K501086/1, and the Initial Training Network, HiMR, funded by the FP7 Marie Curie Actions of the European Commission (FP7-PEOPLE-2012-ITN-316716).
References
1 - C K. Jones et al., Nuclear Overhauser enhancement (NOE) imaging in the human brain at 7T, Neuroimage. 2013 Aug 15;77:114-24.
2 - N Geades et al., Quantitative Analysis of the Z-Spectrum Using a Numerically Simulated Look-up Table: Application to the Healthy Human Brain at 7T, MRM. 2016 Oct 17. doi: 10.1002/mrm.26459
3 - Freesurfer (http://surfer.nmr.mgh.harvard.edu/)
4 - Desikan, R.S. et al., An automated labeling system for subdividing the human cerebral cortex on MRI scans into gyral based regions of interest, Neuroimage, 2006, 31, 968-980.
5 - Wilhelm MJ et al., Direct magnetic resonance detection of myelin and prospects for quantitative imaging of myelin density, Proc Natl Acad Sci U S A. 2012.
6 - Jin et al. MR imaging of the amide-proton transfer effect and the pH-insensitive nuclear overhauser effect at 9.4 T, MRM 2012: 69(3): 760–770
Figures