3747
Monitoring neoadjuvant chemotherapy in breast cancer patients using CEST and 31P-MRS at 7 tesla1Radiology, UMC Utrecht, Utrecht, Netherlands, 2Max Planck Institute for Biological Cybernetics, Tubingen, Germany, 3Oncology, Amsterdam Medical Center, Amsterdam, Netherlands
Synopsis
Treatment monitoring is of importance for breast cancer patients receiving systemic therapy. Metabolic imaging methods such as CEST and 31P-MRS may have potential to predict treatment efficacy in an early stage of the treatment. In this study we assessed the amide proton transfer (APT) signal and the pH change in breast cancer patients before and after the first cycle of neoadjuvant chemotherapy to explore the relation between APT and pH. We observed changes in both the APT signal and the pH between the two measurements. These changes may serve as biomarkers for predicting treatment response to NAC in an early stage.
Introduction
Breast cancer patients receiving neoadjuvant chemotherapy (NAC) suffer from severe side effects, such as nausea, vomiting and hair loss. If systemic therapy such as NAC does not lead to the desired result, the patient will suffer unnecessarily from all these side effects. Therefore, treatment monitoring is important for these patients. Novel methods have been introduced to predict the efficacy of NAC such as chemical exchange saturation transfer (CEST) imaging and 31P-MR spectroscopy1,2. Therefore, the purpose of this study is to determine the effect of NAC on APT signal and pH before and after the first cycle.Subjects and Methods
Setup
7 tesla MR system (Philips, Cleveland, USA), a 28-channel bilateral breast coil (MR Coils BV, Zaltbommel, Netherlands) and a 2-channel unilateral 1H/31P dual-tuned coil.
CEST
After giving informed consent, six breast cancer patients were scanned before and after the first cycle of NAC (around 3 weeks interval). For the CEST, three out of the six patients were scanned using the bilateral breast coil and three patients were scanned with the unilateral coil.
CEST-MRI was performed using a 4s saturation train (50% duty cycle) and a gradient-echo readout. Image acquisition included fat suppression with a short 1-2-1 spectral-spatial RF pulse to allow for a short TE of 1.4ms, a TR of 2.6ms and a flip angle of 3.6°. A FOV of 320x150x100mm3 with a true resolution of 2.3x3.0x6.8mm3 was obtained in 2 shots of 394ms with a 4 fold SENSE acceleration. Acquisition of 32 frequency offsets resulted in a scan time of 5min30s. The frequency offsets associated with nuclear Overhauser effect (NOE) were not included due to lipid distortions.
Analysis
B0 was corrected using the WASSR method3 and a region of interest (ROI) was drawn based on contrast enhanced DCE-MRI series in the tumor tissue before and after the first cycle of NAC. The z-spectra were fitted using a three-pool Lorentzian model (water, amide proton transfer (APT) and magnetization transfer (MT))4 to obtain the APT signal. An unpaired t-test, with a two-tailed distribution was used to show statistical difference between the APT signal before NAC and APT signal after the first cycle of NAC (significant if p<0.05).
31P-MRS
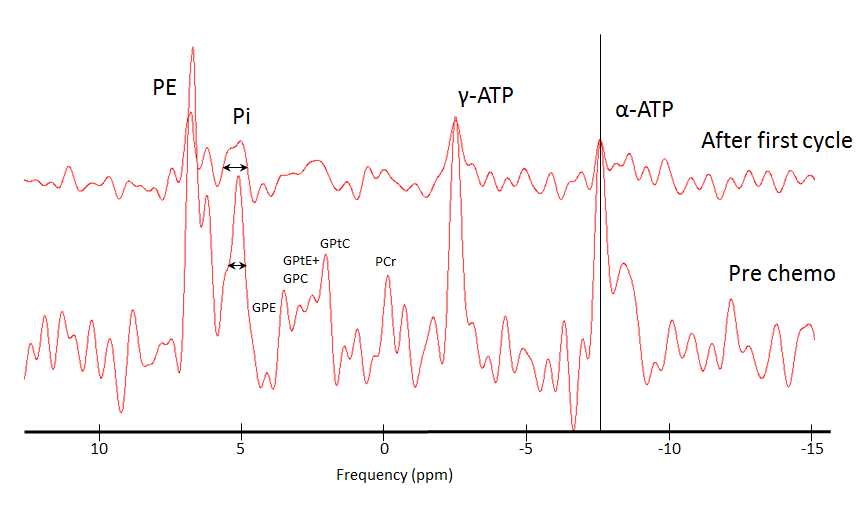
For 31P-MRS, the same six patients were scanned with the unilateral breast coil using the AMESING sequence5. The pH change was determined by the shift of inorganic phosphate (Pi) with respect to α-ATP using the modified Henderson-Hasselbach relationship:
$$pH=pK_A+\frac{\delta-\delta_{HA}} {\delta_A-\delta}$$
The 31P-spectra were hamming filtered and zero filled before analysis with jMRUI. The spectra were aligned on α-ATP as α-ATP is the most pH independent component present in the breast. For group analysis, the spectra of all patients were summed.
Results
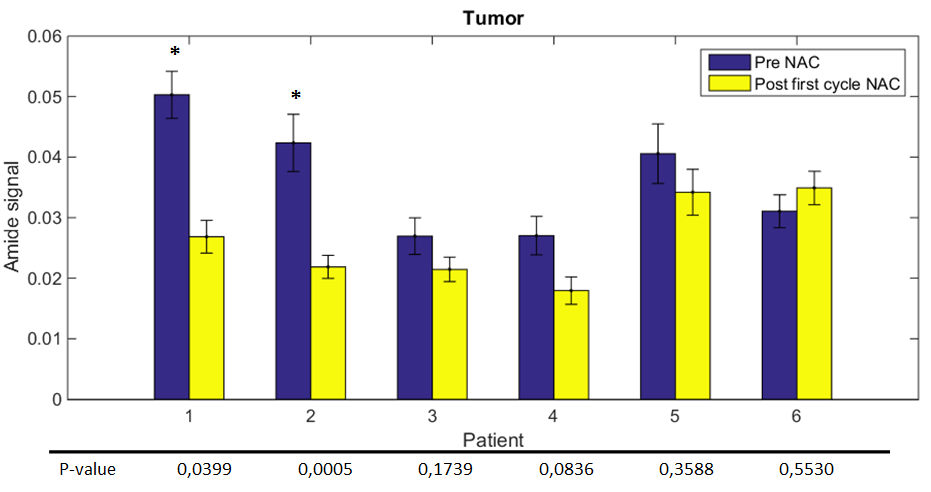
When evaluating one individual patient (Figure 1), a small change in APT signal is observed and a slight shift of Pi of 0.16ppm, equally to 0.15 pH. However, in the group summed 31P-spectra (Figure 2) broadening of the Pi peak is observed. Changes in APT signal before and after the first cycle of NAC were statistically significant different in some patients, respectively p=0.0399 and p=0.0005 (Figure 3).Discussion
The origin of CEST and in particular APT contrast in tumors is not fully understood and has been tentatively ascribed to an increase in the content of endogenous cellular proteins and peptides3,6-10. Despite the fact that the pH influences the exchange rate, these studies showed that the effect of pH on the APT signal specifically is negligible. The observed change in pH (0.15 unit) of one patient will therefore not significantly change the APT signal, suggesting that the changes in APT signal observed can be ascribed to changes in amide proton contents. Also, as can be seen in Figure 2, the summed spectra show a clear broadening of the Pi peak after the first cycle of NAC, suggesting that the shift and therefore the pH change is different in every patient. These results demonstrate that pH is not directly influencing the APT signal and that possibly both the APT signal as well as the pH can be used as biomarkers for treatment response, and may even complement each other. A possible next step would be to correlate these biomarkers to the pathological response to NAC.Conclusion
In this study the effect of NAC on APT signal and pH before and after the first cycle of NAC was determined. Changes in both pH based on the Pi shift in the 31P-spectra and APT signal for every patient were observed, suggesting both CEST and 31P-MRS may be suitable for predicting treatment response to NAC in an early stage.Acknowledgements
No acknowledgement found.References
[1] Dula AN et al. MRM, 2013;70:216-224[2] Van der Kemp WJM et al. SpringerPlus, 2014;3:634
[3] Wen Z et al. NeuroImage. 2010;51(2):616–622.
[4] Windschuh J et al. NMR in Biomedicine. 2015;February:529-537.
[5] Van der Kemp WJM et al. NMRB. 2013;26;(10):1299-1307
[6] Zhou J et al. MRM, 2008;60(4):842-849
[7] Zhou J et al. Nature Med. 2010;17(1):130-134
[8] Zhou J et al. MRM, 2003;50(6):1120-1126
[9] Jones CK et al. MRM, 2006;56(3):585-592
[10] Sun PZ et al. MRM, 2008;60:834-841
Figures