3746
Z-spectrum acquisition and interpretation in the presence of fat: influence of imaging parameters1Department of Radiology, UT Southwestern Medical Center, Dallas, TX, United States, 2Philips Research, Hamburg, Germany, 3Philips Medical Systems, Gainesville, FL, United States, 4Advanced Imaging Research Center, UT Southwestern Medical Center, Dallas, TX, United States
Synopsis
CEST-MRI is increasingly evolving from brain to body applications. One of the known problems in body imaging is the presence of strong lipid signals. Their influence on the CEST signal is acknowledged but underexplored. The goal is to investigate the effects of lipids on the Z-spectrum taking TE into account. We performed simulations and verified the results in phantoms and in vivo. We demonstrate the mutual influence of fat fraction and TE on the Z-spectrum for gradient echo based sequences. This study provides a systematic understanding of lipid artifacts in CEST imaging and lays the foundations for their efficient removal.
Purpose
An increasing number of Chemical Exchange Saturation Transfer (CEST) applications are explored outside the brain in prostate, breast, kidney, cartilage, etc. One of the known problems in body imaging is the presence of strong lipid signals. Methods to remove lipid artifacts in CEST imaging were reported,1-3 however, there was no systematic study addressing the influence of the non-exchanging lipids on CEST imaging. In particular, the interplay between image acquisition parameters, fat fraction (FF), and Z-spectrum needs to be investigated. The goal of this abstract is to systematically discuss how the presence of fat influences the Z-spectrum, while taking the effects of echo time (TE) into account. The interplay is studied in simulations, and experimentally verified in phantoms and in vivo.Methods
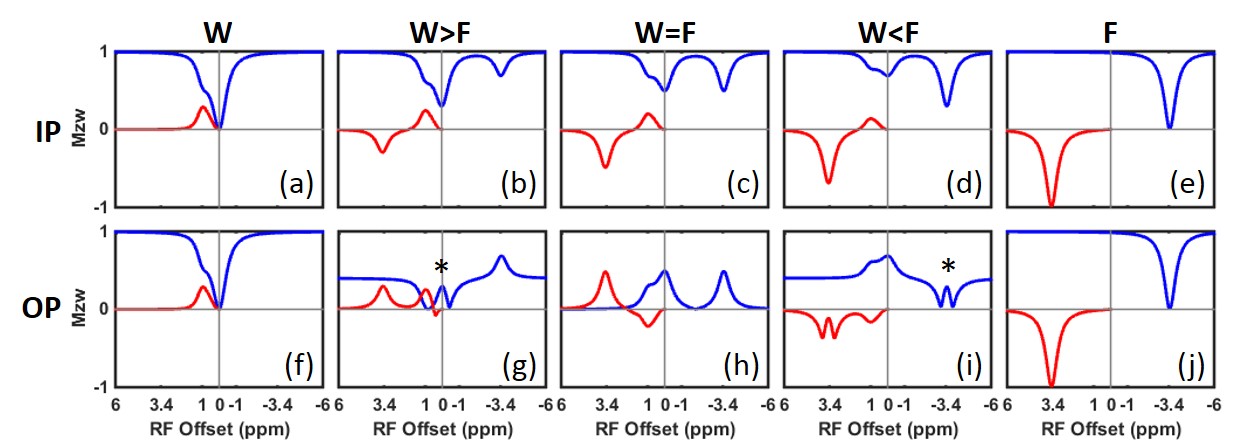
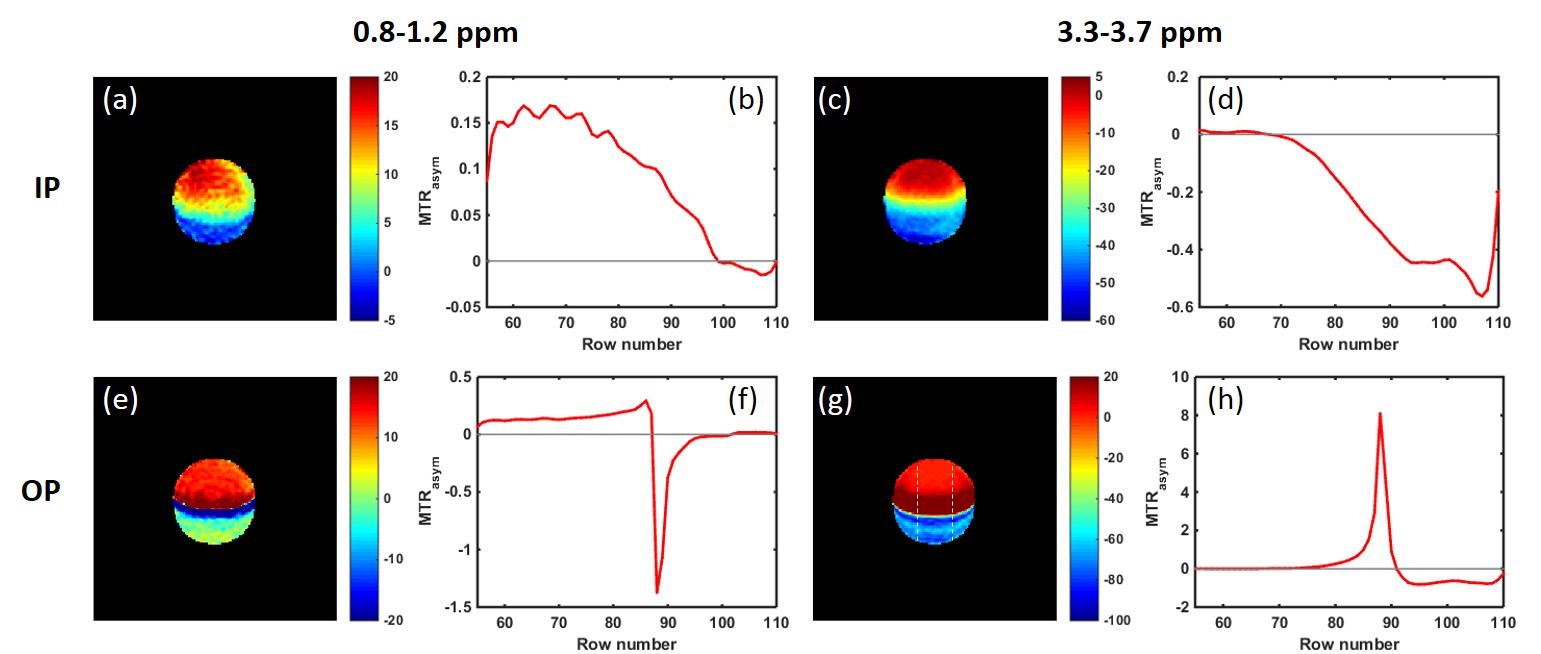
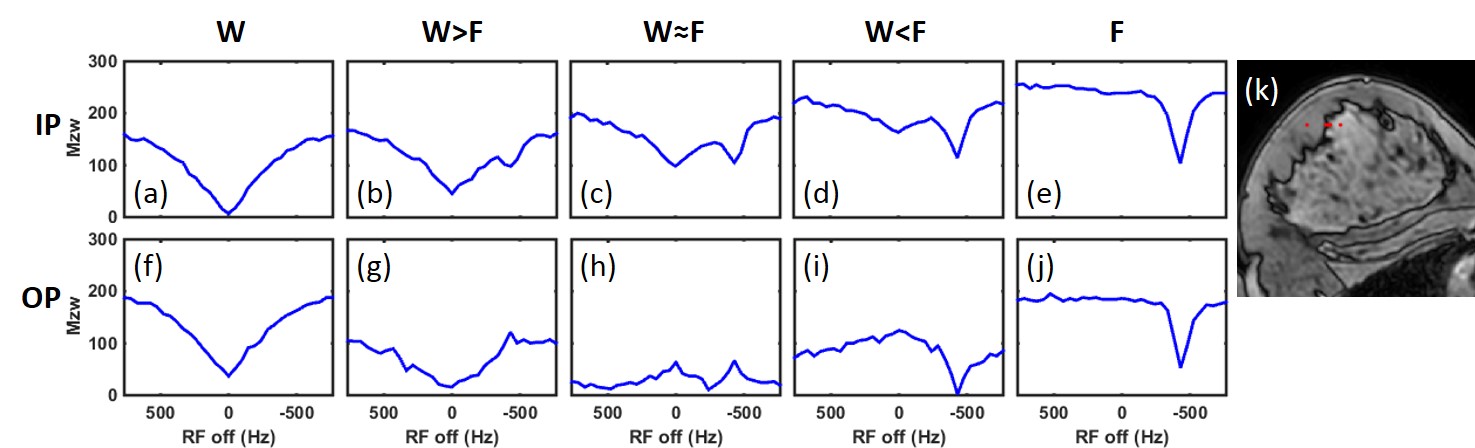
Bloch simulations were based on a 3-pool model: a water pool (T1/T2=1.5/0.8s), a lipid pool (non-exchanging, T1/T2=0.8/0.5s, ∆CS=-3.4ppm) and a hydroxyl pool (T1/T2=1/1s, M0s=0.005, ∆CS=1ppm, and k=100Hz). The pool sizes for water (M0w) and fat (M0f) varied from 0 to 1, with FF=M0f/(M0w+M0f) increasing from 0 to 100% while satisfying M0w+M0f=1. In all simulations, a 5s CW pulse with B1=0.97μT was used. To study the TE influence, simulations were performed in two conditions: in-phase (IP, 360o phase difference between water and fat) and out-of-phase (OP, 180o phase difference). All the experiments were performed on a 3T human MRI scanner (Ingenia, Philips Healthcare) using 2-channel RF transmission. IP and OP images were acquired at TE=2.3ms and 3.45ms respectively. B0 correction was performed using B0 maps generated by a separate B0 mapping sequence. In the phantom study, a bottle filled with 100mM choline water solution and oil (Vegetable oil, Crisco) was used. The imaging plane was placed oblique at the interface between water and oil to capture a continuous range of FF from 0 to 100% in the plane. The CEST images were acquired using a 15-channel head-spine coil and a 2D T1-weighted TFE sequence with 4.9s pulsed saturation, enabled by alternated transmission over the RF channels, 4 and an average B1=1.17μT. In the in vivo study, breast CEST images were acquired in four healthy female volunteers using a 16-channel bilateral breast coil. The same sequence was used, as in the phantom study but with 2s saturation. In simulations and experiments, the MTRasym was averaged in two ranges: 0.8-1.2 ppm (hydroxyl-MTRasym) and 3.3-3.7 ppm (amide-MTRasym).Results and Discussion
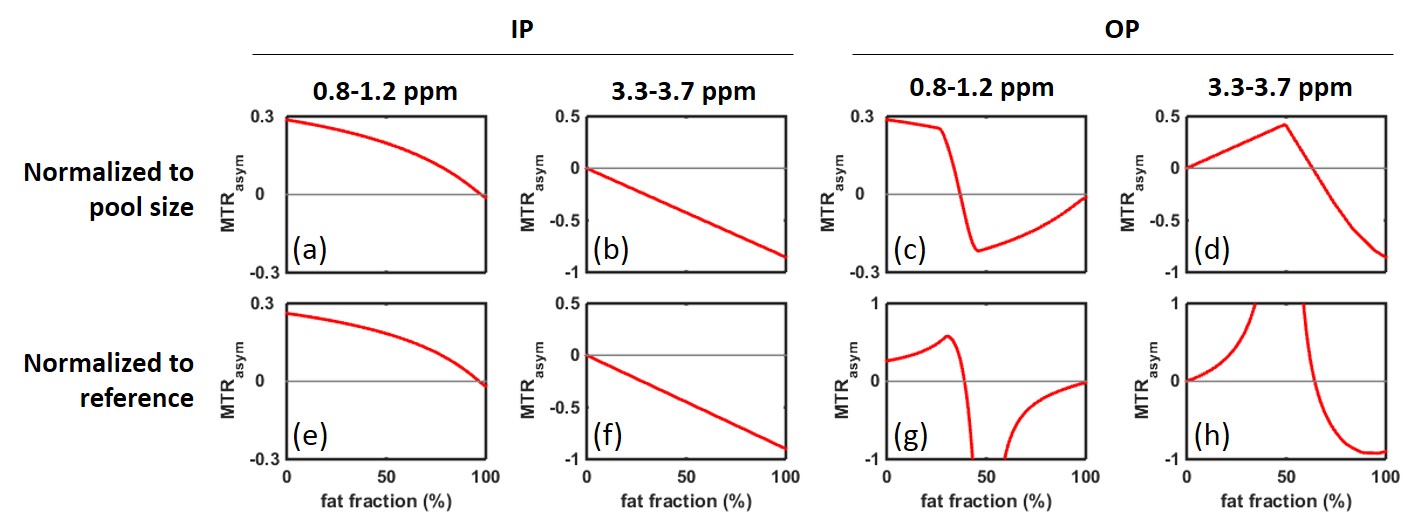
Simulated IP and OP Z-spectra and MTRasym with different FF are shown in Fig.1 (values normalized to the sum of the water and fat pools). In the experiment, the reference signal is used for normalization, because the actual pool sizes are not known. In Fig.2, the influence of fat on the IP- and OP-MTRasym are further studied using two normalization methods: to the pool size and to the reference signal. For IP, the water peak in the Z-spectrum shrinks as FF increases; the fat peak shows an opposite effect (Fig.1a-e). Hence, MTRasym decreases monotonically for both frequency ranges, as FF increases (Fig.2a,b). The OP Z-spectra are more complicated and less intuitive than the IP, since water and fat have a phase difference of nπ (odd n). A quantitative explanation of the behavior is that the non-normalized value (I) at any frequency in the OP Z-spectrum is given by the equation: I=|Z-Intensity(water)-Z-Intensity(fat)|. Moreover, the reference signal is dependent on the fat fraction. Thus, it may be lower than the Z-spectrum values (Fig.2g,i) and even becomes zero when W=F (Fig.2h). As a consequence, the values normalized to the reference become larger than 1 and, in the extreme cases, are either very large or very small (Fig.2c,d). The experimental MTRasym and Z-spectra in phantoms and in vivo (Figs.3,4) demonstrate the same behavior as simulations (Figs.1,2) and are in excellent agreement with the above analysis. While two well-defined acquisition conditions have been discussed (IP/OP), other TE values will lead to a complicated behavior consisting of mixtures of the effects shown here.Conclusion
The influence of fat on the Z-spectrum was studied at different TE. It is shown that the often overlooked FF and TE together influence the Z-spectrum for gradient echo based sequences. In the IP images, the behavior of the Z-spectra and MTRasym is relatively straightforward. However, the OP-Z-spectra and MTRasym are more complicated, leading to erroneous CEST effects. This study helps recognizing lipid artifacts in CEST images, provides suggestions on the selection of imaging parameters and builds a foundation for the most efficient removal of these artifacts.Acknowledgements
No acknowledgement found.References
1. Klomp DW, Dula AN, Arlinghaus LR, et al. Amide proton transfer imaging of the human breast at 7T: development and reproducibility. NMR Biomed. 2013;26(10):1271-1277.
2. Lu J, Zhou J, Cai C, et al. Observation of true and pseudo NOE signals using CEST-MRI and CEST-MRS sequences with and without lipid suppression. Magn Reson Med. 2015;73(4):1615-1622.
3. Sun PZ, Zhou J, Sun W, et al. Suppression of lipid artifacts in amide proton transfer imaging. Magn Reson Med. 2005;54(1):222-225.
4. Keupp J, Baltes C, Harvey P, et al. Parallel RF transmission based MRI technique for highly sensitive detection of amide proton transfer in the human brain. in: Proc Intl Soc Mag Reson Med. 2010.
Figures