3745
3D-CEST Imaging of a Mouse Model of Polycystic Kidney Disease1Advanced Imaging Research Center, University of Texas Southwestern Medical Center, Dallas, TX, United States, 2Department of Internal Medicine and Division of Nephrology, University of Texas Southwestern Medical Center, Dallas, TX, United States
Synopsis
The objective is to develop a new 3D-CEST imaging method (3-dimensional chemical exchange saturation transfer) to investigate a mouse model of polycystic kidney disease (PKD). It is based on 3D magnetization prepared rapid acquisition gradient echo sequence (3D MPRAGE) by applying a pre-saturation pulse consisting of three continuous Gauss shaped pulses.
Purpose
Polycystic kidney disease (PKD) is a leading cause of end-stage renal disease1-2. The clinical hallmark of this disease is the presence of numerous renal tubule-derived cysts. The overarching goal of this research is to develop new imaging methods to monitor the pathogenesis of cyst progresses in mouse models of PKD and to advance the preclinical testing of new drugs. In this work, a 3D chemical exchange saturation transfer (CEST)3-4 sequence was used to detect cysts in a PKD model, which takes advantage of the CEST signal from endogenous metabolites containing exchangeable protons.Materials and Methods
Mouse model: We bred Pkhd1/Cre mice to Pkd2F/F mice. Their progeny were then intercrossed in order to generate Pkhd1/Pkd2F/F (Pkd2-KO) mice5.
MRI Protocols: MRI scans were conducted using a 7T animal system (Agilent). Under anesthesia, the animals were subjected to the imaging with the respiratory monitoring at 28 ± 1°C.
High-resolution fat-sup T2-weighted fast spin-echo images were acquired on the coronal sections covering the entire kidneys. These were used as the anatomical margins for planning CEST scans.
2D CEST images were acquired using a modified gradient echo sequence similar to that reported6 by applying a pre-saturation pulse consisting of three continuous 25ms Gauss shaped pulse at a power level of 9µT on a coronal section delineating the center of the both kidneys. A total of 59 saturation frequency offsets [+7 to -7 ppm (-0.25ppm step) and ±300 ppm] were imaged where 64 echoes were collected after a pre-saturation pulse train. Other imaging parameters were: TR/TE=86.50/2.72ms, FOV=32x32mm, matrix size=128x64, post image zero-filling to 128x128 (affording 250µm in-plane resolution), slice thickness=1mm, NEX=2, and no respiratory gating. The total experimental time was 10 min 55 sec.
3D CEST images were acquired using a modified magnetization prepared rapid acquisition gradient echo sequence (3D MPRAGE) with the identical parameters of the pre-saturation used in 2D CEST on entire kidneys. Two segmentations were used. 32 echoes were collected after a pre-saturation pulse train. Other imaging parameters were: TR/TE=76.7/0.86ms, FOV=32x32x16mm, matrix size=64x64x32, zero-filling to128x128x64 (affording 250 µm isotropic voxel resolution), NEX=2, no respiratory gating. The total experimental time was 16 min 37 sec.
Image Processing: The image processing was done using Matlab. The raw image data was interpolated 3 times along the saturation frequency offset. Then, the minimum intensity point was found for calibrating B0. Finally, CEST asymmetry was calculated using an equation: CESTasym = [M(-offset) – M(+offset)] / M(-300 ppm) * 100%.
Results and Discussion
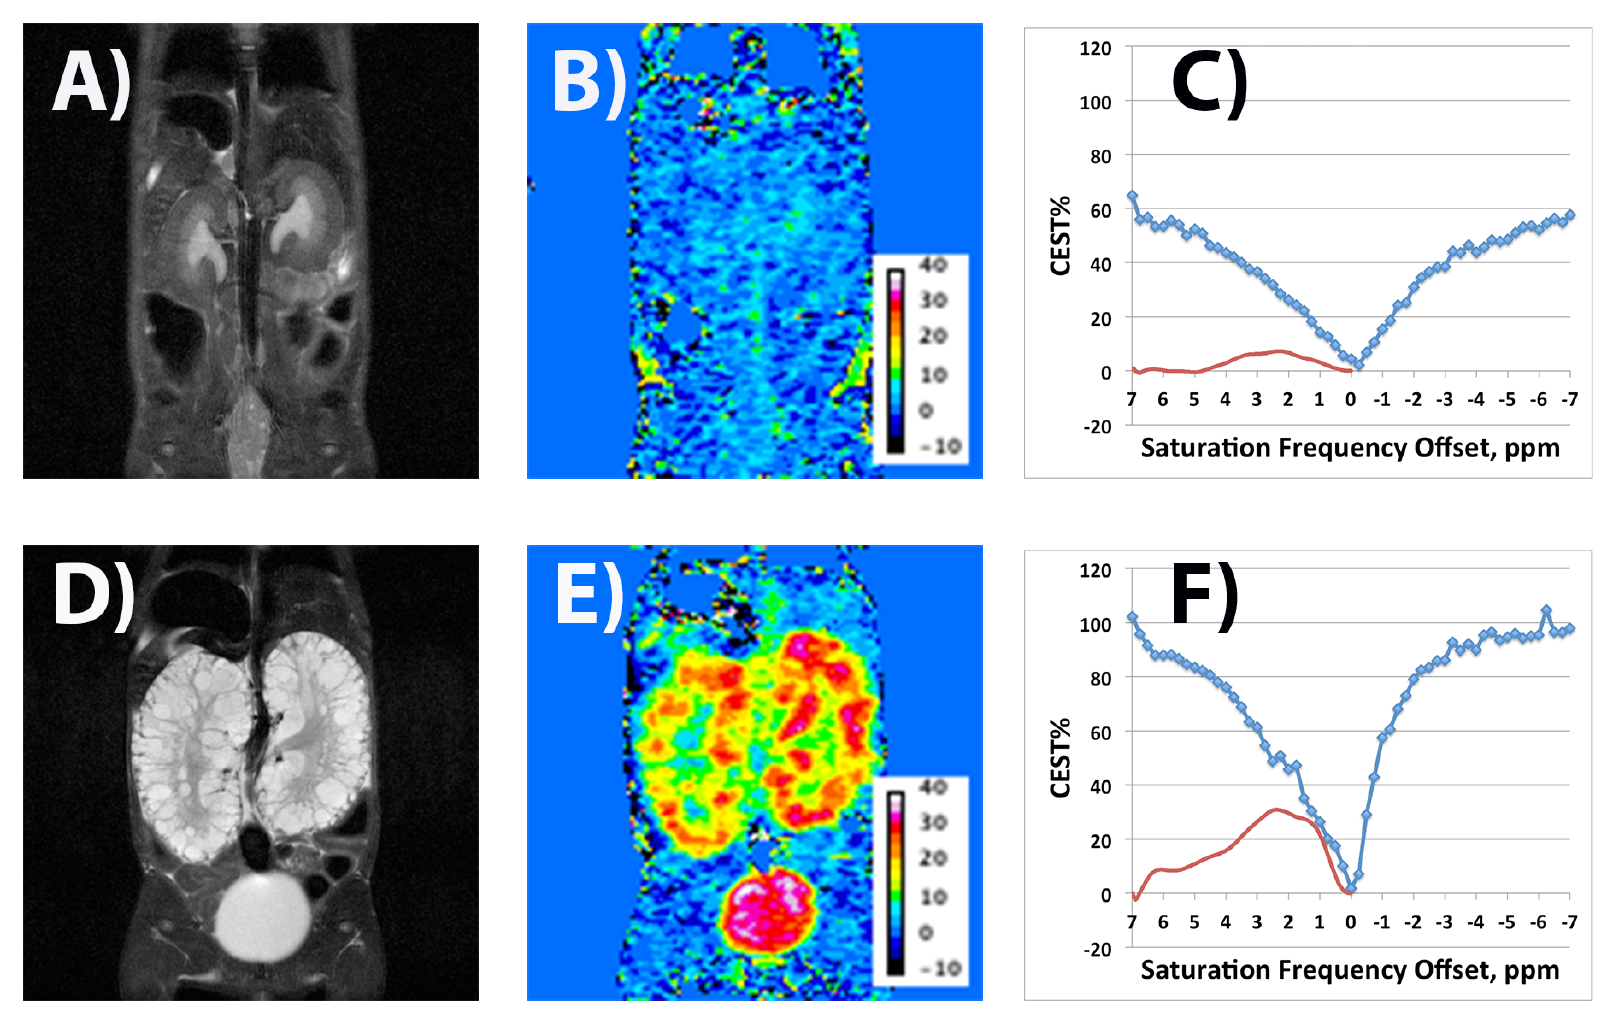
The representative 2D T2W images, CEST images, and CEST & CESTasym plots for a wildtype (WT) mouse and a Pkd2-KO mouse at age 28 days are shown in Figure 1. The total kidney volumes (mm3) of the Pkd2-KO mice were significantly larger than those of WT mice (Pkd2-KO: 1216±150, WT: 171±22, n=6). For Pkd2-KO mice, CEST% at 2.5ppm was as high as 30.5% in cystic region while that was 2.6% at the cortex region and 7.2% at the pelvis region for WT mice. In the CESTasym plot (Fig. 1F), there were two CEST peaks, at 2.5ppm and 1.3 ppm, are preliminarily assigned to creatinine and urea, two byproducts excreted by kidneys. The urea CEST images of human kidneys have been reported previously7. These results clearly demonstrated that CEST technique can be used to distinguish PKD mice from WT mice in additional metabolic information.
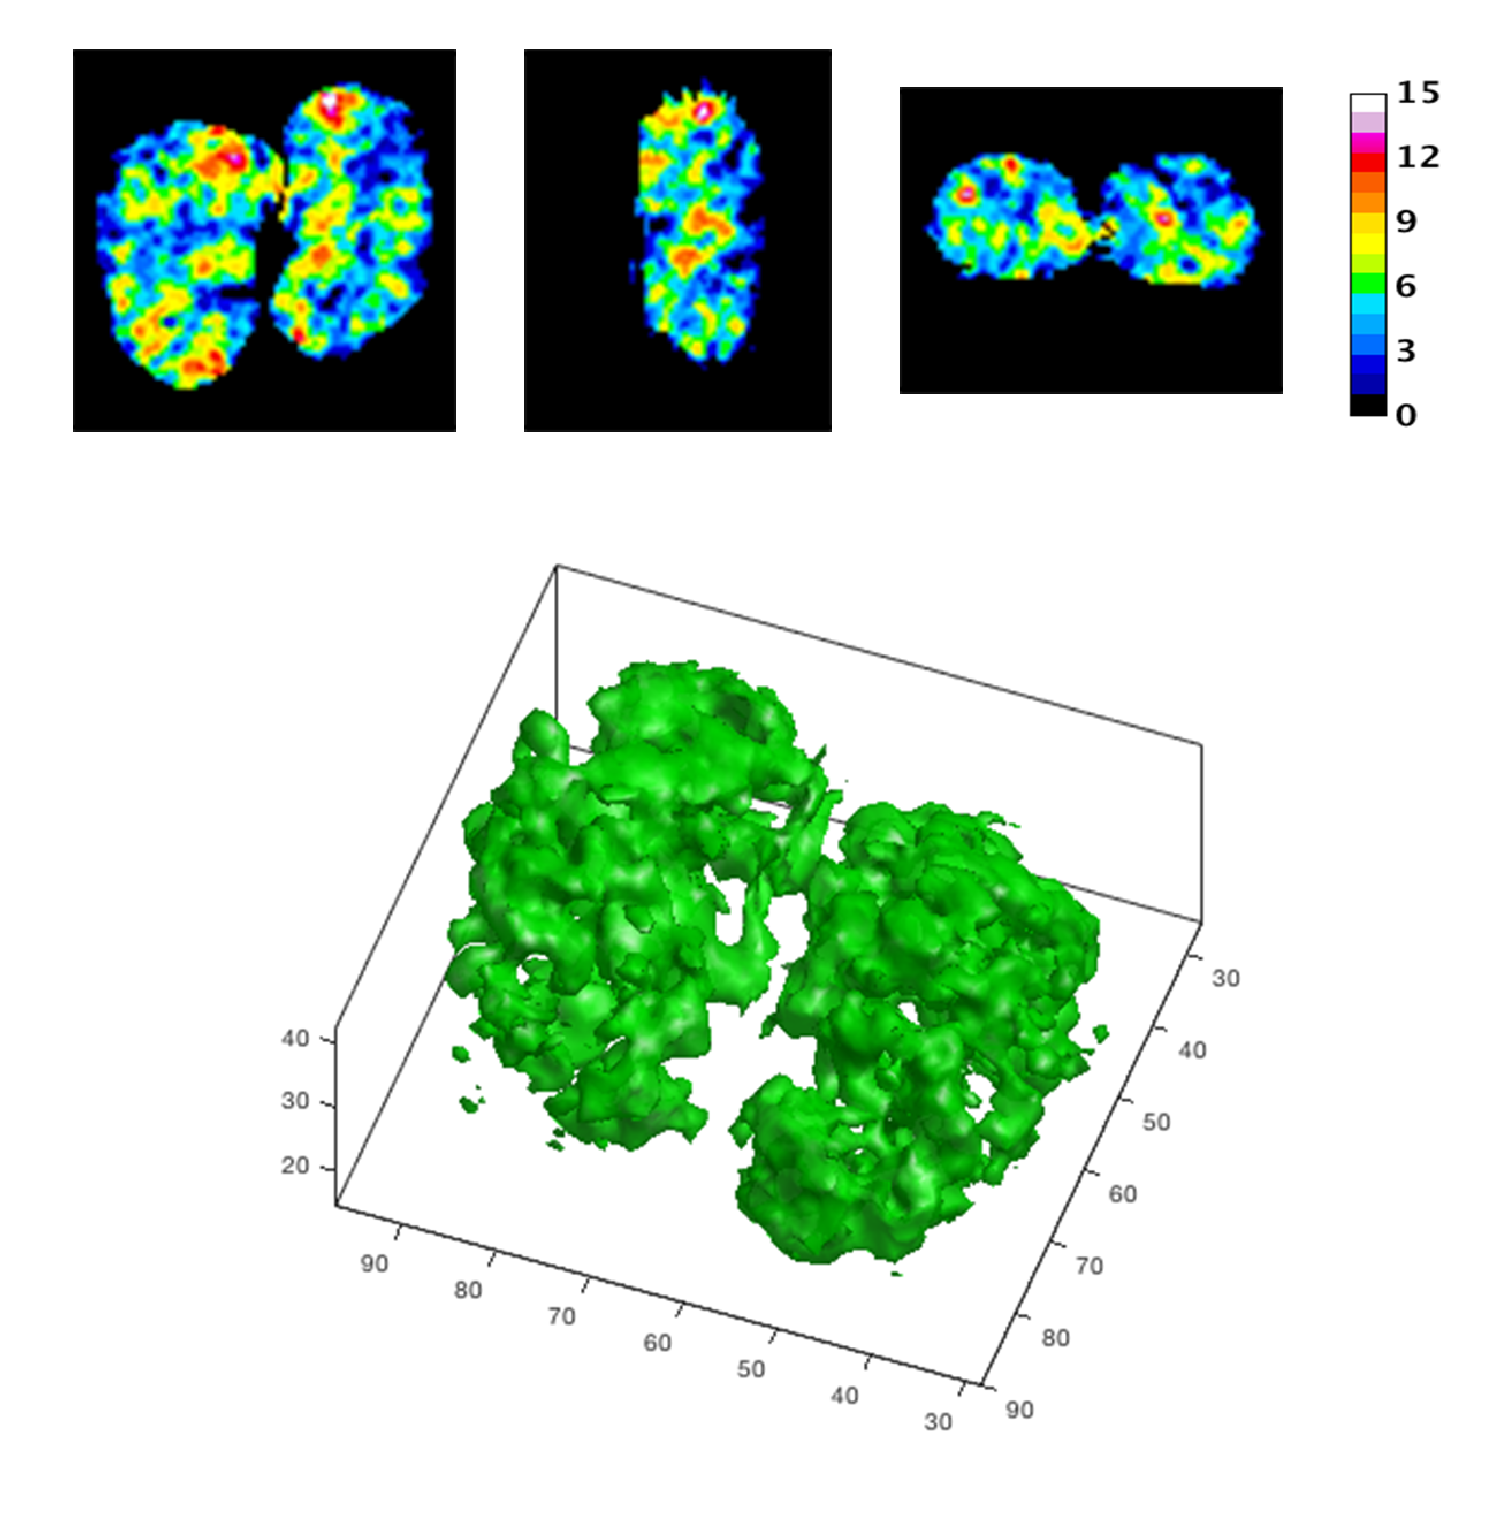
Shown in Fig. 2 are a 3D CEST image at the saturation frequency offset of 2.5 ppm for the same Pkd2-KO mouse and several 2D section images, respectively. 3D patch image (lower) for isosurface of CESTasym = 6% provides the pathologic change on entire kidneys avoiding the partial volume artifacts. Although the cystic CEST pattern is very similar (see the coronal section CEST images shown in Fig. 1 and 2), the CEST% obtained from 3D CEST is much lower than that from 2D CEST so it needs further optimization.
Recently, several relevant articles had been published, two based on 3D gradient and spin echo (3D GRASE)8-9, and one based on 3D fast spin echo (3D FSE)10. All three articles reported on imaging human brain via amide proton transfer (APT) mechanism. Here, we demonstrated that a 3D MPRAGE based 3D CEST were suitable for imaging a mouse model of PKD.
Conclusion
In summary, a new 3D CEST imaging technique based 3D MPRAGE sequence was successfully demonstrated in a mouse model of PKD. This could become a valuable new tool to evaluate the therapeutic effects and potentially could be translated into clinical practice.Acknowledgements
This work was supported by NIH grants R01-CA115531 and R01-DK102572.References
1. Wilson , P. D., Polycystic Kidney Disease. New England Journal of Medicine 2004, 350 (2), 151-164.
2. Patel, V.; Chowdhury, R.; Igarashi, P., Advances in the pathogenesis and treatment of polycystic kidney disease. Current Opinion in Nephrology and Hypertension 2009, 18 (2), 99-106.
3. Ward, K. M.; Aletras, A. H.; Balaban, R. S., A New Class of Contrast Agents for MRI Based on Proton Chemical Exchange Dependent Saturation Transfer (CEST). Journal of Magnetic Resonance 2000, 143 (1), 79-87.
4. Ward, K. M.; Balaban, R. S., Determination of pH using water protons and chemical exchange dependent saturation transfer (CEST). Magnetic Resonance in Medicine 2000, 44 (5), 799-802.
5. Nishio, S.; Tian, X.; Gallagher, A. R.; Yu, Z.; Patel, V.; Igarashi, P.; Somlo, S., Loss of Oriented Cell Division Does not Initiate Cyst Formation. Journal of the American Society of Nephrology 2010, 21 (2), 295-302.
6. Walker-Samuel, S.; Ramasawmy, R.; Torrealdea, F.; Rega, M.; Rajkumar, V.; Johnson, S. P.; Richardson, S.; Goncalves, M.; Parkes, H. G.; Arstad, E.; Thomas, D. L.; Pedley, R. B.; Lythgoe, M. F.; Golay, X., In vivo imaging of glucose uptake and metabolism in tumors. Nat Med 2013, 19 (8), 1067-1072.
7. Vinogradov, E.; Liu, Z.; Madhuranthakam, A.; Hajibeigi, A.; Jump, A.; Pedrosa, I.; Moe, O. W.; Lenkinski, R. E. In Endogenous Urea CEST (urCEST) for MRI monitoring of kidney function, ISMRM 23rd Annual Meeting & Exhibition, Toronto, Ontario, Canada, 2013; Abstract # 3336.
8. Zhu, H.; Jones, C. K.; van Zijl, P. C. M.; Barker, P. B.; Zhou, J., Fast 3D chemical exchange saturation transfer (CEST) imaging of the human brain. Magnetic Resonance in Medicine 2010, 64 (3), 638-644.
9. Zhou, J.; Zhu, H.; Lim, M.; Blair, L.; Quinones-Hinojosa, A.; Messina, S. A.; Eberhart, C. G.; Pomper, M. G.; Laterra, J.; Barker, P. B.; van Zijl, P. C. M.; Blakeley, J. O., Three-dimensional amide proton transfer MR imaging of gliomas: Initial experience and comparison with gadolinium enhancement. Journal of Magnetic Resonance Imaging 2013, 38 (5), 1119-1128.
10. Togao, O.; Keupp, J.; Hiwatashi, A.; Yamashita, K.; Kikuchi, K.; Yoneyama, M.; Honda, H., Amide proton transfer imaging of brain tumors using a self-corrected 3D fast spin-echo dixon method: Comparison With separate B0 correction. Magnetic Resonance in Medicine 2016, online version.
Figures