3744
2-Deoxyglucose-Weighted MR Imaging in Rodent Brain Using Inverse Z-Spectrum Analytic Scheme1Department of Radiology, School of Medicine, College of Medicine, Taipei Medical University, Taipei, Taiwan, 2Department of Medical Imaging, Taipei Medical University Hospital, Taipei Medical University, Taipei, Taiwan, 3Translational Imaging Research Center, College of Medicine, Taipei Medical University, Taipei, Taiwan, 4School of Biomedical Engineering, College of Biomedical Engineering, Taipei Medical University, Taipei, Taiwan, 5Graduate Institute of Biomedical Electrics and Bioinformatics, National Taiwan University, Taipei, Taiwan, 6Department of Medical Research, Taipei Medical University Hospital, Taipei, Taiwan
Synopsis
Our proposed method provides an alternative to extract glucose profile and could be more robust to the field drift, which may be helpful in the implementation of in vivo brain glucoCEST imaging for further application.
Introduction
Glucose chemical exchange saturation transfer (glucoCEST) measurements have been proposed to successfully assess the discrepant concentrations of glucose in in vitro phantom study using D-glucose or 2-deoxy-D-glucose (2-DG) [1]. Asymmetric analysis, such as calculation of asymmetric magnetization transfer ratio (MTRasym) and glucoCEST contrast maps, could provide an opportunity to quantify the altered glucose levels. Although some previous report demonstrated the potential role of glucoCEST in detecting the altered rate of glucose assimilation in vivo, showing comparable information to 18FDG-PET findings [2,3], poor reproducibility due to its high sensitivity to field inhomogeneity, noise level and possible contamination from asymmetric MT and signals from adjacent metabolites, which restrict its clinical application. More recently, Lorentzian function has been performed to fit the z-spectrum as a combination of multiple components, which in corporation with specific mathematical manipulation may provide some possibility for dissecting the signal from individual metabolite with better accuracy and reliability [4]. As a result, the purpose of this study is to develop the analytical scheme and assess the reliability in simulation as well as phantom study for glucoCEST imaging, and finally validate its application of the rodent brain in vivo.Methods
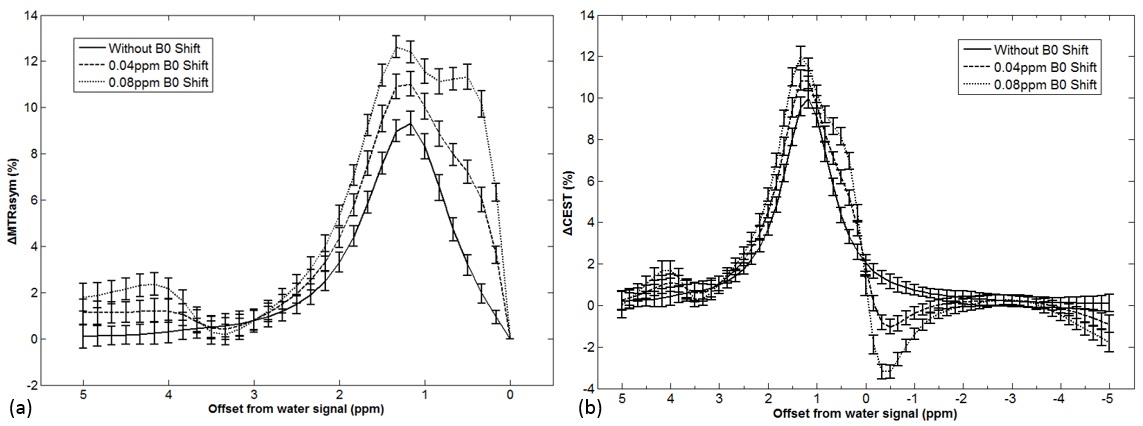
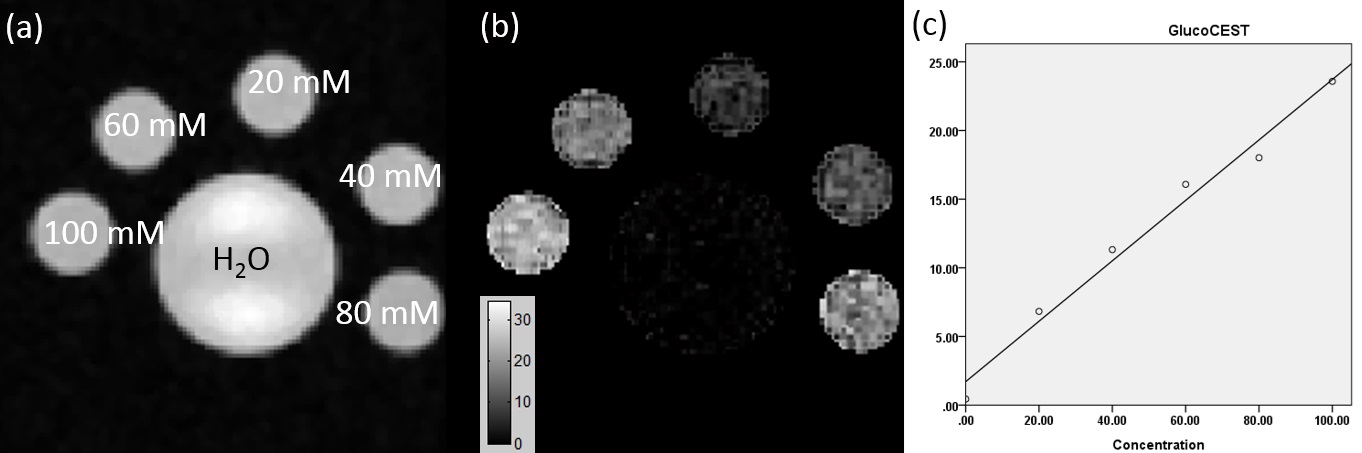
First, two z-spectra (five components at 0 (Water), -1.5 (MT), -3.2 (NOE), 1.2 (Glucose), and 3.5 ppm (APT), respectively) with different glucose levels were simulated to mimic the situation in the brain, and which incorporated with field drifts for further comparison of the superiority from the conventional MTRsym and the proposed scheme. After testing the reliability of the developed fitting models, a phantom study involving a serious of glucose solutions with different concentrations (0, 20, 40, 60, 80, and 100 mM) and in vivo brain scan were performed. The in vivo glucoCEST imaging was performed on a 7.0T animal MR scanner (PharmaScan, Bruker, Erlangen, Germany) with a 72 mm transmitting coil and a quadrature surface coil for receiving. After manual shimming, a turbo spin echo based CEST sequence with a continuous form MT saturation pulse (duration =3000 ms, B1=1.5 μT) was performed before and after administration of the 2-DG . Other imaging parameters were as follows: TR/TE = 3082/37 ms, FOV = 20x20 mm2, matrix size = 64x64, slice thickness = 1 mm, NEX = 1, acquisition time = 12min 12sec, and z-spectrum offset range from -5 to +5 ppm with 0.167 ppm steps. After data acquisition, a 2D median filter was performed first to alleviate the noise effect. Inverse z-spectrum analysis was then applied to fit the 5 individual components after correction of B0 inhomogeneity. For glucoCEST contrast in rodent brain, the signal was derived by subtracting the fitted pre-contrast z-spectrum from the post-contrast z-spectrum.Results
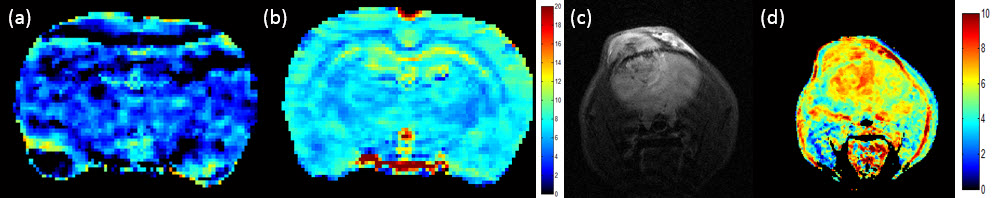
Figure 1 shows results of the subtracted MTRasym spectrum (a) and inverse z-spectrum (b) of the simulated CEST data. The more severe the field drift between two simulated data set, the greater overestimation of the ΔMTRasym at 1.2 ppm. The variation of ΔCEST signal at 1.2 ppm, however, was relatively smaller than the ΔMTRasym. In phantom study, a strong correlation was found between the 2-DG concentrations and the measured glucoCEST signal. (Figure 2). Results of in vivo application in rodent brains was shown in Figure 3. Significant improvement of glucose contrast using the proposed scheme was found (Figure 3(b)) as compared to that derived from the conventional method (Figure 3(a)). Moreover, increased glucoCEST signal in a mouse bearing glioblastoma was obtained as compared to that in the contralateral normal brain tissue (Figure 3(d)).Discussion
This present study demonstrated the ability to extract glucose profile from CEST data using subtracted inverse z-spectrum analytical scheme and indicated the feasibility of detecting the altered glucose assimilation in rodent brain in vivo. A good correlation between the actual glucose concentrations and the measured glucose levels was found in phantom study, demonstrating the great reliability of our proposed method. In rodent brain imaging, greater contrasts between gray matter and white matter in normal rat brain and between tumor and normal brain in the mouse glioma model were observed after administration of 2DG, suggestive of the superiority of our proposed scheme. In conclusion, our preliminary finding demonstrated that the proposed inverse z-spectrum analysis provides an alternative to extract glucose profile and could be more robust to the field drift, which may be helpful in the implementation of in vivo brain glucoCEST imaging for further application.Acknowledgements
This study was supported by the Ministry of Science and Technology, Taipei, Taiwan (MOST 105-2221-E-038-006)References
1. Nasrallah FA, Pages G, Kuchel PW, et al. Imaging brain deoxyglucose uptake and metabolism by glucoCET MRI. J Cereb Blood Flow Metab 2013;33:1270-8
2. Walker-Samuel S, Ramasawmy R., Torrealdea F, et al. In vivo imaging of glucose uptake and metabolism in tumors. Nat Med 2013;19(8): 1067-73
3. Rivlin M, Horev J, Tsarfaty I, Navon G. Molecular imaging of tumors and metastases using chemical exchange saturation transfer (CEST) MRI. Sci Rep. 2013;3:3045. doi: 10.1038/srep03045
4. Cai K, Singh A, Poptani H, et al. CEST signal at 2ppm (CEST@2ppm) from Z-spectral fittinh correlates with creatine distribution in brain tumor. NMR Biomed 2014 ; 28 : 1-8
Figures