3743
GlucoCEST MRI and brain blood barrier permeability in the mouse brain1The Computational, Cognitive and Clinical Neuroimaging Laboratory, Division of Brain Sciences, Department of Medicine, Imperial College London, London, United Kingdom, 2The Imperial College Biological Imaging Centre, Department of Medicine, Imperial College London, London, United Kingdom, 3Division of Brain Sciences, Department of Medicine, Imperial College London, London, United Kingdom
Synopsis
The aim of the study is to examine the feasibility of using GlucoCEST to evaluate subtle BBB dysfunction in the mouse brain, by comparing it with conventional gadolinium DCE. DCE and GlucoCEST showed no significant differences between WT and 5XFAD mice (3 months). However, the degree of the response after injection was similar for DCE and GlucoCEST for all animals except one, indicating shared contributions to the signal and supporting the potential for biodegradable d-glucose as a cheap, low-risk alternative/complement to DCE MRI. More work is required to assess GlucoCEST sensitivity to low-level BBB dysfunction, such as in Alzheimer’s disease.
Introduction and purpose
Brain blood barrier (BBB) alterations have been described in many neurological disorders and can be studied in vivo with dynamic contrast enhanced (DCE MRI) using gadolinium1. GlucoCEST is a molecular MRI contrast mechanism, in which exchangeable protons from hydroxyl groups in the glucose molecule are detected indirectly by their effect on the water signal after an off resonance saturation. GlucoCEST has been suggested as an alternative/complement to DCE to examine BBB breakdown in cancer2,3. The aim of the present study is to examine the feasibility of using GlucoCEST to evaluate more subtle BBB dysfunction in the mouse brain, by comparing it with conventional DCE using gadolinium.Methods
Animals and preparation N=5 5XFAD mice (AD mouse model) and n=4 WT mice (3months of age, fasted overnight) were cannulated in the tail vein and positioned in a 9.4T Bruker BioSpec scanner, equipped with a 4-channel phase array receiver coil. A connector with three lines was connected to a d-glucose solution (0.5 g/mL), Gd-DTPA solution (Gadovist, 1mM) and the tail vein. Injections were done with a syringe pump with the following parameters: first d-glucose, rate: 0.15mL/min, volume: 150mL and later Gd, rate: 0.6mL/min, volume: 50mL. Imaging Repeated single slice CEST measurements were acquired before (n=2) and after (n=3) d-glucose injection. A 3s hard pulse (1.6µT) applied at 17 offsets between ±3.2ppm was followed by a RARE readout with centric encoding ( TR/TE = 4s/6 ms, RARE factor 23, acquisition time 2:24min each). For Gd-DCE, multi-slice T1-weighted images were continuously acquired during Gd injection, for 10min (3min baseline), using a multislice FLASH sequence with TE/TR/flip angle/temporal resolution = 1.21 ms/26 ms/70°/1.4s. Analysis Magnetization transfer ratio (MTR) asymmetry integral maps (1-1.5ppm) were calculated for GlucoCEST using custom-made Matlab scripts. B0 correction was performed by spline-fitting and centering of the Z spectrum. For DCE, relative contrast enhancement (RCE) maps were derived using DCE@urLAB 4. The whole brain was taken as an ROI for both MTR and RCE. Glucose and Gd difference images were computed by subtracting each timepoint and the average of 2 or 20 preinjection images, respectively. Student's t-test was used to compare AD versus WT for both glucoCEST and DCE.Results
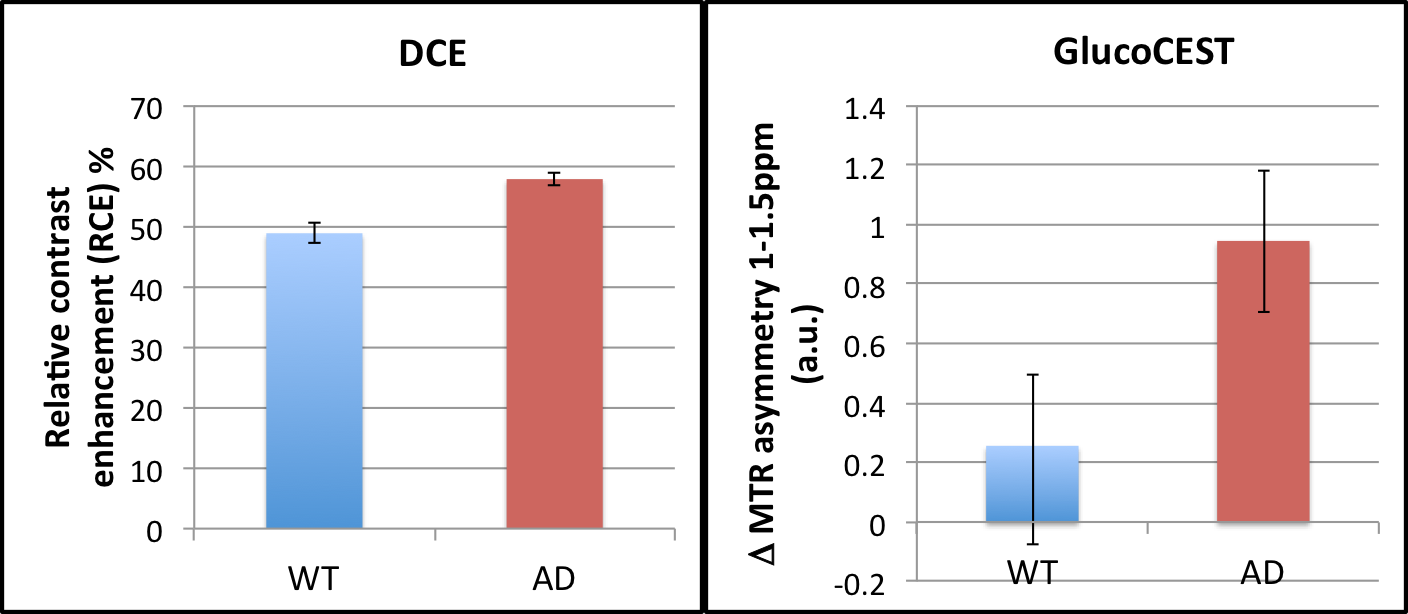
For DCE, after a short T2* decay caused by the high Gd concentration, the dynamic curves showed a continuous increase after injection. For GlucoCEST, the increase in signal occurred at approximately 5min after injection and remained until the end of the measurement (7.5min after injection). DCE and GlucoCEST showed no significant differences between WT and AD mice.Discussion
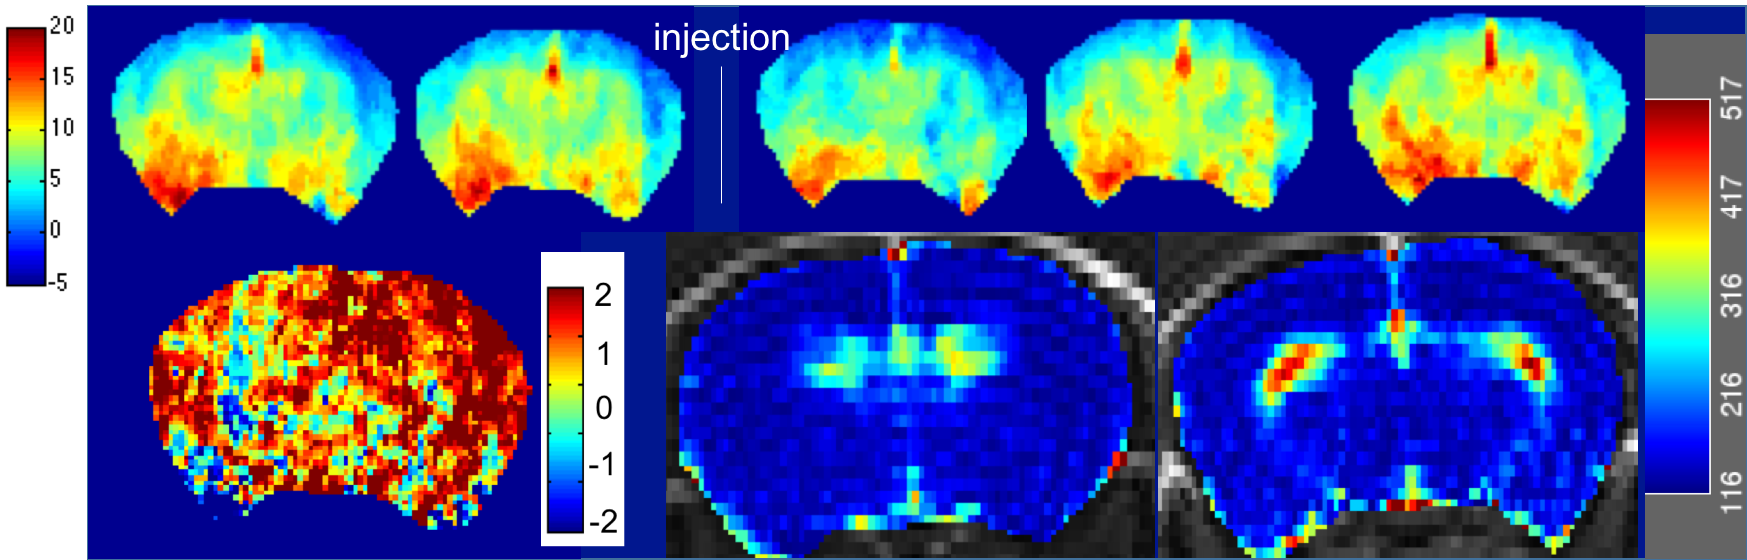
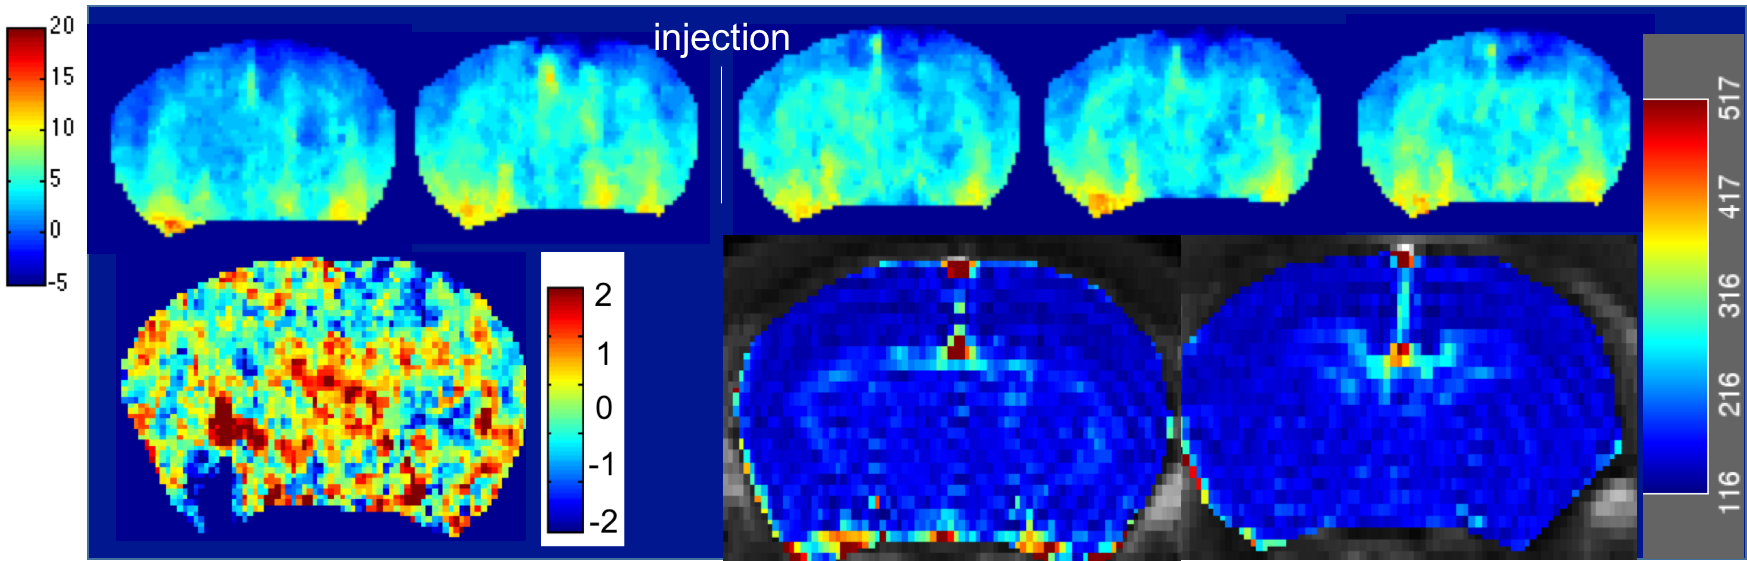
The degree of the response after injection was similar for DCE and GlucoCEST for all animals except one (see Figures 2 and 3), indicating that the two methods share contributions to the signal. Common areas of enhancement include the main blood vessels and surrounding areas in some cases, suggesting increased BBB permeability. GlucoCEST showed a more widespread (cortex, hippocampus) and earlier response, which highlights the fact that is actively transported across the BBB, entering the extracellular space, where it can be taken up by the cells. The imaging results did not show statistically significant differences between groups with these numbers (see Figure 1), and the degree of BBB dysfunction is being evaluated with histology. The animals did not show amyloid plaques in the brain regions imaged, which suggests an early stage of pathology.Conclusion
These results support the potential for using biodegradable d-glucose as a diagnostic agent for MRI, and of GlucoCEST for assessing changes in BBB permeability, as a cheap, low-risk alternative/complement to DCE MRI. More work is required to assess GlucoCEST sensitivity to low-level BBB dysfunction, such as in Alzheimer’s disease.Acknowledgements
No acknowledgement found.References
1. Heye A, Culling R, et al. Assessment of blood-barrier disruption using dynamic contrast-enhanced MRI. A systematic review. Neuroimage Clin. 2014;6:262-274.
2. Xu X, Chan KW, et al. Dynamic glucose enhanced (DGE) MRI for combined imaging of blood-brain barrier break down and increased blood volume in brain cancer. Magn Reson Med. 2015;74(6):1556-1563.
3. Xu X, Yadav NN, et al. Dynamic Glucose-Enhanced (DGE) MRI: Translation to Human Scanning and First Results in Glioma Patients. Tomography. 2015;1(2):105-114.
4. Ortuño JE, Ledesma-Carbayo MJ, et al. DCE@urLAB: a dynamic contrast-enhanced MRI pharmacokinetic analysis tool for preclinical data. BMC Bioinformatics. 2013;14:316.
Figures