3741
Imaging of neuronal compartment using gluCEST method1Molecular Imaging Research Center (MIRCen), Commissariat à l’Energie Atomique (CEA), Fontenay-aux-Roses, France, 2UMS27, INSERM, Fontenay-aux-Roses, France
Synopsis
GluCEST imaging has been proposed to image brain glutamate distribution with a better resolution than spectroscopic methods and has many potential applications for the study of neurodegenerative diseases. In this study, we pushed further the limits of gluCEST imaging by combining high magnetic field and high performance cryoprobe to acquire gluCEST images with the best resolution so far. Thanks to the organization of hippocampal cell layers and the high resolution, we acquired gluCEST data in regions mostly reflecting the neuronal compartment.
PURPOSE
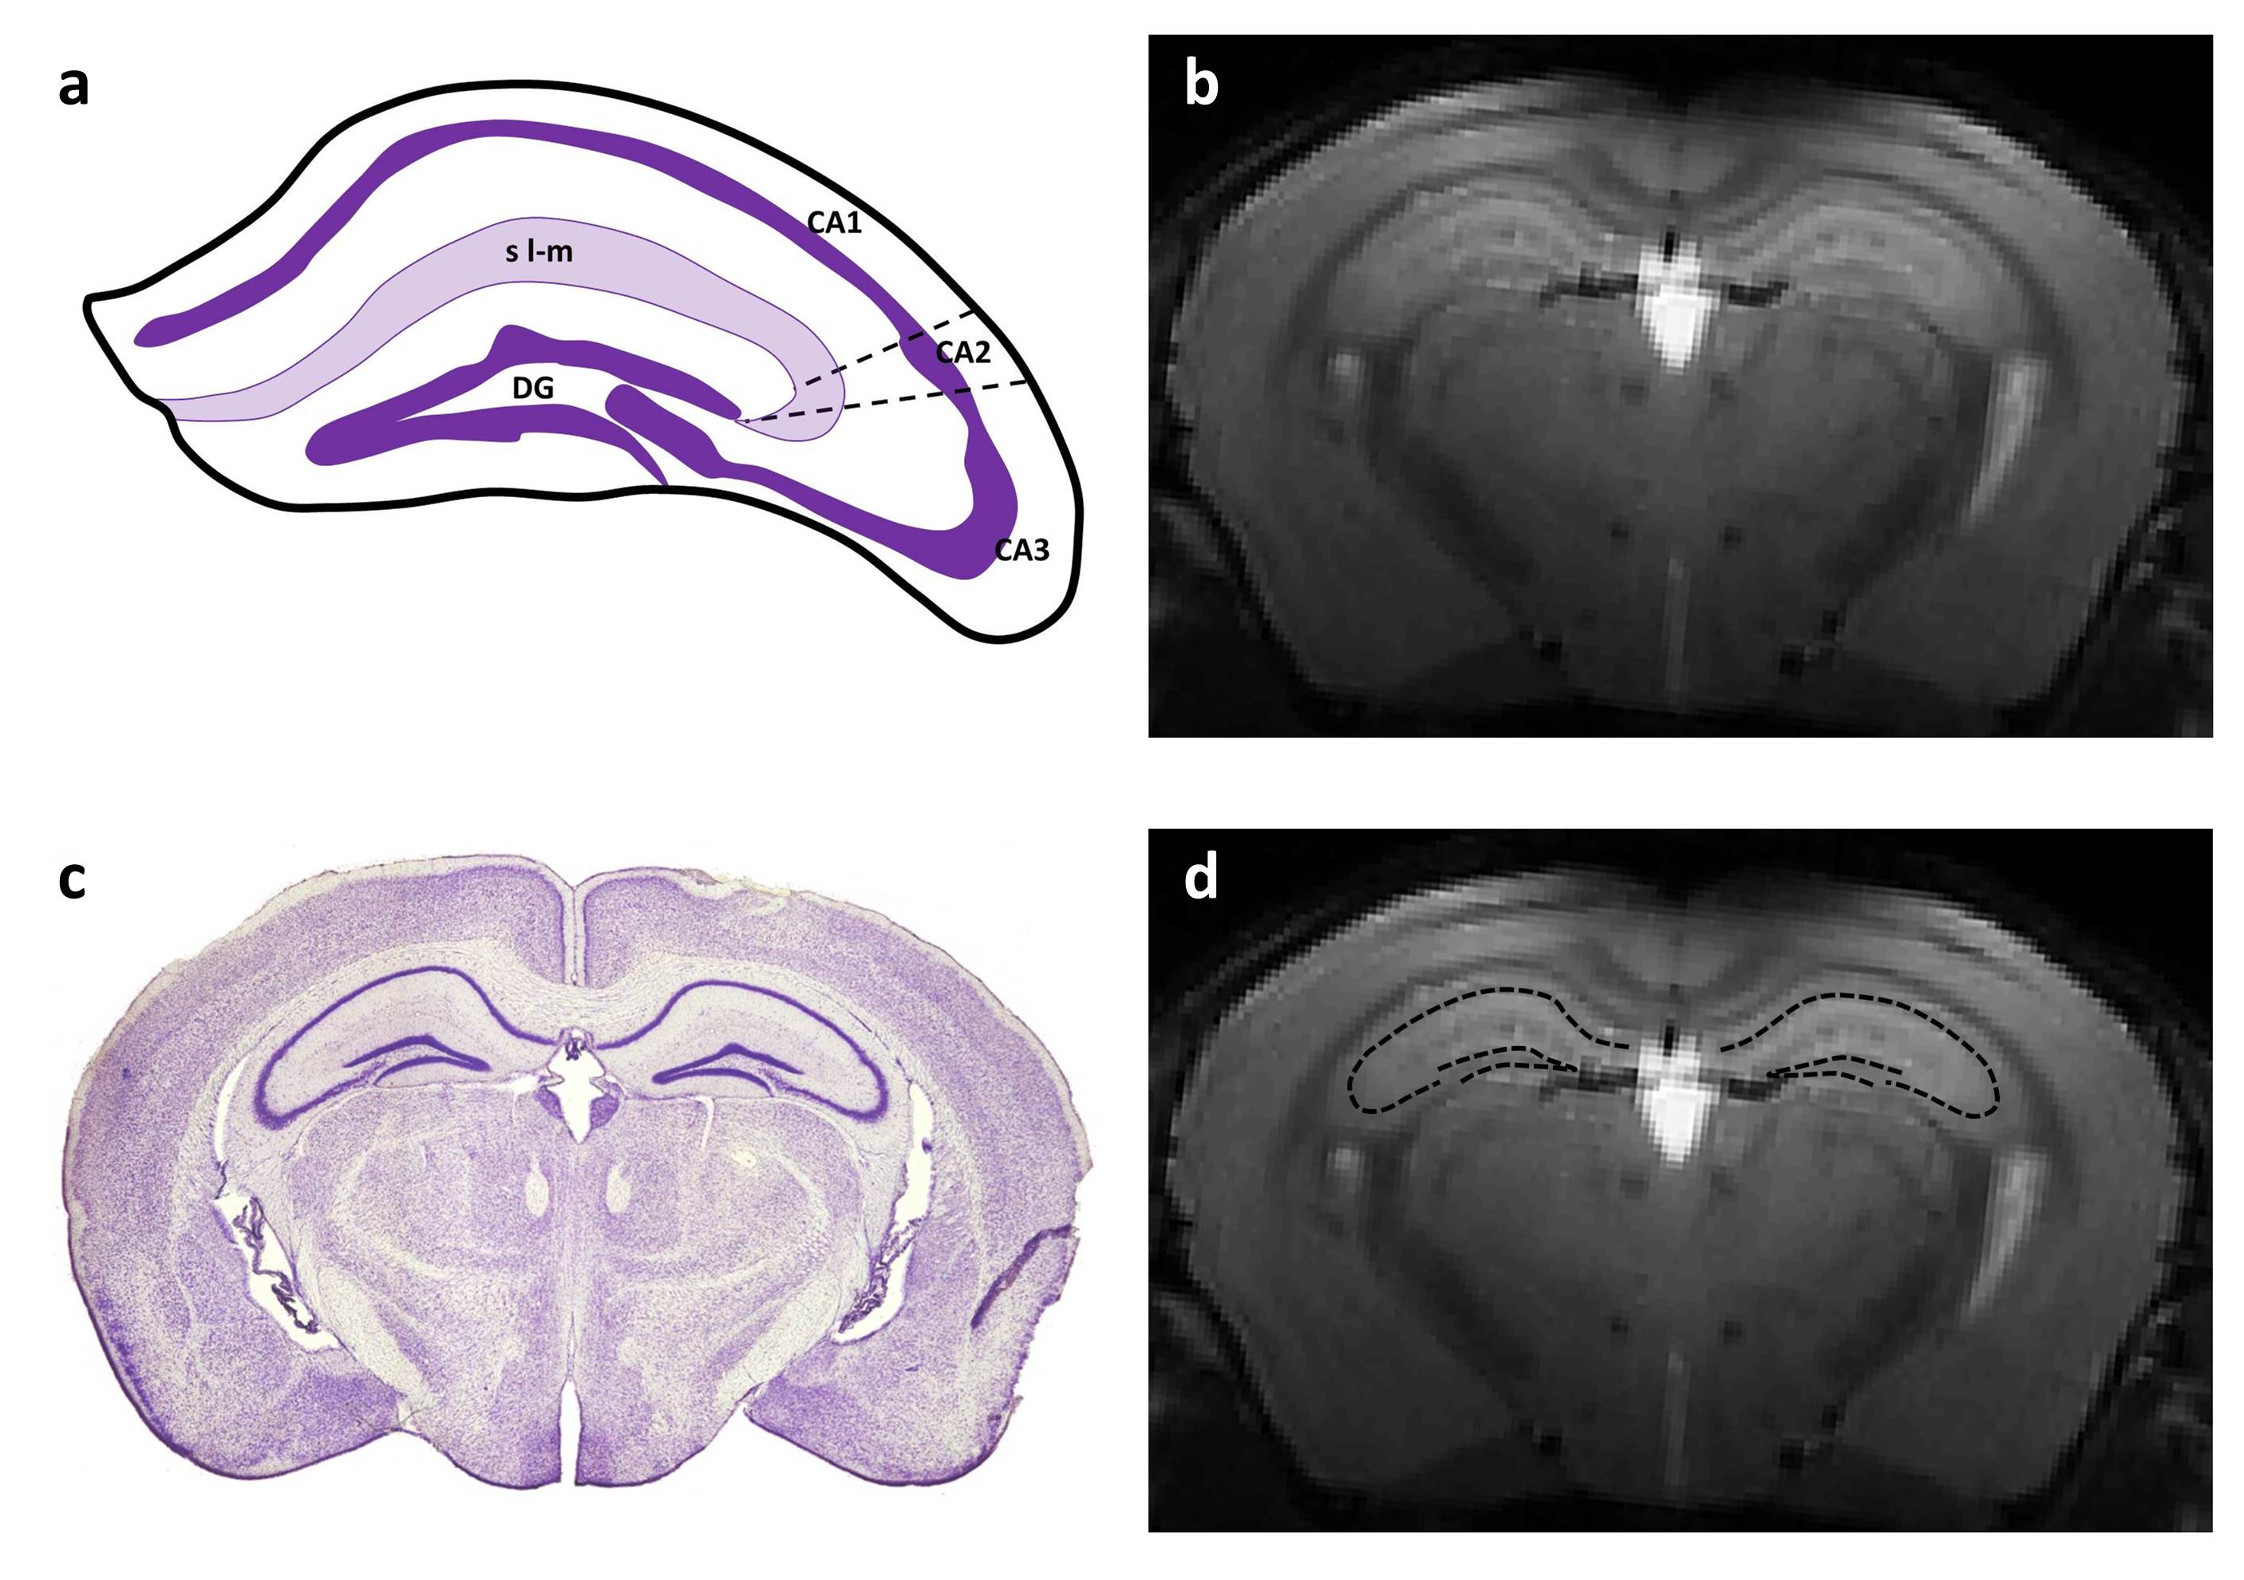
Recently, Chemical Exchange Saturation Transfer (CEST) has been proposed to image diluted molecules with a good spatial resolution1. Interestingly, labile protons of amine groups of glutamate exhibit favorable exchange properties to generate a CEST contrast at high magnetic field2,3. In normal conditions, glutamate is essentially located in the neuronal compartment so it is usually considered as good neuronal marker. Several studies have already performed gluCEST imaging to map spatial distribution of glutamate in rodent and human brains and have demonstrated its potential to study neurodegenerative diseases2-5. However, even if gluCEST offers a good spatial resolution, the voxel size is still limiting to image a “pure” neuronal compartment. Interestingly, mouse hippocampus is a highly organized structure composed by several cell layers composed by different cell types such as neurons or astrocytes. In particular, the dentate gyrus (DG, Fig.1.a) and the cornu ammonis (CA1, 2 and 3, Fig.1.a) are neuron-rich layers containing respectively granule cell neurons and pyramidal neurons. In the present study, we took advantage of high magnetic field and high performance cryoprobe to acquired gluCEST maps with a high resolution in order to visualize cellular layers in the mouse hippocampus in vivo.METHODS
Data were acquired on a horizontal 11.7T Bruker magnet with a high performance cryoprobe offering > 2-fold SNR compared to our best room temperature coil. Wild type mice were anesthetized using 1.5 % isoflurane in a 1:1 gas mixture of air/O2 and positioned in a dedicated stereotaxic frame with mouth and ear bars to prevent any movements during MR acquisitions. GluCEST images were acquired using TSE sequence preceded by a continuous wave saturation pulse of 1 s with an intensity B1 of 5 µT applied at frequencies ranging from -5 to 5 ppm with a step of 1 ppm. Image resolution was 100x100 µm² with 250 µm slice thickness. B0 inhomogeneity was corrected using WASSR method6. GluCEST images were calculated using asymmetric Magnetization Transfer Ratio (MTRasym) at ±3 ppm3.RESULTS
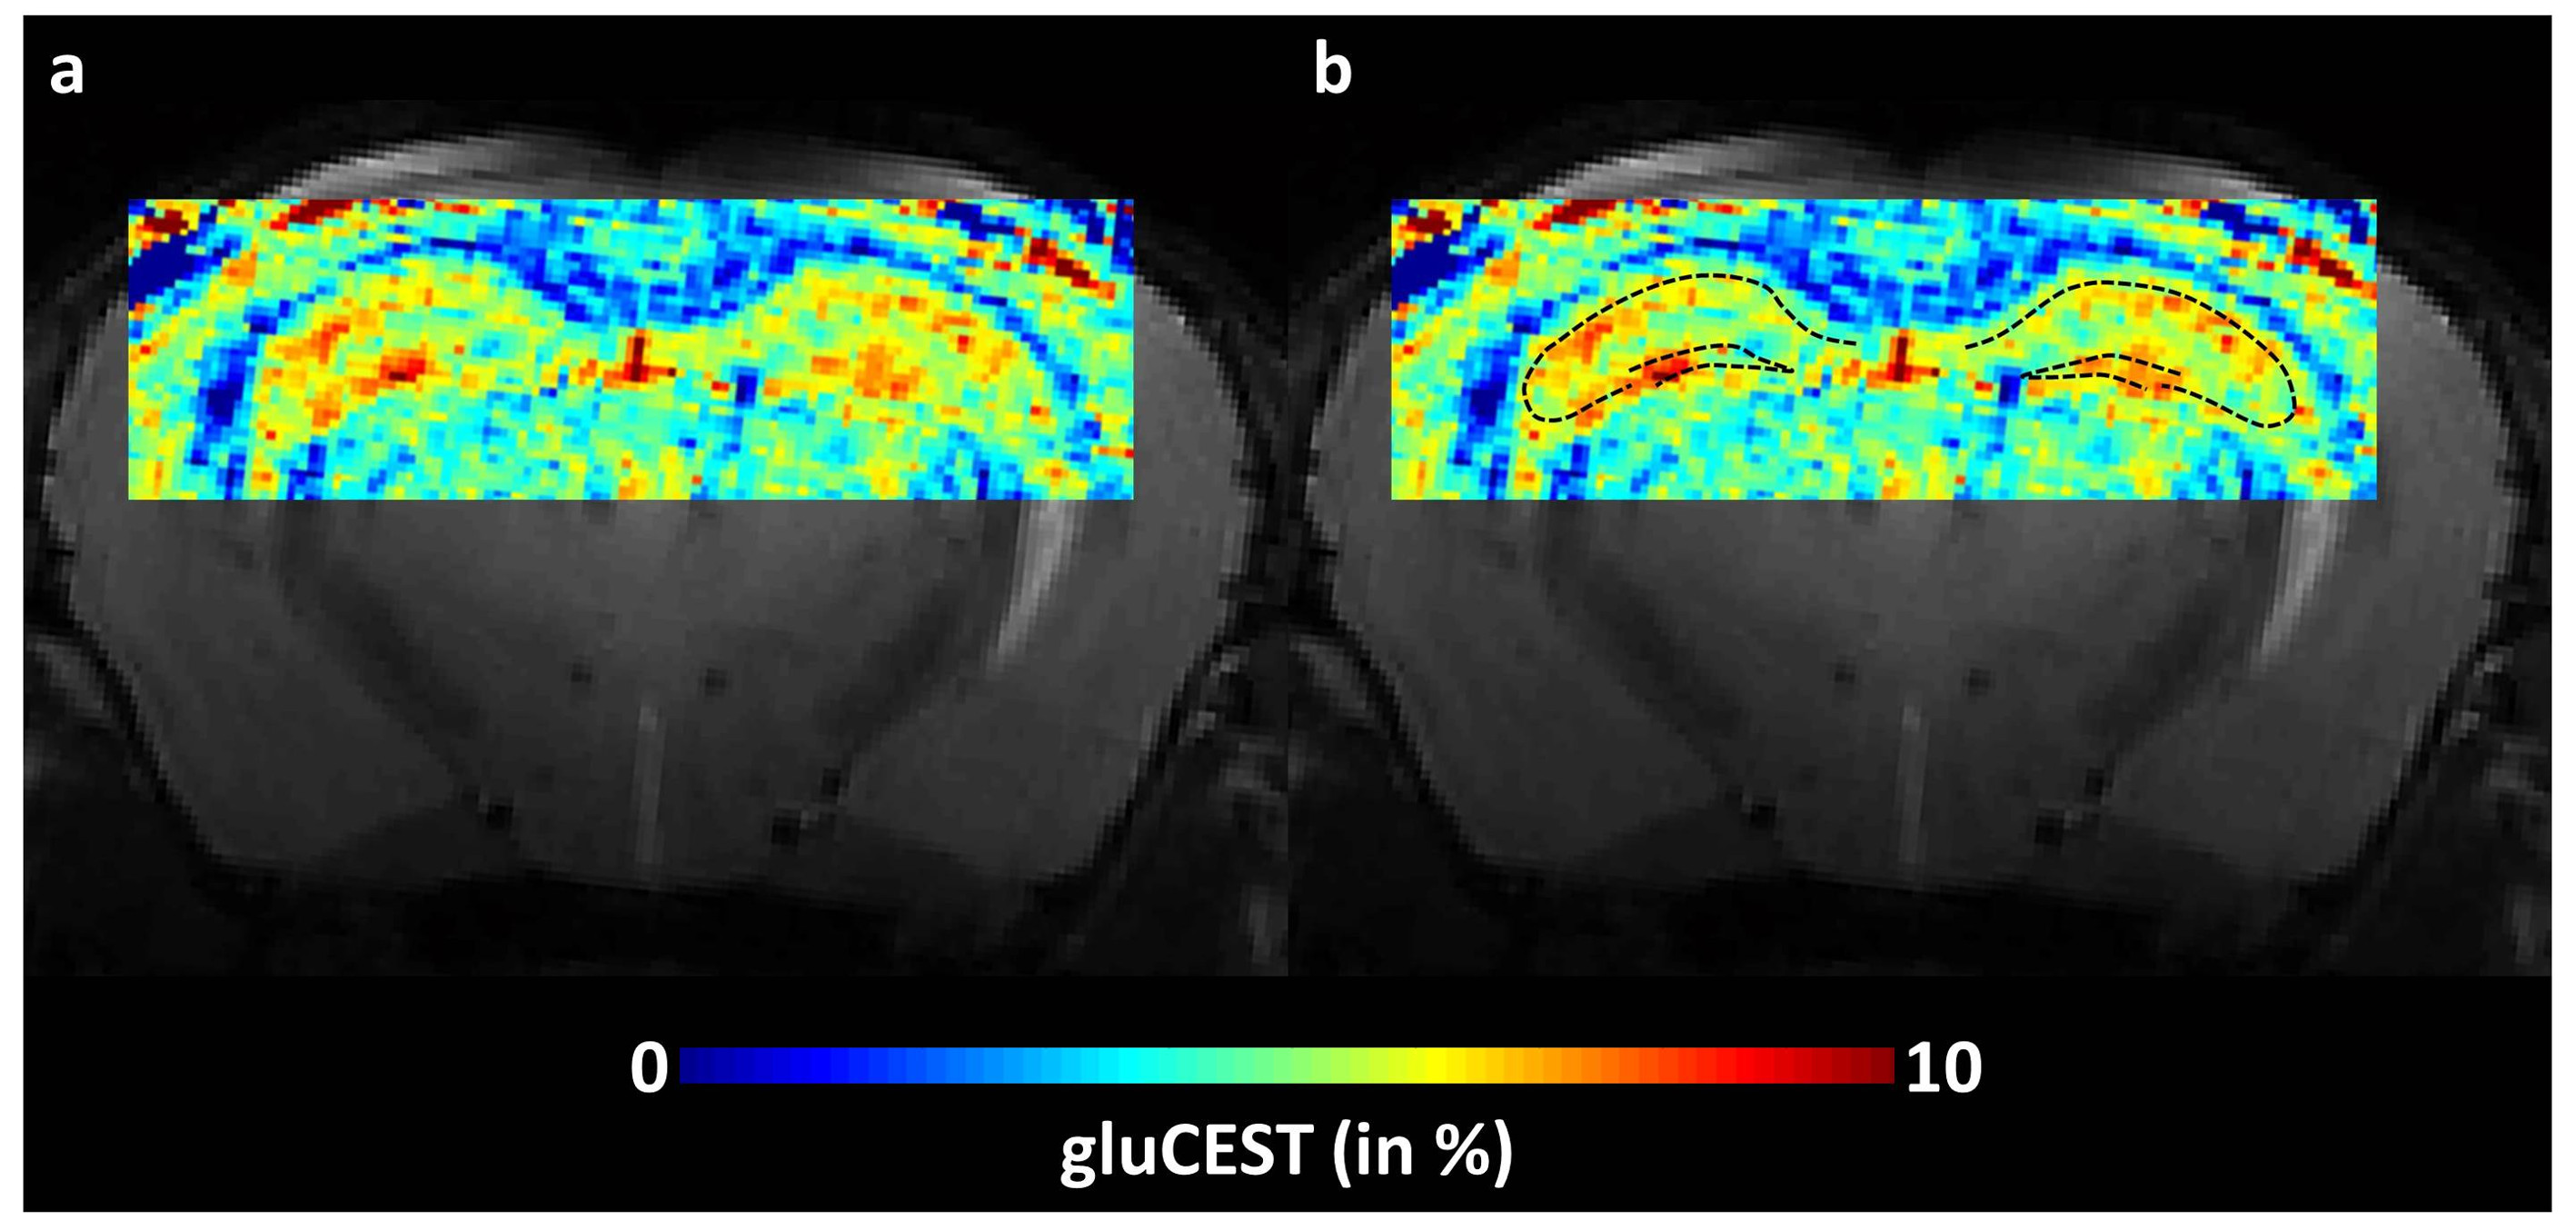
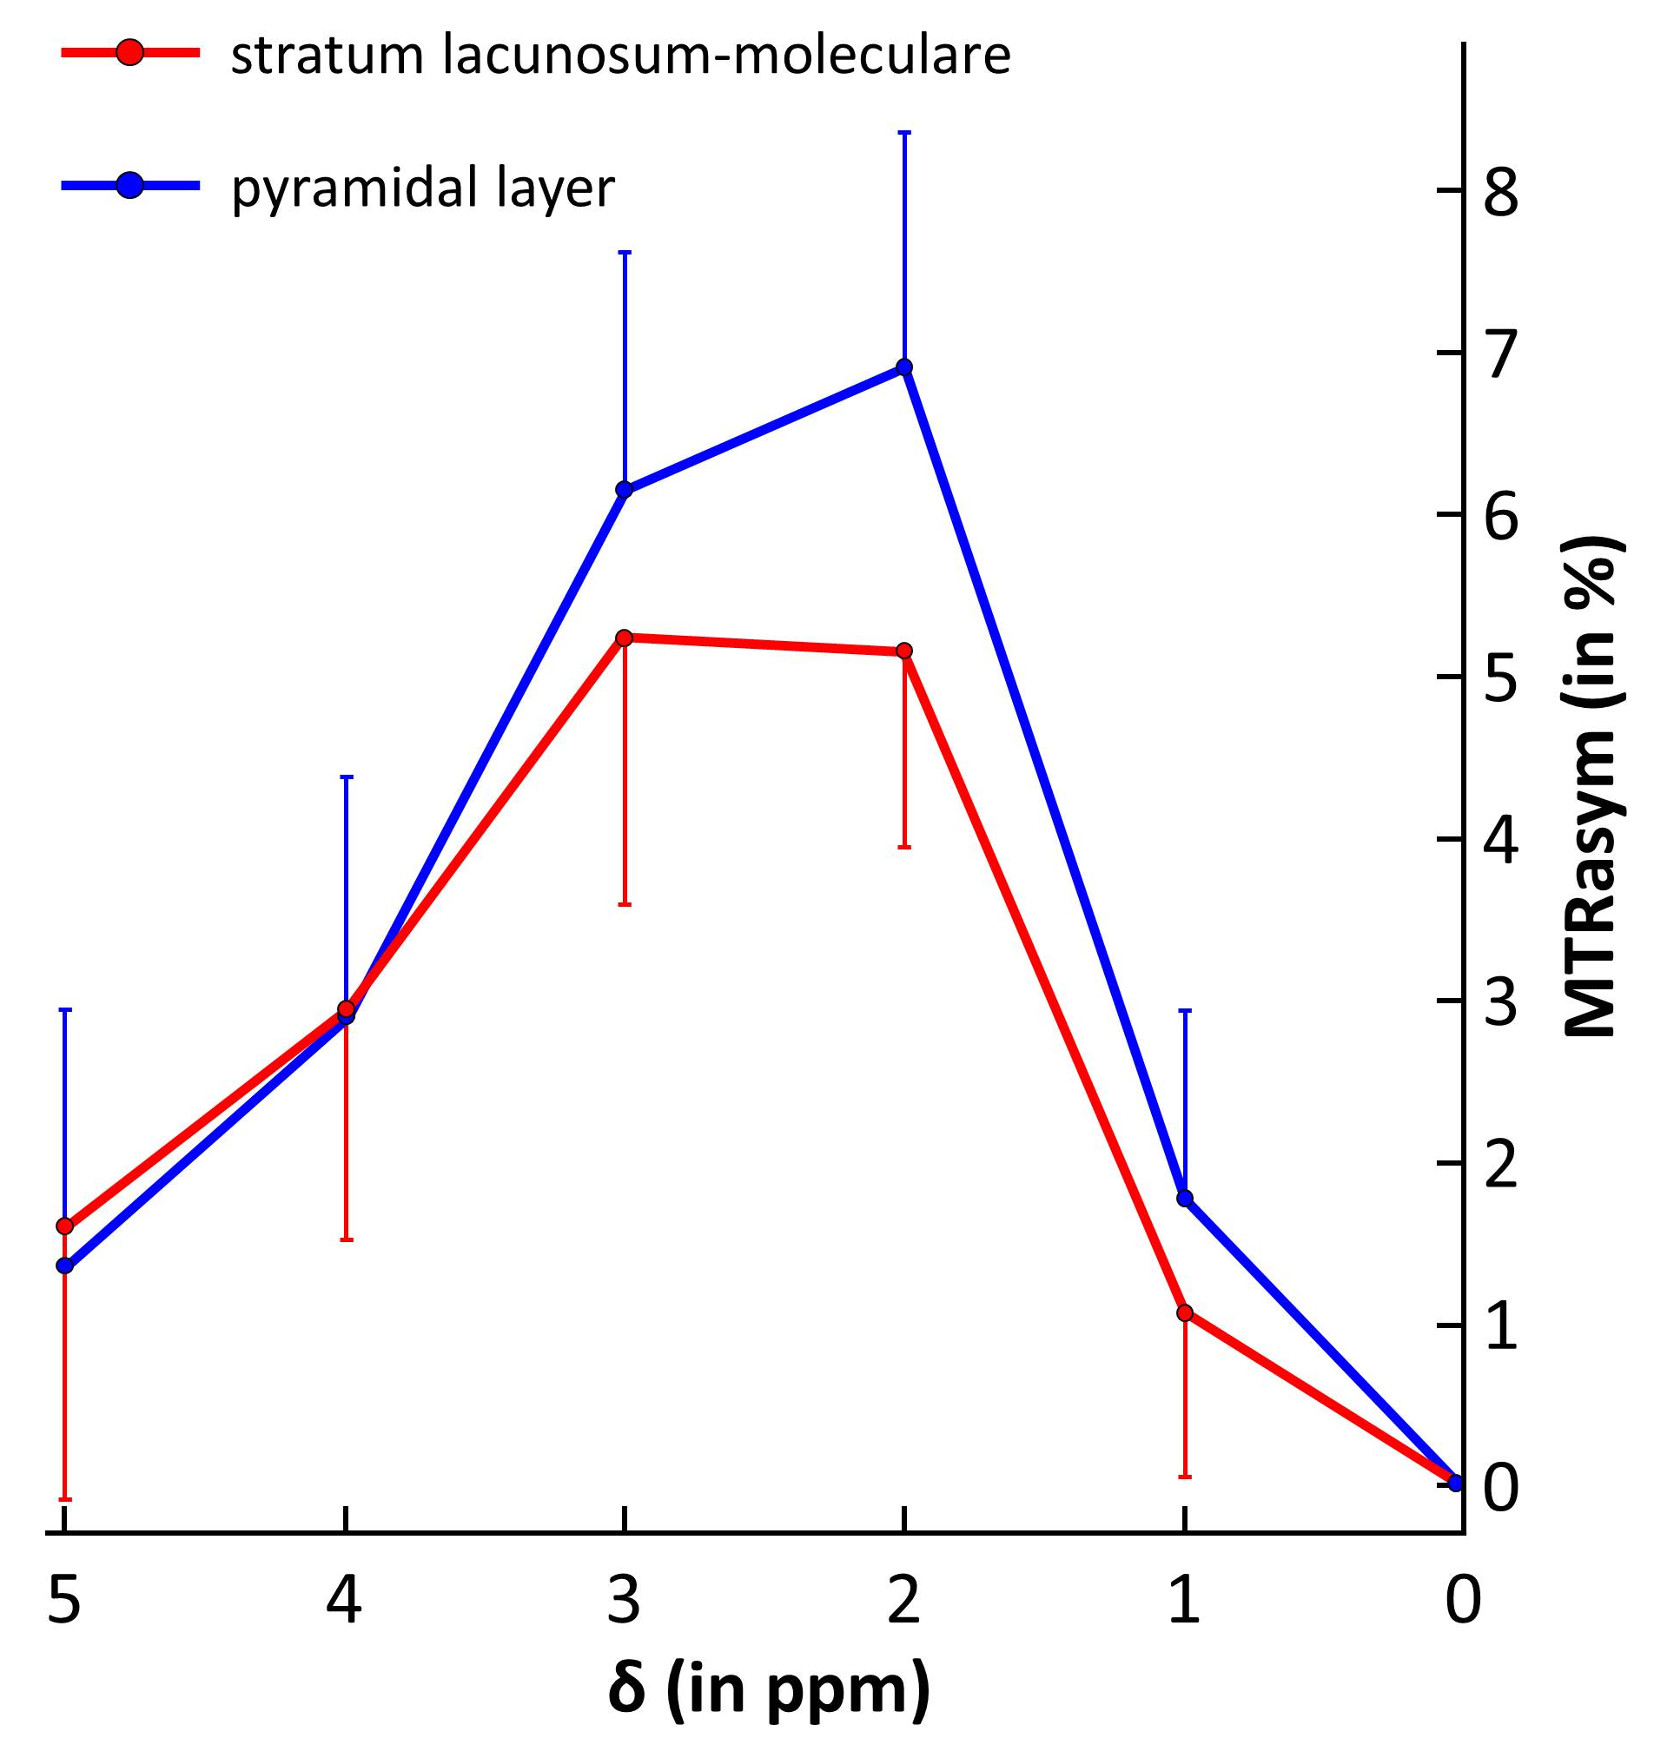
As shown on anatomical T2-weighted image, the resolution was enough to visualize cellular organization of the hippocampus (Fig.1.b). After co-localization with Nissl stained histological slice (Fig.1.c) we determined neuron-rich regions in the hippocampus (Fig.1.d, dotted line). An example of high-resolution gluCEST image is shown on figure 2. The hippocampus as well as the corpus callosum can be visualized very precisely on this gluCEST image (Fig.2.a). Interestingly, areas of higher gluCEST contrast matched very well with neuron-rich regions, i.e. DG and CA regions (Fig.2.b, dotted line). The difference in gluCEST contrasts between cell layers was confirmed by mean MTRasym calculated in the stratum lacunosum-moleculare (see region localization in Fig.1.a) and in the pyramidal layer (Fig.3, blue and red curves respectively).DISCUSSION
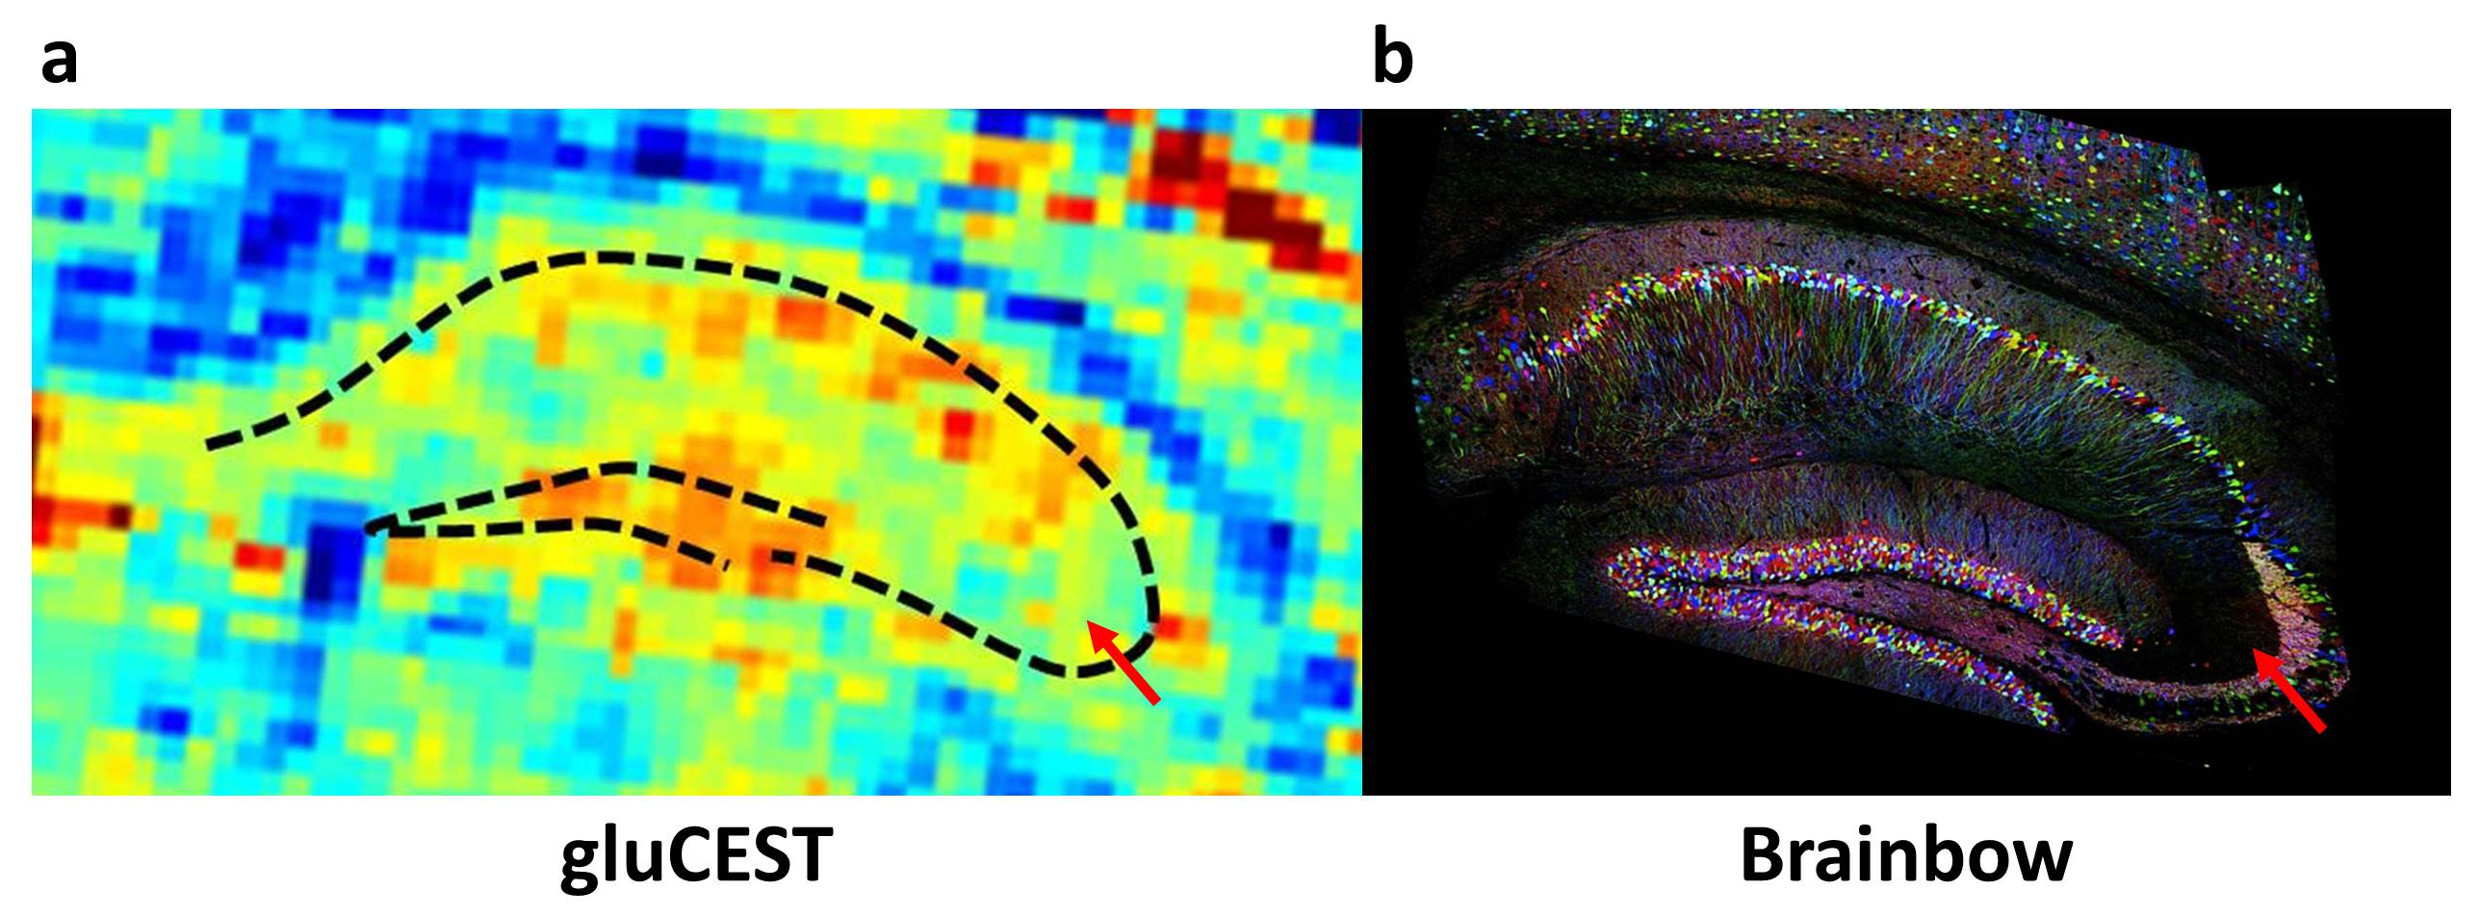
As shown on figure 3, higher gluCEST contrast was observed in the pyramidal layer compared to the stratum lacunosum-moleculare. This tends to confirm that contrast was due to higher glutamate concentration in a neuron-rich region (CA1) compared to the stratum lacunosum-moleculare containing less neuronal cells. Interestingly, a zoom in the gluCEST image showed that the area of higher gluCEST contrast was actually larger than the dotted line representing neuronal cells bodies (Fig.4.a, dotted line). We compared this image with a brainbow image7 which allows visualization of individual neurons (both cell body and axons) using fluorescent proteins (Fig.4.b). Comparison of both images suggests that gluCEST contrast would originate from glutamate contained in cell body but also in axons. Moreover, this idea was supported by the lower gluCEST contrast observed in CA3 region which corresponds to less dense neuronal region (Fig.4, red arrow).CONCLUSION
Thanks to the high magnetic field and the use of a cryoprobe, we were able to acquire a gluCEST image in the mouse hippocampus with the best resolution so far. With this resolution, it was possible to visualize the cellular organization within the hippocampus and to measure the gluCEST contrast in neuron-rich regions, supporting the idea that gluCEST can serve as a good marker of the neuronal compartment.Acknowledgements
This work was funded by Agence Nationale pour la Recherche (grant #14-15CE-0007-01).References
1. Ward KM, Aletras AH, Balaban RS. A new class of contrast agents for MRI based on proton chemical exchange dependent saturation transfer (CEST). Journal of Magnetic Resonance. 2000;143(1):79-87.
2. Cai K, Haris M, Singh A, et al. Magnetic resonance imaging of glutamate. Nat Med. 2012;18(2):302-306.
3. Pepin J, Francelle L, Carrillo-de Sauvage MA, et al. In vivo imaging of brain glutamate defects in a knock-in mouse model of Huntington's disease. Neuroimage. 2016;139:53-64.
4. Crescenzi R, DeBrosse C, Nanga RP, et al. In vivo measurement of glutamate loss is associated with synapse loss in a mouse model of tauopathy. Neuroimage. 2014;101:185-192.
5. Davis KA, Nanga RP, Das S, et al. Glutamate imaging (GluCEST) lateralizes epileptic foci in nonlesional temporal lobe epilepsy. Sci Transl Med. 2015;7(309):309ra161.
6. Kim M, Gillen J, Landman B, Zhou J, van Zijl P. Water Saturation Shift Referencing (WASSR) for Chemical Exchange Saturation Transfer (CEST) Experiments. Magnetic Resonance in Medicine. 2009;61(6):1441-1450.
7. Livet J. [The brain in color: transgenic "Brainbow" mice for visualizing neuronal circuits]. Medecine sciences : M/S. 2007;23(12):1173-1176.
Figures