3740
In Vivo Detection of Reactive Oxygen Species Using MRI with Endogenous Contrast1Radiology, University of Illinois at Chicago, Chicago, IL, United States, 2Center for MR Research, University of Illinois at Chicago, Chicago, IL, United States, 3Bioengineering, University of Illinois at Chicago, Chicago, IL, United States, 4Research Resource Center, University of Illinois at Chicago, Chicago, IL, United States, 5Radiology, Northwestern University, Chicago, IL, United States, 6Neurosurgery, University of Illinois at Chicago, Chicago, IL, United States, 7Anatomy and Cell Biology, University of Illinois at Chicago, Chicago, IL, United States
Synopsis
Reactive oxygen species (ROS) contribute to pathogenesis of many human diseases including Parkinson’s and Alzheimer's diseases, cancer, and diabetes. There is a crucial need for using fully noninvasive imaging to further evaluate the role of ROS in pathogenesis and the potential treatment strategies. Our previous phantom studies demonstrated that ROS containing unpaired electrons can be detected with endogenous CEST and T1 weighted contrasts. However, in vivo detection of ROS using MRI has not yet been demonstrated. This study therefore aimed to demonstrate the feasibility of in vivo ROS detection using endogenous MRI.
Purpose
Reactive oxygen species (ROS) are critical contributors in the pathogenesis of many human diseases including Parkinson’s and Alzheimer's diseases, cancer, and diabetes1-3. In vivo imaging ROS is therefore useful to further evaluate its role in the pathogenesis and the potential treatment strategies. The previous studies on H2O2-treated fresh egg white samples demonstrated that MRI is useful to detect ROS based on its endogenous contrasts4-6. ROS was found to be paramagnetic or to shorten T1 and to enhance proton-exchange rate through a proposed oxidation-catalyzed mechanism, both leading to reduced endogenous chemical exchange saturation transfer (CEST) contrast. In addition, the ROS detection sensitivity was shown to be within physiological range6. However, in vivo detection of ROS using MRI has not yet been demonstrated. Here, in vivo imaging studies were performed to pave the path for clinical translation of this endogenous ROS MRI technique.Methods
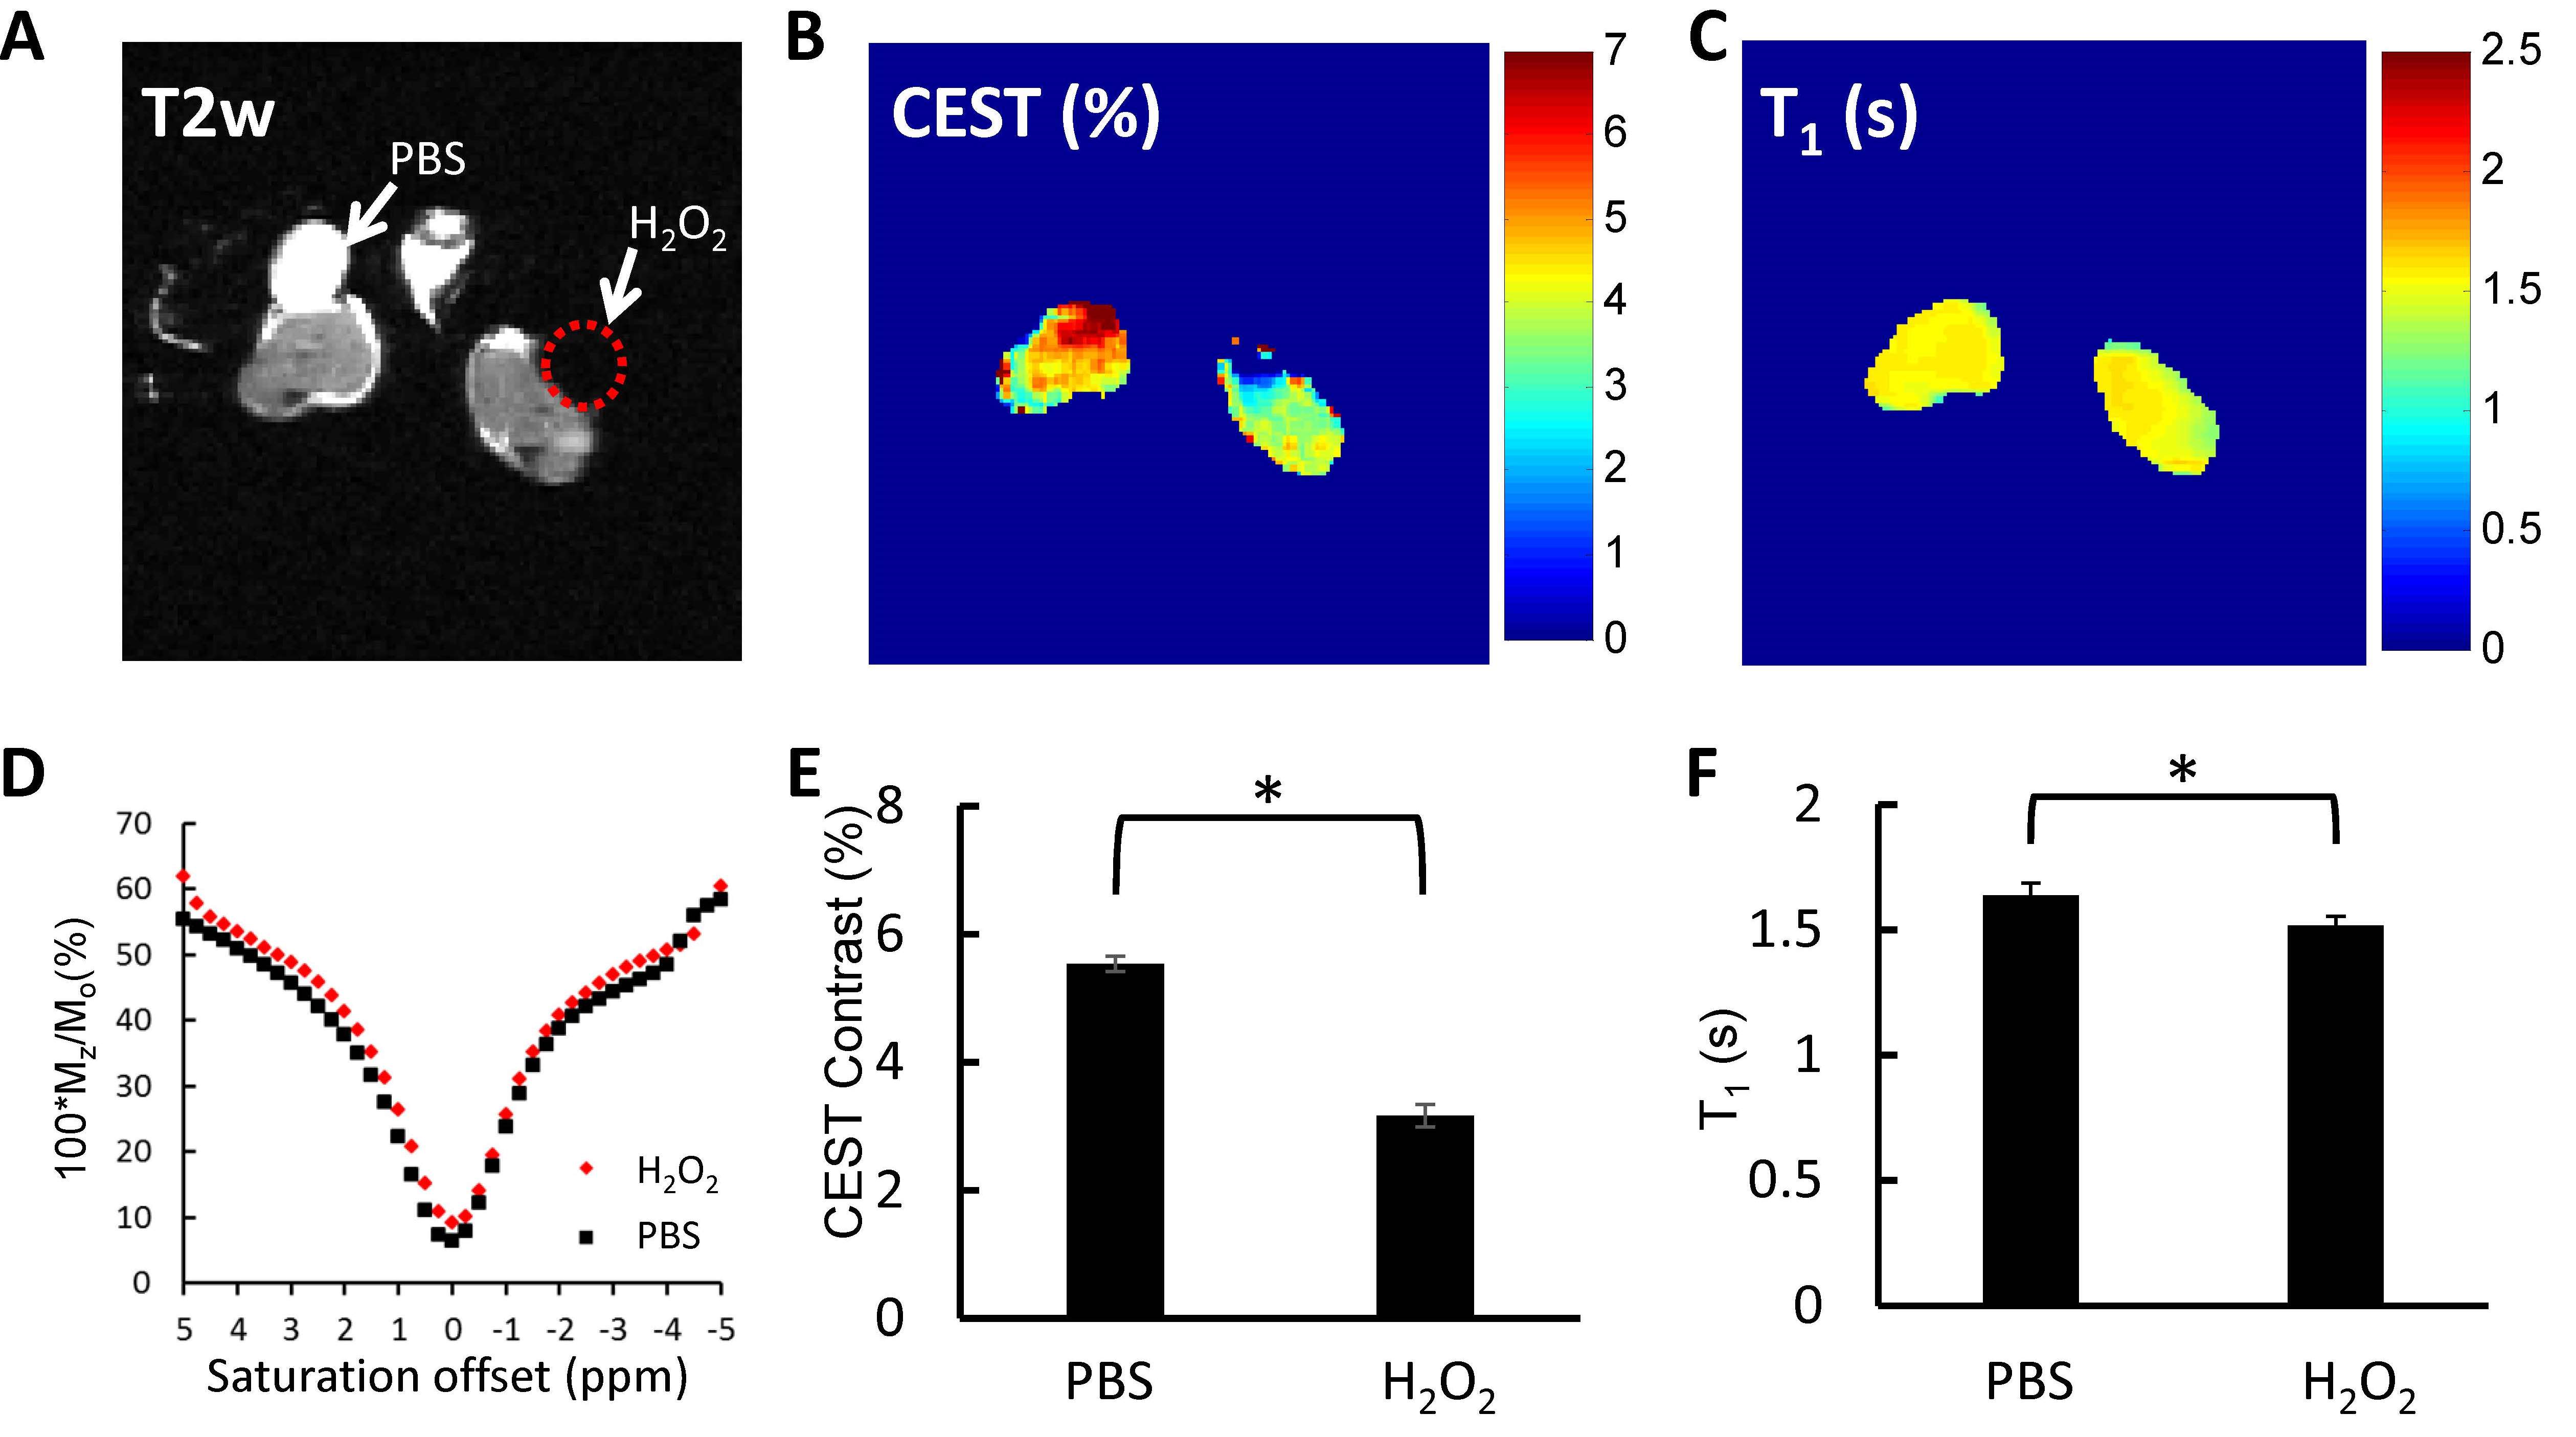
Two in vivo animal models were used. In the first study (n = 3), muscle in the left and right hind legs was exposed by incising the skin and was treated topically with 1.5 mL of either PBS or 10% hydrogen peroxide. MR imaging was carried out 30 min after treatment.
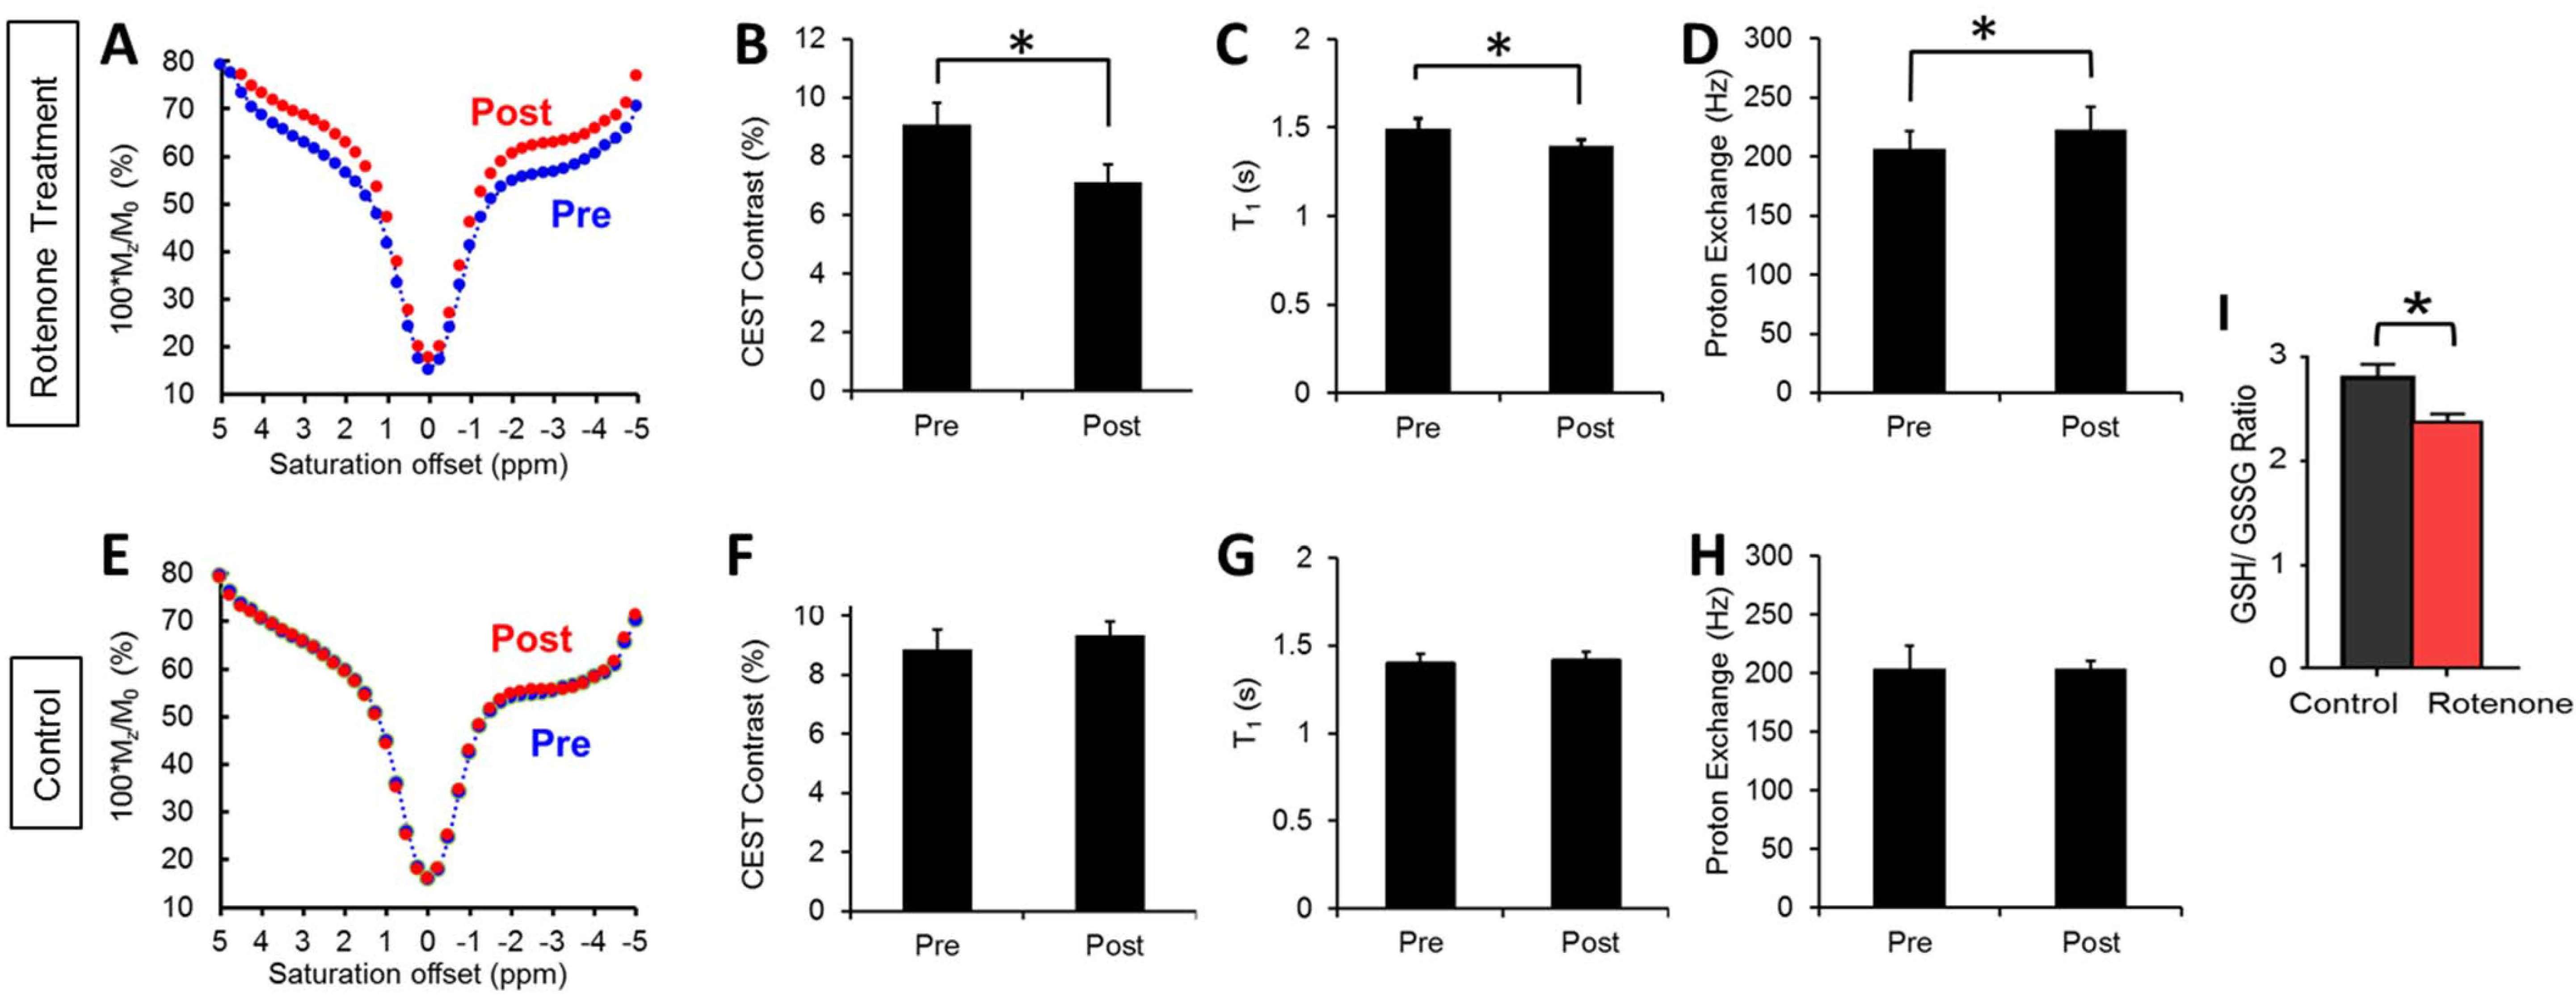
In the second approach, we imaged a well-established mice model that ROS can be systematically overproduced by injecting rotenone, an inhibitor of mitochondria complex I7. Mice brain (n=5) were imaged before and 1.5-hour after the administration of rotenone (intraperitoneal injection, 20 mg/kg body weight)8. Control mice (n=4) received same dose of PBS vehicle were also studied.
MR imaging was performed on a horizontal 9.4-T MRI animal scanner. CEST Z-spectra were collected using a customized sequence with a frequency-selective rectangle saturation pulse (B1=50 Hz, 3 s) 4-6. CEST asymmetry effect was computed at 3.5 ppm normalized by signal at +100 ppm. In addition, fast spin echo sequence with varied inversion recovery times was used to map T1. In the rotenone study, we also assessed the proton exchange rates of mice brain before and after treatment based on the QUantifying Exchange using Saturation Power (QUESP) approach9.
Rotenone induced ROS overproduction was further assessed by biochemical analysis of Glutathione (GSH) and oxidized glutathione (GSSG). In brief, after 1.5 hours post rotenone or PBS injection, mice were sacrificed and brain tissues were dissected for the biochemical analyses of GSH/GSSG ratio using Glutathione Assay kit (Cayman Chemical, USA)10.
A one-tailed Student’s t-test was used for all statistical comparisons with significance set at p<0.05.
Results and Discussion
The T2-weighted anatomical image (Figure 1A) shows two hind legs with wound created and treated with either PBS or H2O2. Consistent to previous studies4-6, Z-spectra are affected by H2O2 treatment (Figure 1D) resulting in a significant reduction in CEST contrast compared to the PBS-treated leg (p<0.05) (Figure 1B, E). The reduction in T1 relaxation time (Figure 1C, F) is likely due to the paramagnetic effect of ROS as we reported earlier4-6.
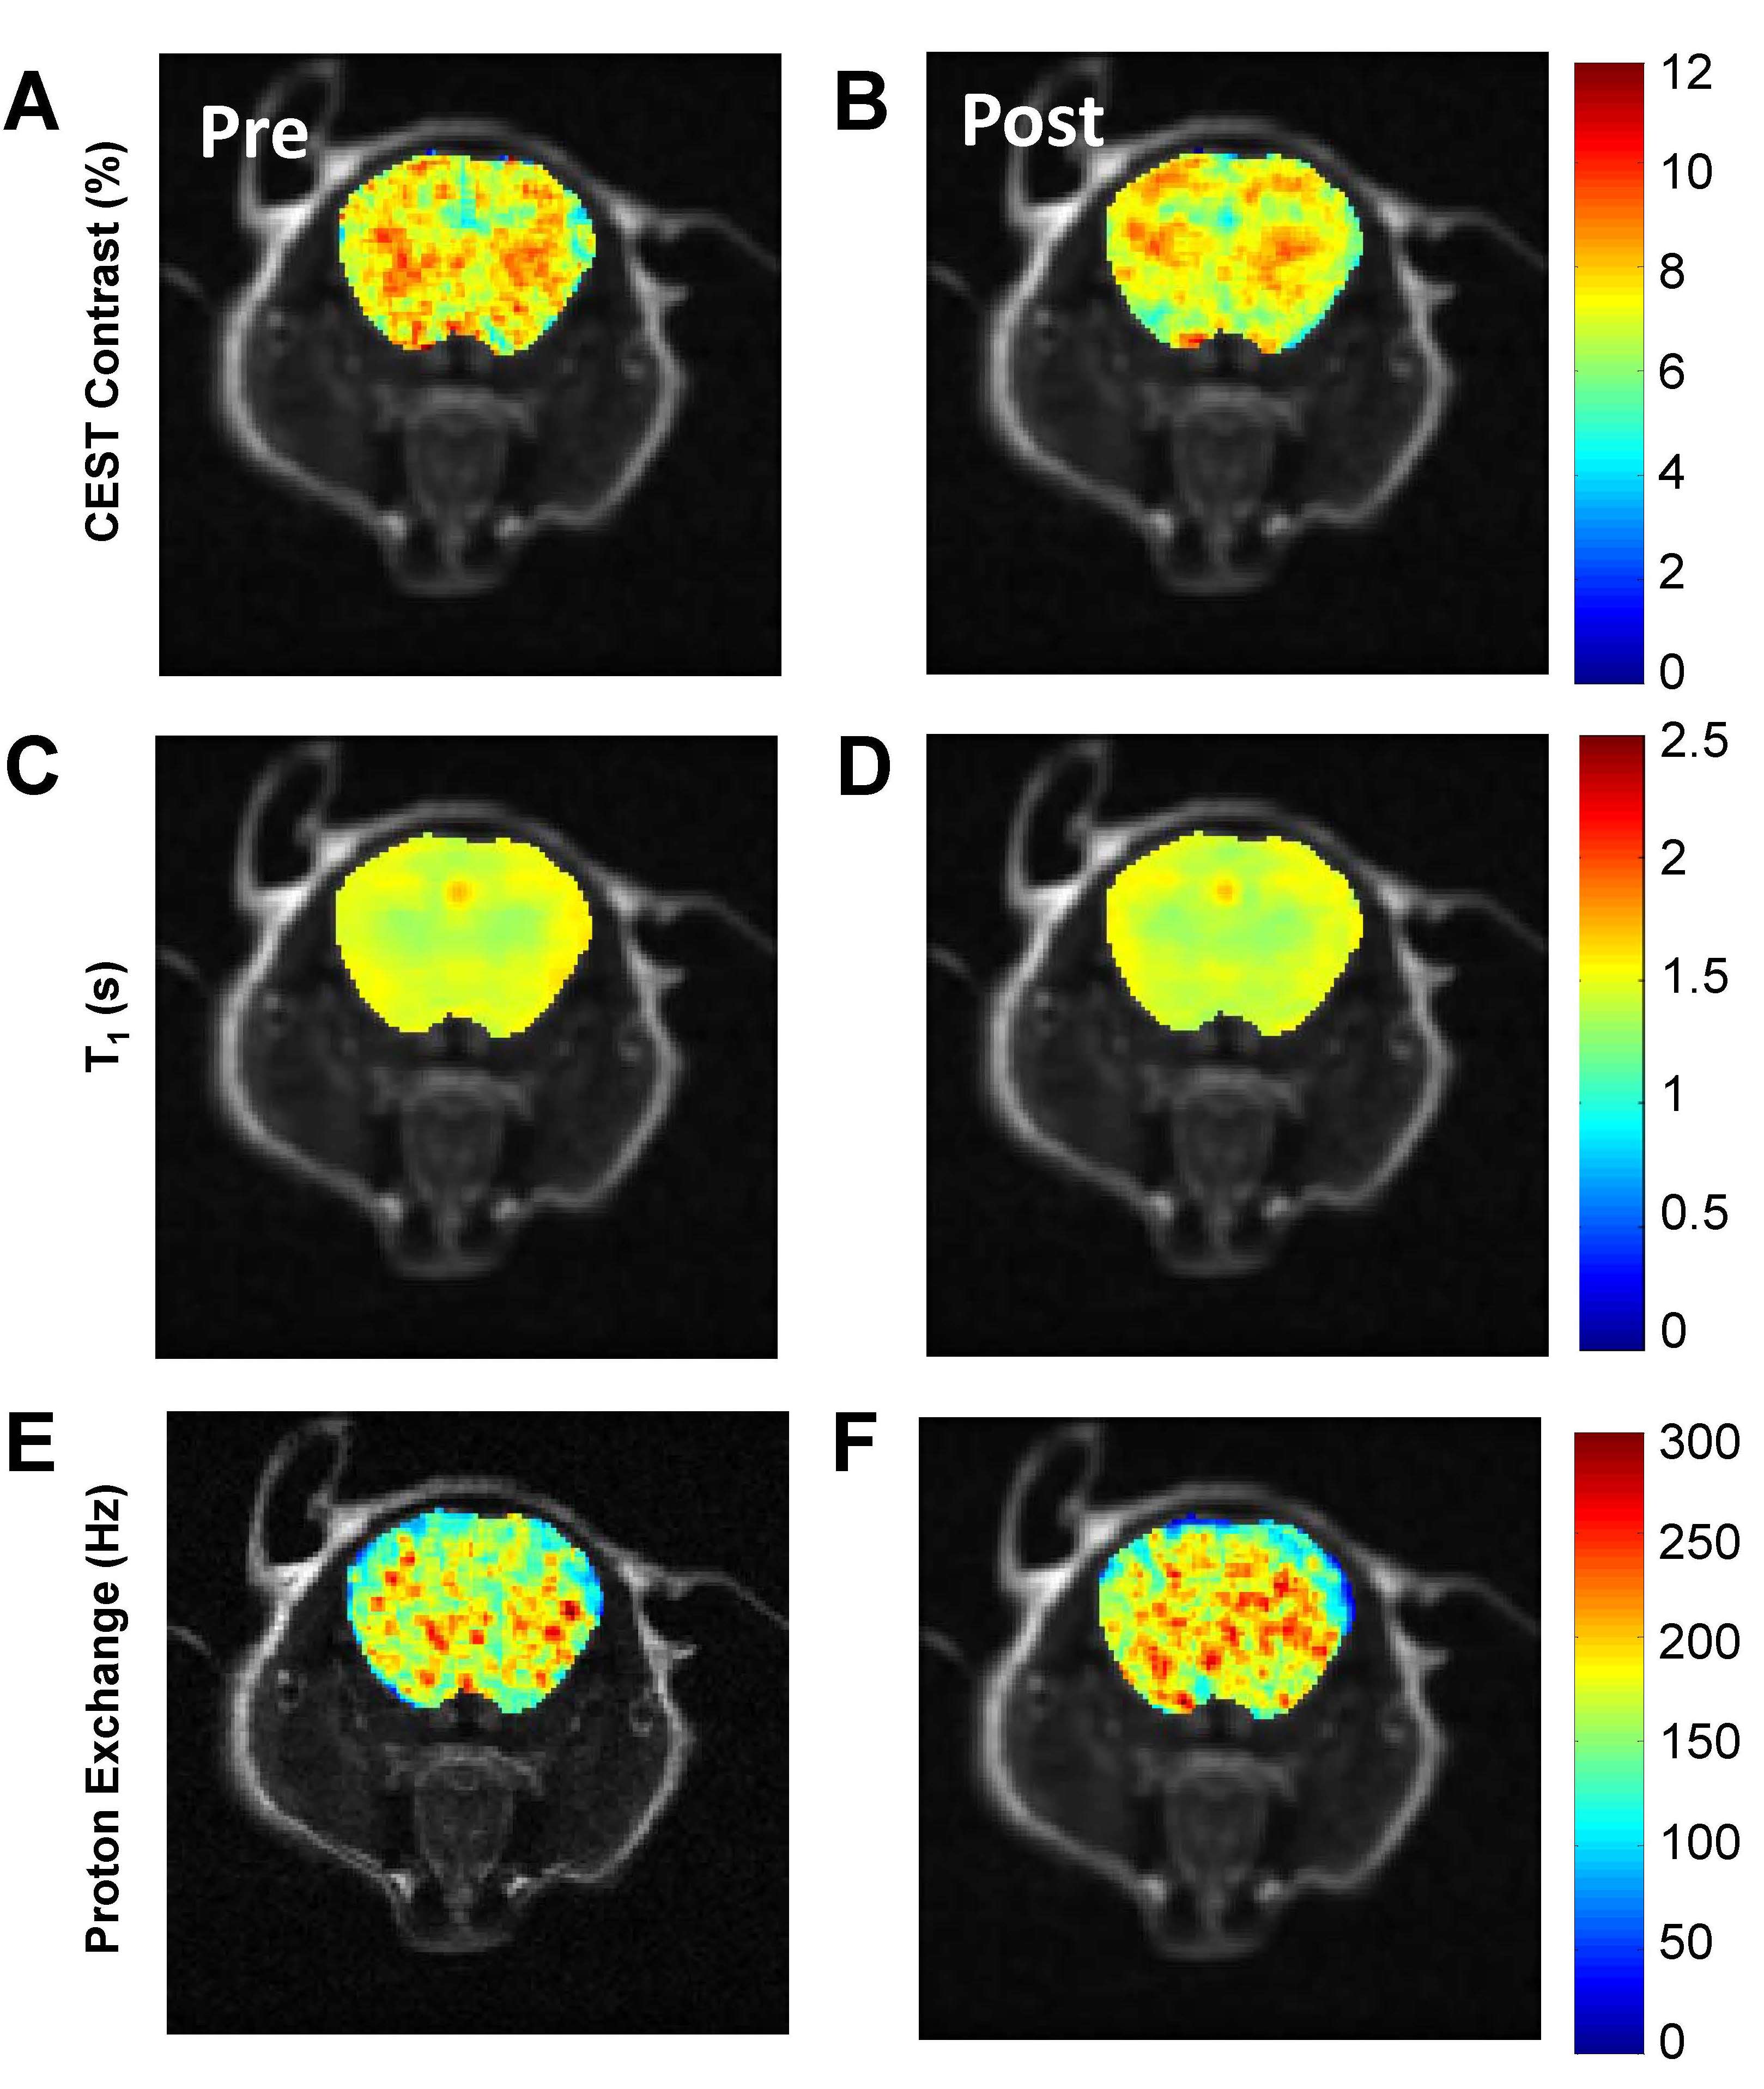
Results from the rotenone study are consistent to the wound study and the previous ex vivo studies4 in showing distinct changes in brain Z-spectra, resulting in reductions in CEST contrast (p<0.05) (Figure 2 A, B). The CEST reduction origins from the reduced T1 relaxation time and the increased proton exchange (Figure 2 C, D). In comparison, control mice show no changes in MRI contrasts (Figure 2 E-H). Finally, measurements of GSH/GSSG ratio revealed a significant reduction of the ratio in rotenone treated mice compared to controls (p<0.05) (Figure 2 I). The reduced GSH/GSSG ratio confirmed the overproduction of ROS due to rotenone. This further validates that changes in CEST, T1 relaxation, and proton exchange serves as imaging markers of ROS production. Figure 3 shows representative CEST contrast, T1, and proton exchange rate maps of brain before and after rotenone treatment.
T1-shortening effects from ROS partially contribute to the reduction of CEST contrast. Even though CEST and T1 influence each other, they rely on different contrast mechanisms. Thus, correcting CEST contrast with T1 relaxation time may diminish the true CEST contrast changes due to ROS and therefore may not be necessary in this study.
Conclusion
In summary, the observed changes in T1, CEST, and exchange rate were consistent between the in vivo mice experiments and the previous ex vivo study, supporting that ROS reduces endogenous CEST contrast through its T1-shortening and exchange-rate promoting effects. For the first time, in vivo detection of ROS by endogenous CEST MRI was demonstrated. These preclinical studies paved a clear path for clinical translations of the endogenous ROS MRI.Acknowledgements
No acknowledgement found.References
1. Cook JA, Gius D, Wink DA, et al. Oxidative stress, redox, and the tumor microenvironment. Seminars in Radiation Oncology 2004;14(3):259-266.
2. Barnham KJ, Masters CL, Bush AI. Neurodegenerative diseases and oxidative stress. Nat Rev Drug Discov 2004;3(3):205-214.
3. Allen RG, Tresini M. Oxidative stress and gene regulation. Free Radical Biology and Medicine 2000;28(3):463-499.
4. Tain R-W, Li W, Valyi-Nagy T, et al. Oxidative Stress Sensitive Magnetization Transfer. Proceedings 23rd International Conference of the ISMRM. Toronto, Canada; 2015.
5. Tain R-W, Scotti A, Li W, et al. Imaging Oxidative Stress Using CEST MRI. Proceedings Symposium on Chemical Exchange Saturation Transfer. Philadelphia, PA; 2015.
6. Tain R-W, Scotti A, Li W, et al. Imaging Reactive Oxygen Species (ROS) using CEST MRI. Proceedings 24th International Conference of the ISMRM. Suntec City, Singapore; 2016.
7. Ricci JE, Waterhouse N, Green DR. Mitochondrial functions during cell death, a complex (I-V) dilemma. Cell Death Differ 2003;10(5):488-492.
8. Pan-Montojo F, Anichtchik O, Dening Y, et al. Progression of Parkinson's Disease Pathology Is Reproduced by Intragastric Administration of Rotenone in Mice. PLoS ONE 2010;5(1):e8762.
9. Woessner DE, Zhang S, Merritt ME, et al. Numerical solution of the Bloch equations provides insights into the optimum design of PARACEST agents for MRI. Magnetic Resonance in Medicine 2005;53(4):790-799.
10. Cao L, Li L, Zuo Z. N-acetylcysteine reverses existing cognitive impairment and increased oxidative stress in glutamate transporter type 3 deficient mice. Neuroscience 2012;220:85-89.
Figures