3739
Investigation into the origin of the APT MRI signal in ischemic stroke1Oxford Institute for Radiation Oncology, Department of Oncology, University of Oxford, Oxford, United Kingdom, 2Acute Stroke Programme and Acute Vascular Imaging Centre, Radcliffe Department of Medicine, University of Oxford, Oxford, United Kingdom, 3School of Medicine, Faculty of Health, University of Tasmania, Hobart, Australia, 4Physical and Theoretical Chemistry Laboratory, Department of Chemistry, University of Oxford, Oxford, United Kingdom, 5Oxford Centre for Functional MRI of the Brain, Nuffield Department of Clinical Neurosciences, University of Oxford, Oxford, United Kingdom, 6Institute of Biomedical Engineering, Department of Engineering Science, University of Oxford, Oxford, United Kingdom
Synopsis
Studies employing CEST MRI to study ischemic stroke focus on the sensitivity of amide proton transfer (APT) MRI signals to tissue pH, assuming identical intracellular protein concentration as healthy tissue. This study shows that whilst cytoplasmic protein concentration remains stable in penumbral stroke regions, it decreases in the infarct core. By analysing APT MRI data with APTR*, which is specifically sensitive to amide proton exchange effects, we demonstrate that the APT signal change in infarct core is dominated by decreased protein concentration, whilst penumbral APT changes can be attributed to decreased tissue pH.
Introduction
Studies in both animals and humans show that APT MRI identifies the ischemic penumbra following stroke1,2. These studies focus on the sensitivity of CEST MRI to the exchange rate of amide protons in mobile proteins. Since this exchange rate is base-catalysed, it is assumed that the signal changes are caused by altered tissue pH, and other factors that contribute to the signal (e.g. amide concentration) remain unchanged. Here, we investigate the possibility of concurrent amide proton concentration changes in stroke, and determine the relative contributions of pH and amide proton concentration changes to the CEST MRI signal.Methods
Focal ischemia was induced in six male Wistar rats by occlusion of the middle cerebral artery (MCAO). MRI was performed using a 9.4T spectrometer (Agilent) with 72mm volume transmit and 4-channel surface receive array coils (Rapid Biomedical). T1 and T2 maps were obtained using inversion recovery (TR=10s, TE=8.22ms, inversion time (TI) 13.14ms-8s) and spin echo (TR=10s, TE=30ms-160ms in 10 steps) experiments, respectively. CBF was measured using multi-phase pseudo-continuous arterial spin labelling (pCASL, 8 phases between 0° and 315°, tag thickness 6.2mm, post-label delay 550 ms), and ADC was measured from DWI in three directions with b=0s/mm2 and b=1000s/mm2.
CEST MRI data were acquired using the method of a recent clinical study2 at 51 offset frequencies following 2s saturation (20ms Gaussian pulse with flip angle 184° + 20ms crusher gradient, repeated 50 times; equivalent CW B1=0.55µT) with single-shot spin-echo EPI readout. Imaging was performed at 1h and 2h post-MCAO.
After imaging, tissue samples of infarct core, ischemic penumbra, and contralateral brain were obtained using guidance from ADC and CBF maps. The cytoplasmic fraction of the tissue was isolated using the ThermoFisher Subcellular Fraction of Tissue Extracts Kit, and the cytoplasmic protein concentration quantified using a BCA assay.
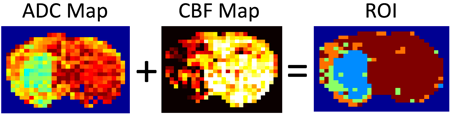
CEST MRI data were analysed used the APTR* metric with voxel-wise correction for T1 and T2 relaxation times, ensuring APTR* values were sensitive only to amide proton exchange effects3 (pH and amide proton concentration). Regions of interest comprising the infarct core, infarct growth, benign oligemia and normal tissue were defined automatically based on tissue CBF and ADC values as described previously2 (Fig 1). Relative APTR* (rAPTR*) was calculated for each ROI by normalising APTR* to the normal tissue. The weighted mean and standard deviation of rAPTR* in each ROI was computed from all six animals. rAPTR* values from each ROI were compared using a one-way ANOVA with Tukey’s multiple comparison post-hoc test.
Results
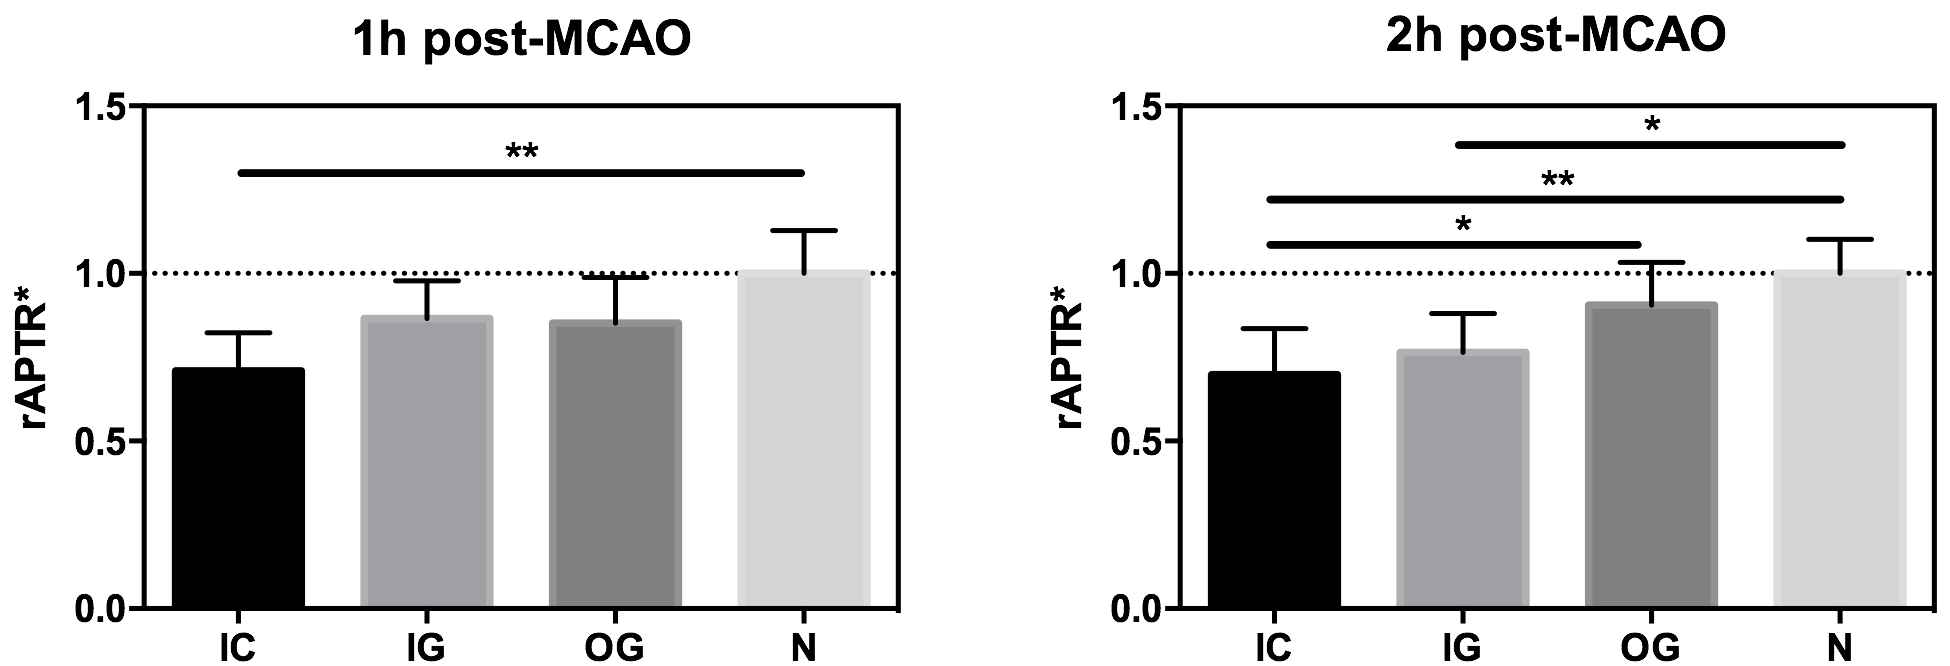
At 1h post-MCAO, rAPTR* is significantly different from the normal tissue in the infarct core (P<0.01, Fig 2). At 2h post-MCAO this difference is still evident (P<0.01), with additional significant differences between the IC and oligemic tissue, and between areas of infarct growth and normal tissue (both P<0.05, Fig 2).
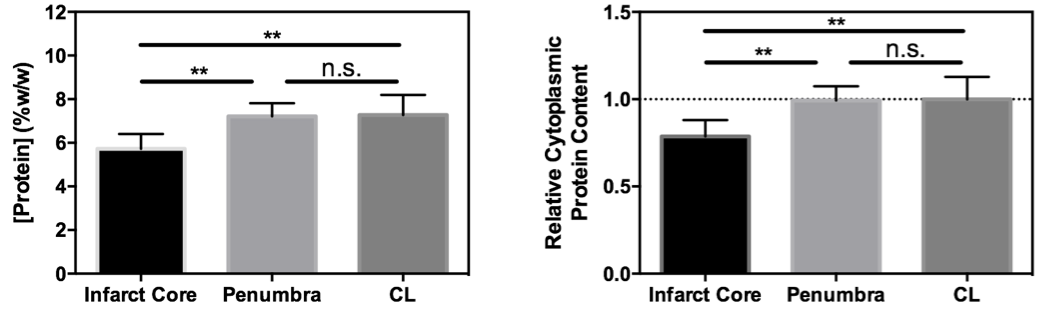
A significant difference in cytoplasmic protein concentration between infarct core and both penumbral and contralateral tissue was measured (Fig 3). No difference in cytoplasmic protein content between penumbral (corresponding to the infarct growth MRI ROI) and contralateral tissue was evident.
Discussion
These results are consistent with measurements made in a recent clinical study2. The decreased rAPTR* in infarct core tissue in that study was attributed to rapid acidification of this tissue. However, independent biochemical measurement of cytoplasmic protein concentration indicates that the amide proton concentration may also be changing in the infarct core, implying that the measured decrease in rAPTR* in the infarct core may reflect concurrent decreases in tissue pH and mobile protein concentration. The decrease in mobile protein content in the infarct core is likely a result of rapid tissue necrosis and associated proteolytic activity4.
In contrast, cytoplasmic protein concentration within the ischemic penumbra remained unchanged compared to the contralateral hemisphere, whilst the rAPTR* was significantly decreased in the corresponding infarct growth ROI. These findings suggest that decreased tissue pH is the predominant source of the decreased rAPTR* in infarct growth tissue.
Cytoplasmic proteins are unlikely to be the only proteins sufficiently mobile to be interrogated by CEST MRI, but these methods have been employed previously in preclinical tumour models to elucidate the source of CEST signals5.
Conclusion
These data indicate that a decrease in cytoplasmic protein concentration occurs acutely in the infarct core of stroke lesions. Whilst reduced rAPTR* in penumbral tissue appeared to be predominantly due to pH effects, within the infarct core the rAPTR* is likely to result from changes in both pH and cytoplasmic protein concentration. These results demonstrate the importance of understanding the biophysical origins of the APT signal before it can be used as a pH quantification technique.Acknowledgements
This work was funded by Cancer Research UK (grant number C5255/A15935), the CRUK & EPSRC Cancer Imaging Centre in Oxford (grant number C5255/A16466), and the University of Oxford Wellcome Trust Institutional Strategic Support Funding. K.J.R. was funded by a Medical Research Council studentship (MC_ST_U13080) and supplementary award (MR/K501256/1).References
1. Sun, P. Z., Zhou, J., Sun, W., Huang, J. & van Zijl, P. C. M. Detection of the ischemic penumbra using pH-weighted MRI. J. Cereb. Blood Flow Metab. 27, 1129–36 (2007).
2. Harston, G. W. J. et al. Identifying the ischaemic penumbra using pH-weighted magnetic resonance imaging. Brain 138, 36–42 (2015).
3. Ray, K. J. et al. Determination of an optimally sensitive and specific chemical exchange saturation transfer MRI quantification metric in relevant biological phantoms. NMR Biomed. 29, 1624-1633 (2016).
4. Sutherland, B. A. et al. Neuroprotection for ischaemic stroke: Translation from the bench to the bedside. Int. J. Stroke 7, 407–418 (2012).
5. Yan, K. et al. Assessing Amide Proton Transfer (APT) MRI Contrast Origins in 9 L Gliosarcoma in the Rat Brain Using Proteomic Analysis. Mol. Imaging Biol. 17, 479–87 (2015).
Figures