3738
Modification of tumour hypoxia with Atovaquone measured by CEST MRI1Oxford Institute for Radiation Oncology, Department of Oncology, University of Oxford, Oxford, United Kingdom, 2Institute of Biomedical Engineering, Department of Engineering Science, University of Oxford, Oxford, United Kingdom
Synopsis
Tumours often have areas of hypoxia, which renders cancer cells resistant to many therapies. Recently the anti-malarial drug Atovaquone has been shown to modify the oxygen consumption rate of cancer cells, reducing tumour hypoxia. Non-invasive mapping of tumour hypoxia would be particularly useful for translation of these preclinical findings into a clinical environment. Here, we tested the hypothesis that CEST MRI could be used to visualise changes in tumour hypoxia.
Introduction
Tumours frequently exhibit hypoxic areas, which renders cancer cells resistant to many therapies. Recently the anti-malarial drug Atovaquone has been shown to modify the oxygen consumption rate of cancer cells, reducing tumour hypoxia as measured by examining histological sections1. However, non-invasive mapping of tumour hypoxia, and the effect of Atovaquone, would be particularly useful for translation of these preclinical findings into a clinical environment. CEST MRI has been shown to be sensitive, at least partially, to intracellular tumour pH2, which is intrinsically linked to tissue oxygenation status. The aim of this study, therefore, was to determine whether CEST MRI could be used to identify changes in tumour oxygenation following Atovaquone treatment.Methods
Tumours were induced by injection of 1x10⁶ FaDu cells subcutaneously into the flank of BALB/c nude female mice (n=21). Once tumours reached 100mm3, animals were randomly split into Atovaquone-treated (n=10) or control (n=11) groups. Atovaquone was administered in drinking water (50mg/kg/day) with 2% DMSO and 0.1% carboxymethylcellulose. Control animals were treated with DMSO and carboxymethylcellulose only. After 7 days of treatment, MRI was performed on each mouse with a 9.4 T spectrometer (Agilent) and 26mm diameter volume transmit-receive coil (Rapid Biomedical). Mice were anaesthetised with 2% isoflurane in a 30:70 mixture of oxygen:nitrogen, maintaining a respiration rate of 60 breaths/min. Rectal temperature was maintained at 37°C throughout imaging.
CEST MRI was performed using a multi-slice gradient echo SPLICER sequence with respiration-gating and reacquisition (TR=195ms, TE=1.4ms)3. Z-spectra were acquired using a CEST pulse flip angle 180°, CEST pulse duration 20ms, and 37 frequency offsets. Immediately following CEST MRI, mice were euthanised and repositioned for non-respiration-gated T1 and T2 mapping using inversion recovery (TR=10s, 9xTI; 13ms-8s) and multiple echo time (10xTE; 30-160ms) methods, respectively, with echo planar readout.
Subsequently, tumours were carefully excised. The cytoplasmic protein concentration of each tumour was measured by isolating the cytoplasmic fraction using the ThermoFischer Subcellular Fractionation of Tissue Extracts Kit as per the manufacturer’s instructions, and the protein concentration of this fraction measured by BCA assay (Pierce).
CEST MRI data were analysed voxelwise using the APTR* metric with correction for T1 and T2 time, yielding APTR* values sensitive only to amide proton exchange effects (reflecting intracellular tissue pH [pHi]), as described previously4. APTR* measurements for each voxel across all animals were combined and a histogram analysis performed to determine the difference in APTR* between the two groups, as measured by a Kolmogorov-Smirnov test.
Results
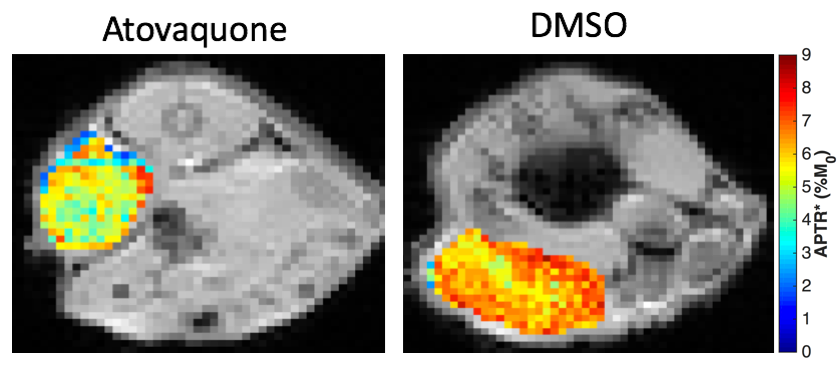
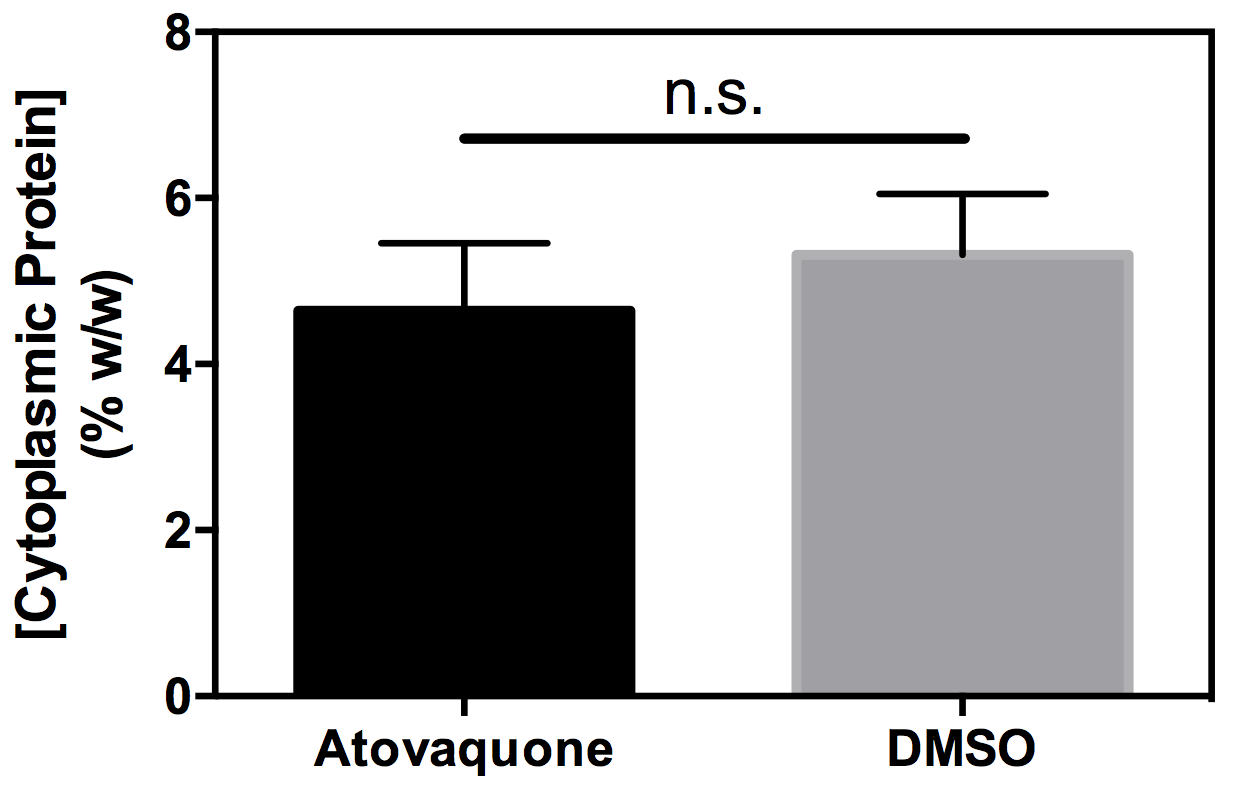
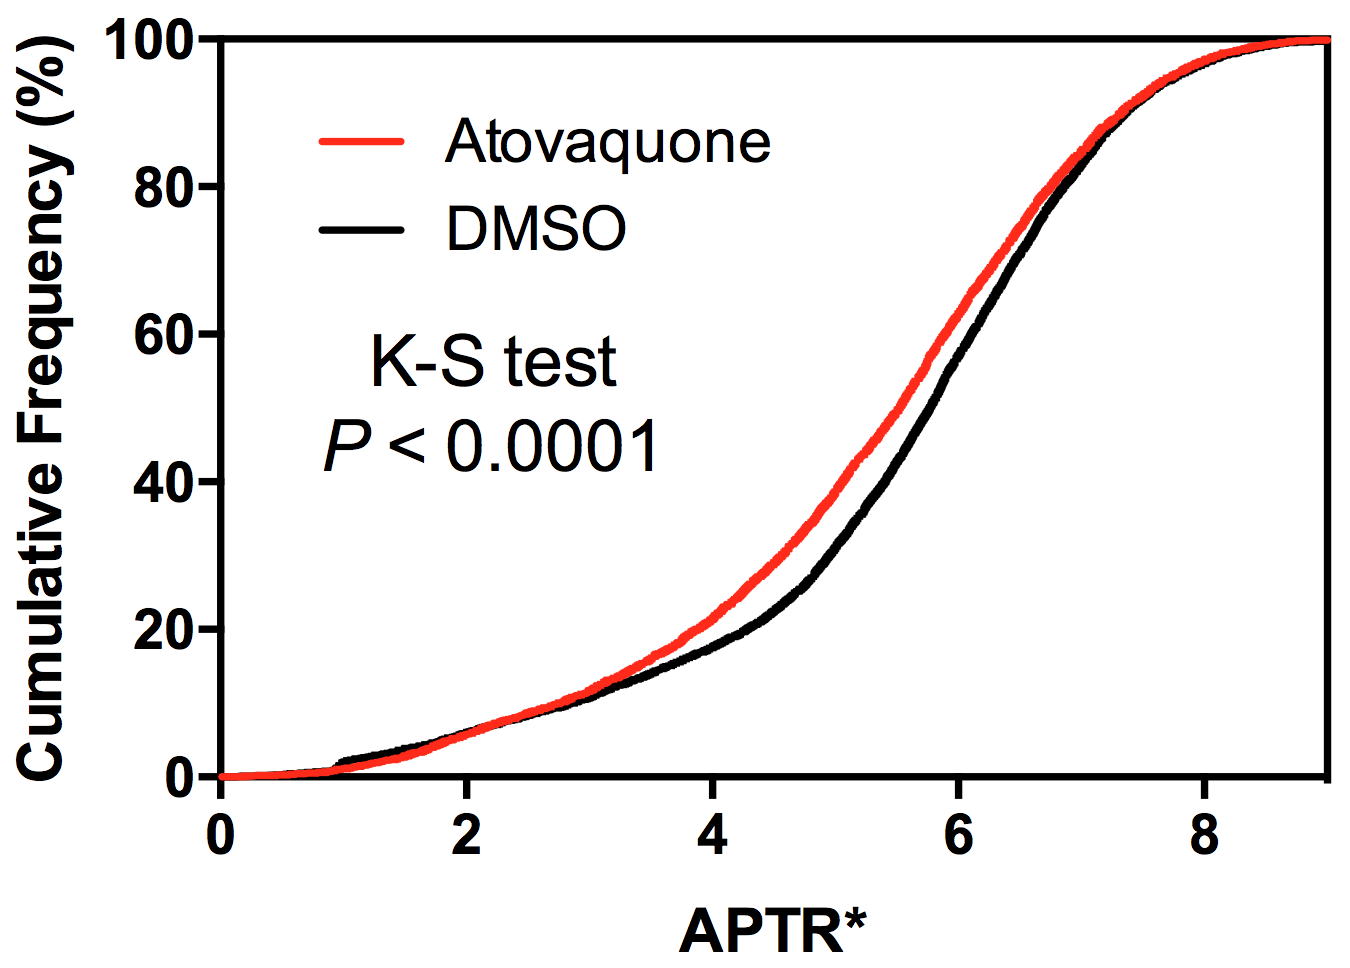
Representative images for APTR* from Atovaquone-treated and DMSO-treated control animals show lower APTR* values in Atovaquone-treated animals (Fig 1), suggesting that higher APTR* values correspond to areas of tumour hypoxia. Comparison of the cytoplasmic protein concentrations of Atovaquone-treated and DMSO-treated animals showed no statistically significant difference (Fig 2). Cumulative frequency histograms of the APTR* values across all animals demonstrate significant Atovaquone-induced changes in APTR* (Fig 3).Discussion
This study represents the first time that CEST MRI has been used to non-invasively image hypoxia in tumours. The independent measurement of no statistically significant difference in cytoplasmic protein concentration between tumours in animals treated with Atovaquone and DMSO suggests that the measured difference in APTR* is driven by a difference in tumour cell pHi.
Hypoxia is a precursor to the metabolic shift towards glycolysis seen in tumours, which alters pHi in these areas and alters the expression of many pH-regulating proteins (e.g. Carbonic Anhydrase IX). In particular, pHi typically shows a shift towards a more alkaline pH in tumour cells than normal tissue, whilst extracellular pH becomes more acidic. The lower APTR* measurement in Atovaquone-treated tumours suggests that the intracellular pH of Atovaquone-treated tumours is lower than the non-treated tumours. This observation may indicate that pHi is better regulated in Atovaquone-treated tumours as a result of reduced hypoxia and, consequently, returns to a normal value.
Conclusion
CEST MRI can non-invasively image the effect of the oxygenation-modifying agent Atovaquone on tumour hypoxia.Acknowledgements
This work was funded by Cancer Research UK (grant numbers C5255/A15935, C34326/A13092, C5255/A12678), the CRUK & EPSRC Cancer Imaging Centre in Oxford (grant number C5255/A16466), the Engineering and Physical Sciences Research Council (EPSRC grant C2522/A10339) and the Medical Research Council Unit Grant for the Oxford Institute for Radiation Oncology. K.J.R. was funded by a Medical Research Council studentship (MC_ST_U13080) and supplementary award (MR/K501256/1).
References
1. Ashton, T. M. et al. The anti-malarial atovaquone increases radiosensitivity by alleviating tumour hypoxia. Nat. Commun. 7, 12308 (2016).
2. McVicar, N., Li, A. X., Meakin, S. O. & Bartha, R. Imaging chemical exchange saturation transfer (CEST) effects following tumor-selective acidification using lonidamine. NMR Biomed. 28, 566–575 (2015).
3. Kinchesh, P. et. al. Dynamic Reacquisition for Respiratory Gated, Constant TR 2D multi-slice MRI. Proc. Intl. Soc. Magn. Reson. Med. 23 #2574 (2015).
4. Ray, K. J. et al. Determination of an optimally sensitive and specific chemical exchange saturation transfer MRI quantification metric in relevant biological phantoms. NMR Biomed. 29, 1624–1633 (2016).
Figures