3737
Magnetization Transfer MRI Noninvasively Detects Renal Fibrosis Swine Atherosclerotic Renal Artery Stenosis at 3.0 T1Division of Nephrology and Hypertension, Mayo Clinic, Rochester, MN, United States, 2Department of Radiology, Mayo Clinic, Rochester, MN, United States
Synopsis
In this study, we tested the capability of magnetization transfer (MT) imaging for measuring renal fibrosis in a swine model of atherosclerotic renal artery stenosis (ARAS) at 3.0 T. A collagen phantom study was performed to select appropriate offset frequencies of MT pulses for collagen detection. In an in vivo study, the MT ratio (MTR) and percent change in MTR between two offset frequencies were quantified, and both showed a good correlation with renal fibrosis measured ex vivo by Picro-Sirius red staining, supporting the use of MT to assess renal fibrosis in swine ARAS.
Introduction
Atherosclerotic renal artery stenosis (ARAS) decreases renal blood flow and may cause renal fibrosis1, the end stage outcome of most renal diseases. Renal fibrosis is widely used as a biomarker for diagnosis and evaluation of therapeutic interventions of renal diseases, but often requires invasive methods to determine. We have previously shown that magnetization transfer (MT)-MRI, which evaluates the presence of macromolecules, offers a noninvasive tool to probe renal fibrosis in murine RAS at 16.4 T2. In this study, we hypothesized that MT-MRI can detect renal fibrosis in a swine model of ARAS at 3.0 T.Methods
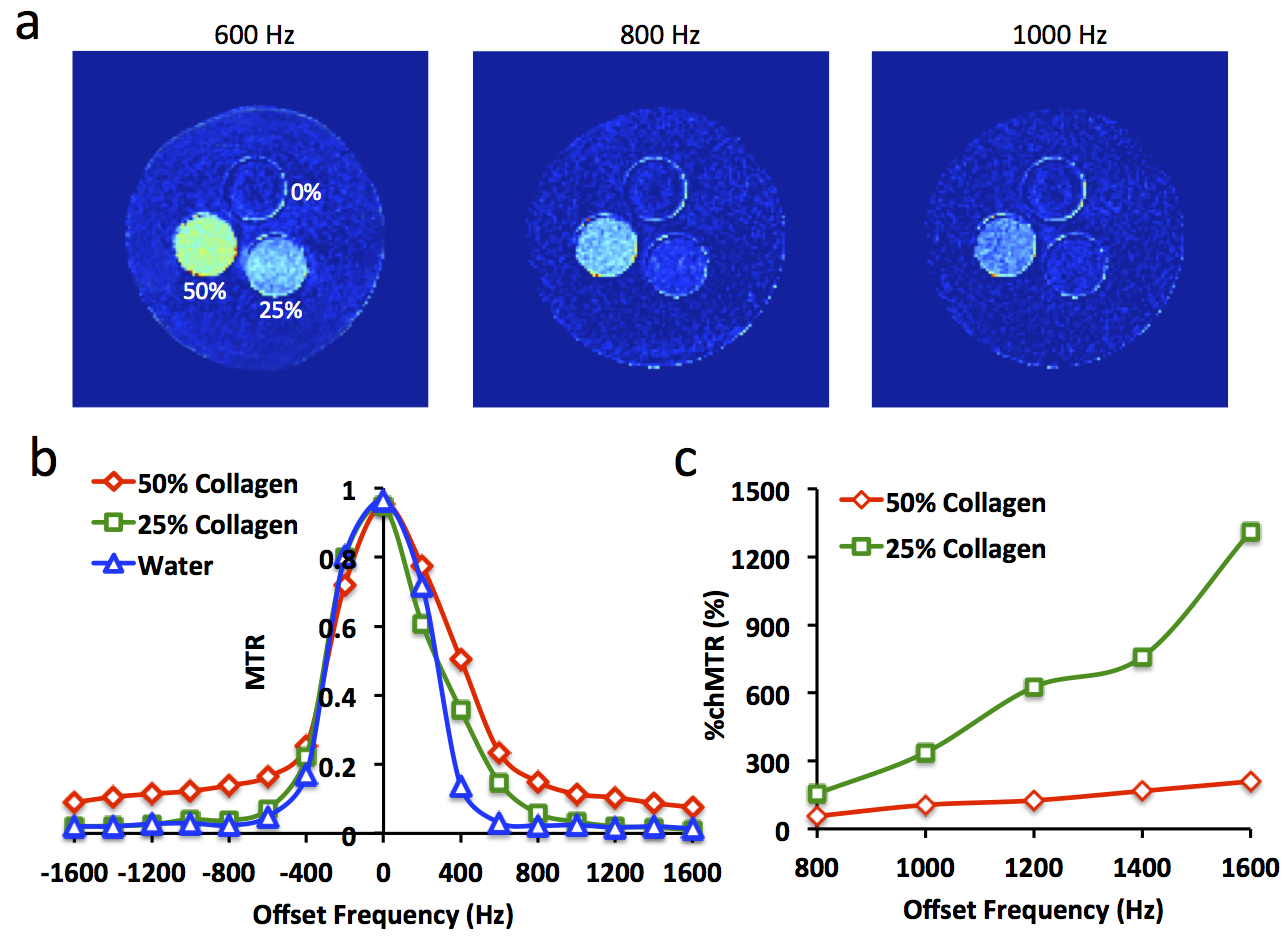
Phantom Study. MRI studies were performed on a GE Signa HDxt 3.0 T scanner using an MT-prepared gradient echo sequence. To select the appropriate offset frequency, an MT-MRI study was initially performed on a phantom containing collagen I&III at 50%, 25%, and 0%. Images without MT preparation (M0) were first acquired with the following parameters: TR 300 ms; TE 3.4 ms; flip angle 30°; slice thickness 4 mm; slice number 5; FOV 15×15 cm2; matrix size 128×128; number of averages 1. Then MT-weighed images (Mt) were acquired by adding Fermi pulses prior to image acquisition with the following parameters: offset frequency -1600 to 1600 Hz with an increment step of 200 Hz; pulse width 16 ms; flip angle 800°. Magnetization transfer ratio (MTR) was calculated as: (M0 -Mt)/M0. The percentage change in MTR (%chMTR) between different offset frequencies was also calculated.
Animal Study. This study in 13 domestic female pigs was approved by the Institutional Animal Care and Use Committee. The control pigs (n=6) underwent a sham procedure and then fed with standard diet for 10 weeks. Unilateral RAS was induced in the 7 other pigs by placing a local irritant coil in the right renal artery. These pigs were also fed with a high-cholesterol diet to induce atherosclerosis (ARAS) and thereby aggravate fibrosis. The MT study performed 10 weeks after surgery used the same sequence as the phantom study. Coronal images of the kidney were acquired with the following imaging parameters: offset frequency 600 and 1000 Hz; slice thickness 2.6 mm; slice number 5; FOV 35×35 cm2; matrix size 192×128, reconstructed to 256×256. All other imaging parameters were the same as in the phantom study. Renal MTR was normalized by ipsilateral psoas major muscle MTR to correct for B1 inhomogeneity. Cortical and medullary MTRs were calculated using regions of interest manually selected on T2*-weighted anatomical images of the same slices, which show a good contrast between cortex and medulla. In addition, %chMTR from 1000 to 600 Hz was calculated.
All pigs were euthanized after MRI with kidneys harvested and fixed. Picro-Sirius red staining was performed on 5-μm axial slices of tissue. Fibrosis was quantified as the fraction of fibrotic area over the total cross sectional area of the tissue using AxioVision (Carl Zeiss SMT, Oberkochen, Germany).
Results
Phantom Study. Representative MTR maps at 600, 800, and 1000 Hz are shown in Fig. 1a, and MTRs obtained at different offset frequencies in Fig. 1b. The 50% collagen phantom showed larger MTRs (Fig. 1b) but smaller %chMTRs (Fig. 1c) than the 25% collagen. To achieve high MT sensitivity with little free water saturation, offset frequencies at 600 and 1000 Hz were chosen for in vivo studies.
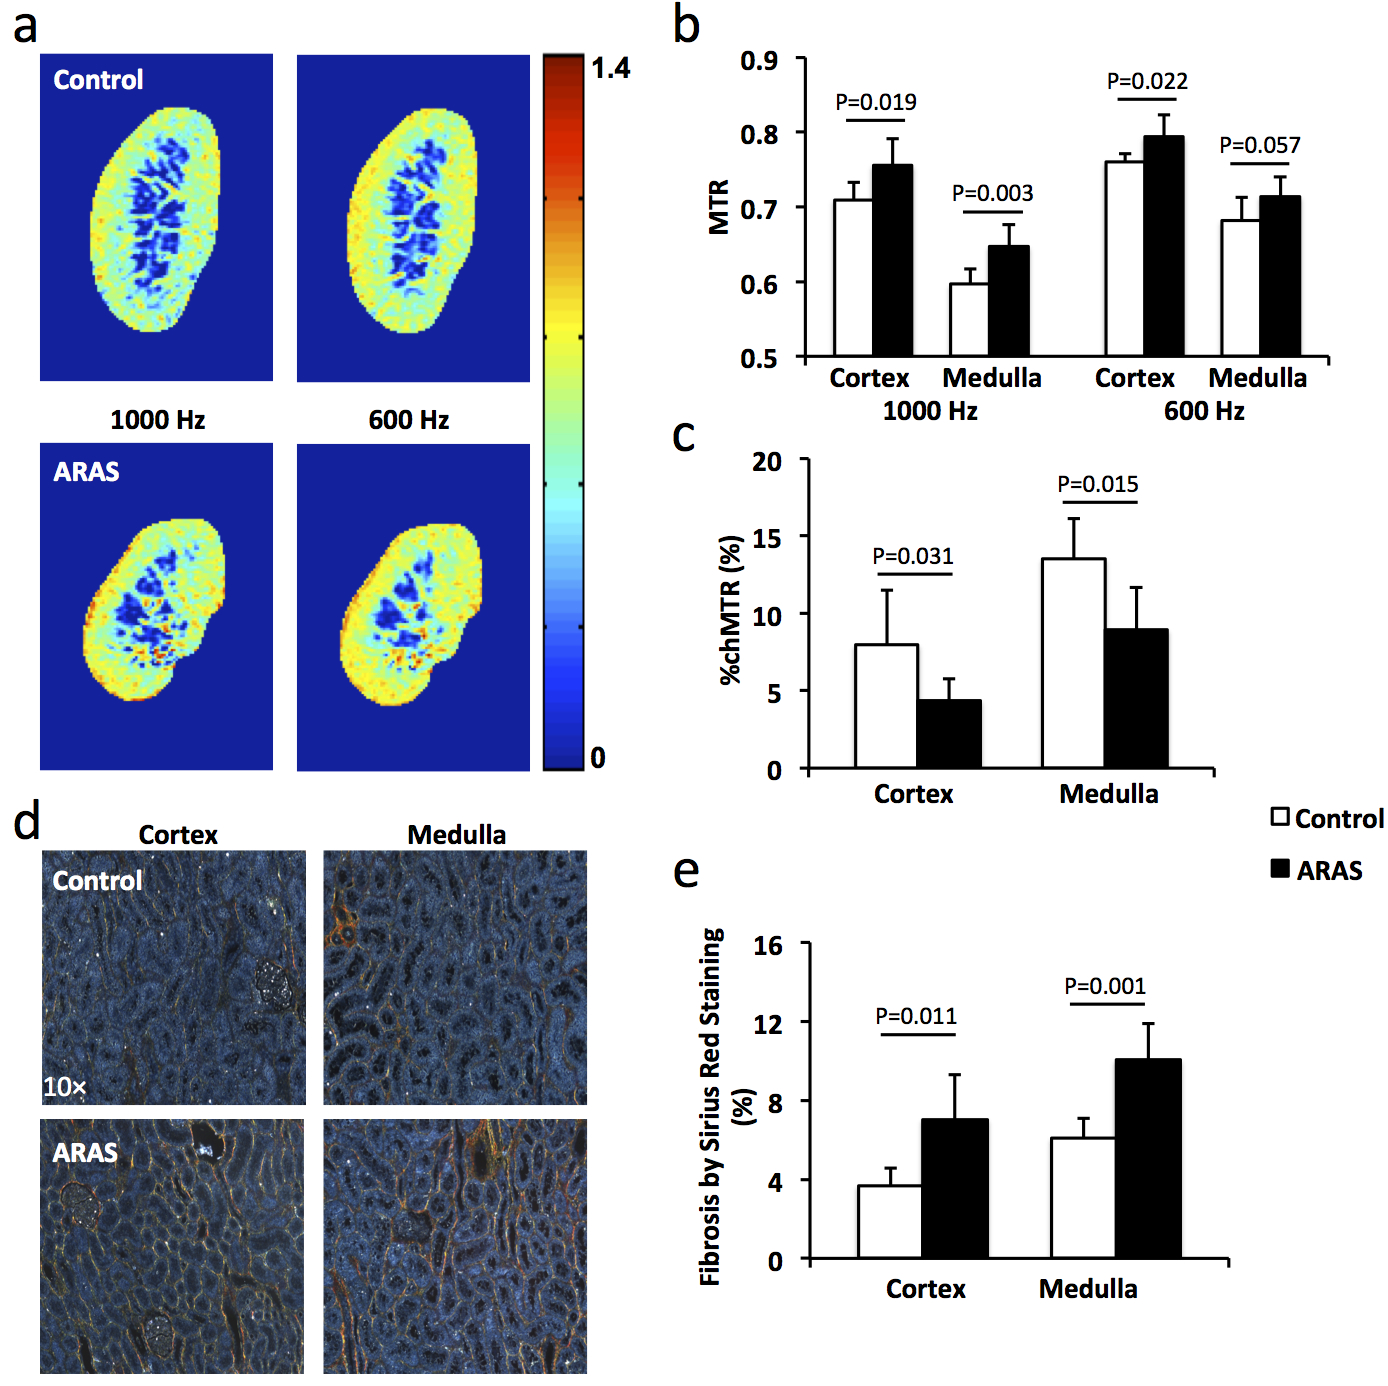
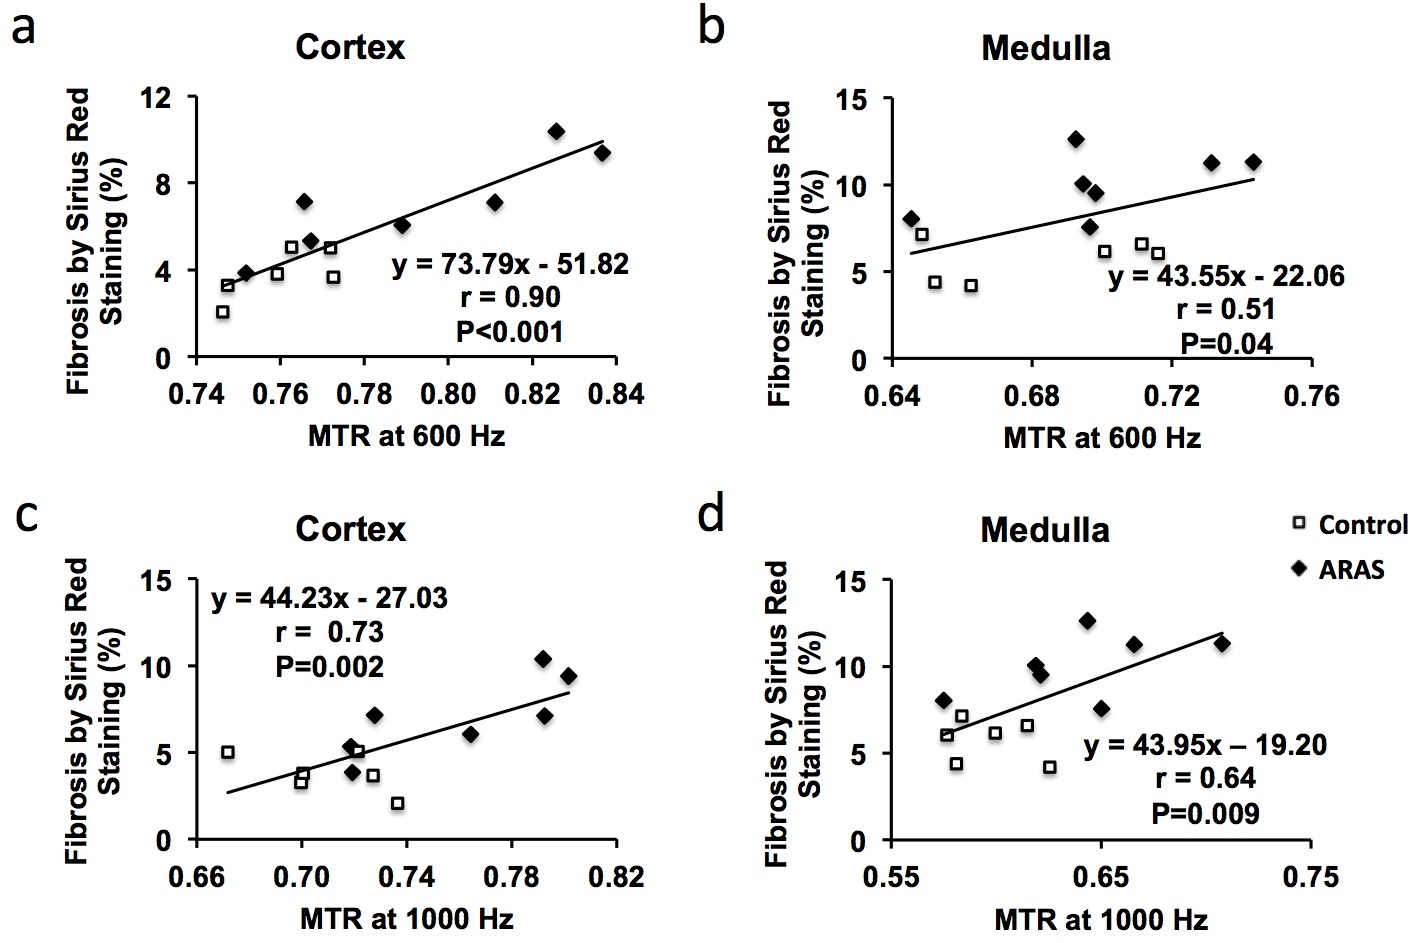
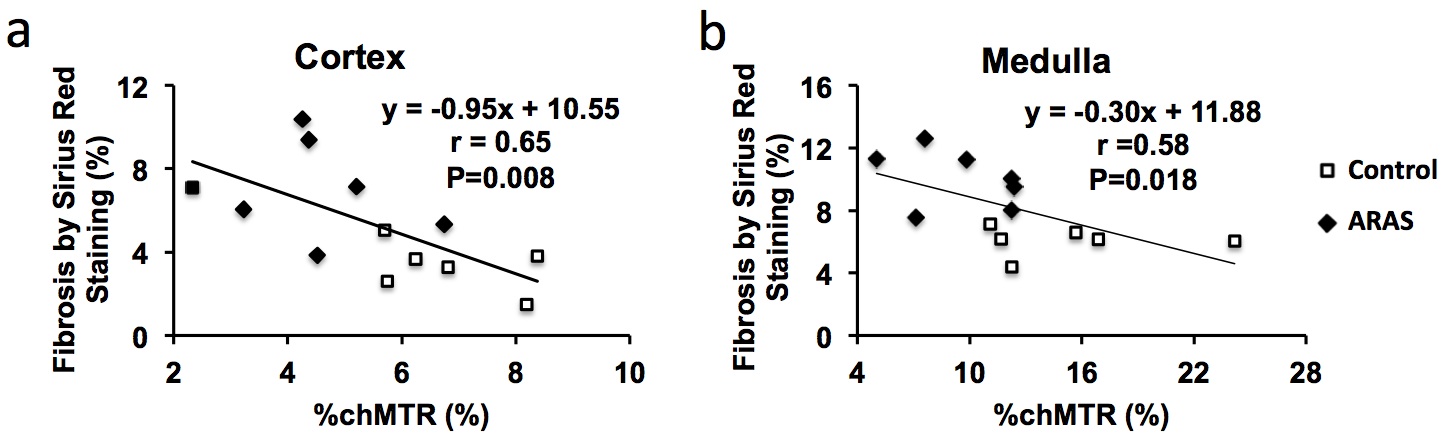
Animal Study. Representative MTR maps of the control and ARAS kidneys at 1000 and 600 Hz are shown in Fig. 2a. The cortical and medullary MTRs at 1000 Hz were both increased in the stenotic ARAS kidney. At 600 Hz, a slight increase in cortical MTR and a trend of increase in medullary MTR was observed (Fig. 2b). Therefore, MT at 1000 Hz better differentiated normal and stenotic ARAS kidneys. In contrast, the %chMTR from 1000 to 600 Hz were significantly decreased in both cortex and medulla of the ARAS kidney compared to sham (Fig. 2c). Compared to MTR, %chMTR showed a larger magnitude of difference between control and ARAS kidneys. ARAS kidneys showed more fibrosis than controls (Fig. 2d&e). MTR at 600 (Fig. 3a&b) and 1000 (Fig. 3c&d) Hz and %chMTR (Fig. 4) all showed good correlations with ex vivo fibrosis by Sirius red staining.
Conclusion
This study suggests that MT MRI detects renal fibrosis in a swine model of atherosclerotic renal artery stenosis at 3.0 T, and that %chMTR may increase its dynamic range. Therefore, MTI may be useful for noninvasive detection of renal pathology and evaluation of therapeutic interventions in subjects with RAS.Acknowledgements
None.References
1. Conway B, Hughes J. Cellular orchestrators of renal fibrosis. QJM. 2012;105(7):611–5.
2. Jiang K, Ferguson CM, Ebrahimi B et al. Noninvasive Assessment of Renal Fibrosis with Magnetization Transfer MR Imaging: Validation and Evaluation in Murine Renal Artery Stenosis. Radiology, 2016, Ahead of Print, 10.1148/radiol.2016160566
Figures