3736
In Vivo Tracking of Hyaluronic Acid Hydrogel Degradation Using Temporal Evolution of Chemical Exchange Saturation Transfer Signal in a Mouse Subcutaneous Injection ModelMohammed Salman Shazeeb1, Rubina Corazzini2, Dinesh Bangari3, Robert Fogle1, Jennifer Johnson3, Paul J. Konowicz2, Xiaoyou Ying1, and Pradeep K. Dhal2
1Bioimaging, Translational In Vivo Models, Sanofi, Framingham, MA, United States, 2Biomaterials, Sanofi, Framingham, MA, 3Pathology, Translational In Vivo Models, Sanofi, Framingham, MA
Synopsis
Hyaluronic acid (HA) hydrogels have a wide range of applications in biomedicine from regenerative medicine to drug delivery applications. In vivo quantitative assessment of these hydrogels using magnetic resonance imaging (MRI) provides a powerful technique to assess the biodegradability of HA hydrogels. This study investigated the potential of chemical exchange saturation transfer (CEST) MRI in tracking HA hydrogels with varying degradation profiles in vivo in a mouse subcutaneous injection model over 77 days. Since CEST-MRI provides a unique chemical signature to visualize HA hydrogels, this technique can be used as a guide in hydrogel optimization process for drug delivery applications.
Introduction
Biocompatibility and biodegradability of hyaluronic acid (HA) hydrogels make them suitable for a wide range of applications in biomedicine ranging from regenerative medicine to drug delivery applications. Use of HA hydrogels as drug delivery depots for chronic treatment requires modulated degradation rate, which can be achieved by chemical modification [1]. To assess in vivo residence time and degradation profiles of HA hydrogel depots quantitatively, magnetic resonance imaging (MRI) provides adequate resolution and soft tissue contrast without the need for additional probes or contrast agents. Chemical exchange saturation transfer (CEST) is a powerful MRI technique that provides a unique chemical signature to visualize the hydrogels in vivo [2,3]. In this study, we synthesized HA hydrogels using different types of reagents that can lead to hydrogels with varying degradation profiles. The fate of these hydrogels was assessed in vivo by CEST and T2-weighted (T2W) MRI in a mouse subcutaneous injection model. Furthermore, impact of these hydrogels on the implantation site was assessed from histopathological analysis of the surrounding tissues.Methods
HA hydrogels were synthesized by reacting soluble HA with different bifunctional reagents either via amide coupling (Fig. 1: structures 1 and 3) or via Michael reaction with divinyl sulfone (Fig. 1: structure 2). Female C57BL/6NTac mice (n =13) were injected with 100μl of four test articles [soluble HA, cystamine (disulfide containing cleavable crosslinker), divinyl sulfone (non-cleavable), and 1,6−diamino hexane (non-cleavable) crosslinked HA] in the subcutaneous space of their right and/or left hind flanks. The mice were serially imaged at least 7−9 times on a Biospec 7T-MRI scanner (Bruker, MA,USA) using a 72-mm volume coil (Bruker) over 77 days following hydrogel implantation. At each time-point, axial stacks of fat-suppressed T2W images were acquired using spin-echo pulse sequence (RARE: TR/TE=3300/33 ms, NEX=2) with 0.17×0.17×1.0 mm3 resolution and 10-15 slices to capture the entire hydrogel scaffold. Volumetric analysis was performed using Cheshire (V4.4.5, PAREXEL, MA, USA) and AMIRA V6.0.1 (FEI, OR, USA) to calculate the hydrogel volumes. CEST sequence was performed on a sub-selection of animals from each group with the following parameters: 1-mm slice thickness, FOV=4.5×4.5 cm, matrix=128×96, RARE factor=16, TR/TE=3000/33 ms, MT module B1=10μT/0.3 s (−6 to +6 ppm, 0.17 ppm steps). Prior to CEST, a localized spectroscopy scan was run around the hydrogel region for B0 shimming and evaluating the water-line width. Degree of asymmetry in the z-spectra was assessed using asymmetry plots (CEST_asym) [2]. Data processing was performed using ImageJ (NIH, MD, USA) and MS Excel. Histopathology was performed on representative samples at study termination (day 90) from each group.Results and Discussion
High molecular weight soluble HA (MW~2.8 million Dalton) exhibited fast degradation profile, as it disappeared from the injection site within seven days: volumetric calculations from T2W images showed an initial increase of volume up to day 2 after which the volume decreased rapidly (Fig. 2). This initial increase in volume has been attributed to an influx of free water following implantation. CEST-MRI, on the other hand, identified the HA signal at ~1ppm which steadily degraded over time (Fig. 3) enabling more accurate tracking of hydrogels by minimizing the effect of unbound water. Unlike soluble HA, the volumes from T2W-MRI of modified HA hydrogels showed influx and efflux of water during different phases after implantation (Fig. 4 – top graphs) providing the in vivo residence time of the hydrogel and water conglomerate. However, the CEST signal showed a gradual decrease with time (Fig. 4 – bottom graphs). With regard to in vivo stability of different HA hydrogels, hydrogel 1 showed the fastest degradation rate, hydrogel 2 degraded at an intermediate rate and hydrogel 3 the slowest. Microscopically, subcutaneous depots of HA hydrogels were detectable at day 90. Histopathology confirmed degradation behavior of each of the three hydrogels: tissue sections containing hydrogel 1 revealed rarefied but largely acellular matrix (hydrogel) surrounded by a thin fibrous capsule which is consistent with fast degradation (Fig. 5A); sections with hydrogel 2 showed a dense matrix frequently intercepted by fibrous septae and surrounded by a tenuous fibrous capsule indicating partial degradation (Fig. 5B); hydrogel 3 showed a dense and largely acellular matrix surrounded by a fibrous capsule which explains the slow degradation rate (Fig. 5C).Conclusions
Longitudinal tracking of hydrogel degradation using volume analysis has been demonstrated before to track biomaterials in vivo [4]. However, CEST-MRI provides a more reliable way to assess in vivo hydrogel degradation profiles in native form by minimizing the capture of water influxes. Hence, the quantitative assessment using CEST-MRI can be used as a guide in hydrogel optimization process for drug delivery applications.Acknowledgements
No acknowledgement found.References
[1] Hahn et al. (2007). International Journal of Biological Macromolecules 40: 374-380. [2] Dorsey et al. (2015). ACS Biomaterials Science and Engineering 1: 227-237. [3] Liang et al. (2015). Biomaterials 42: 144-150. [4] Karfeld-Sulzer et al. (2011). Magnetic Resonance in Medicine 65: 220-228.Figures
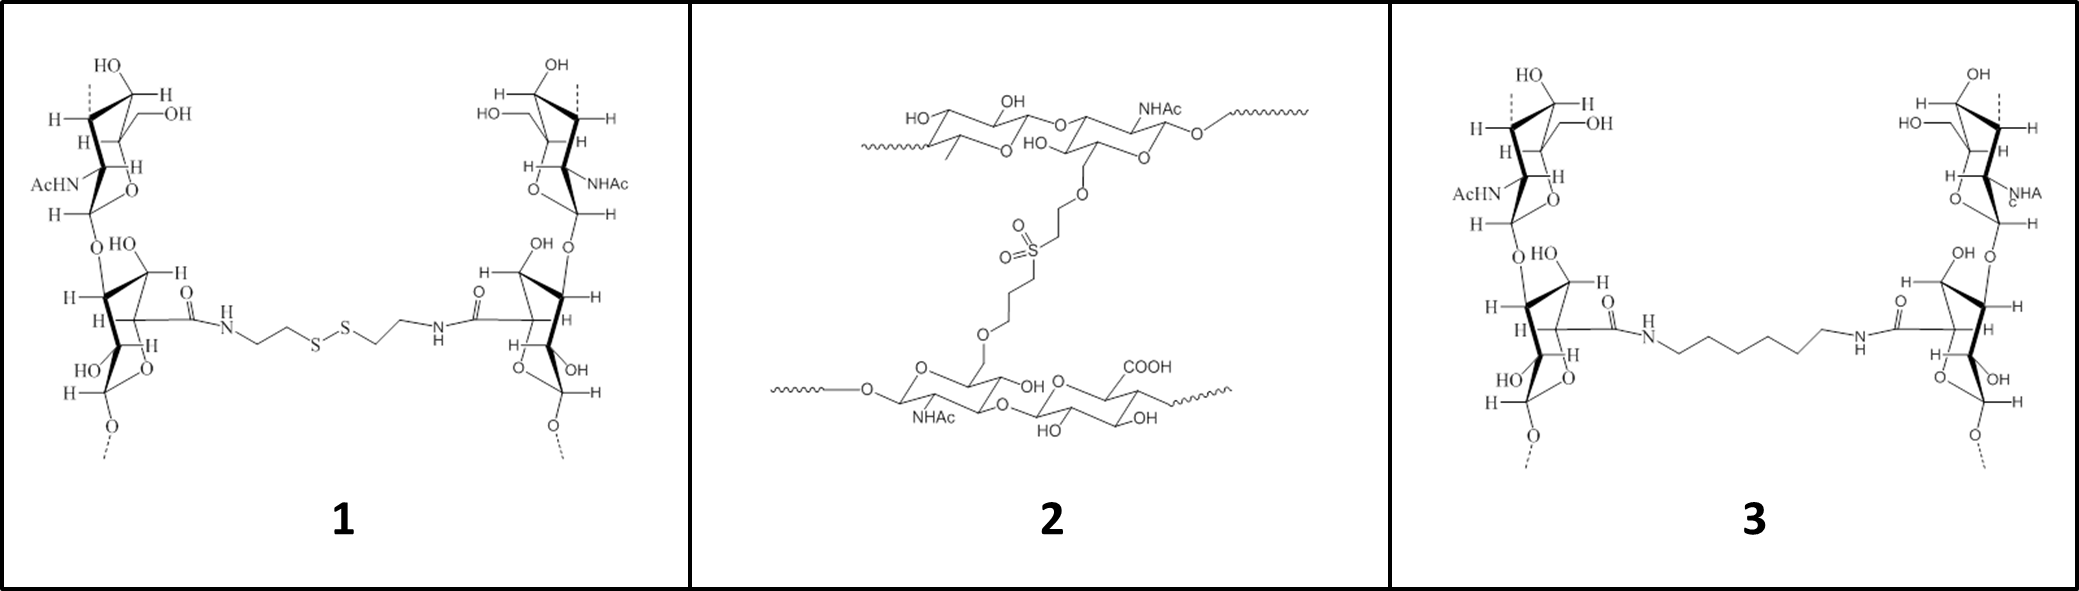
Fig. 1 – Structures of modified HA
hydrogels derived using different crosslinking agents: (1) Cystamine (disulfide containing cleavable crosslinker); (2) divinyl sulfone (non-cleavable);
and (3) 1,6-diamino hexane
(non-cleavable).
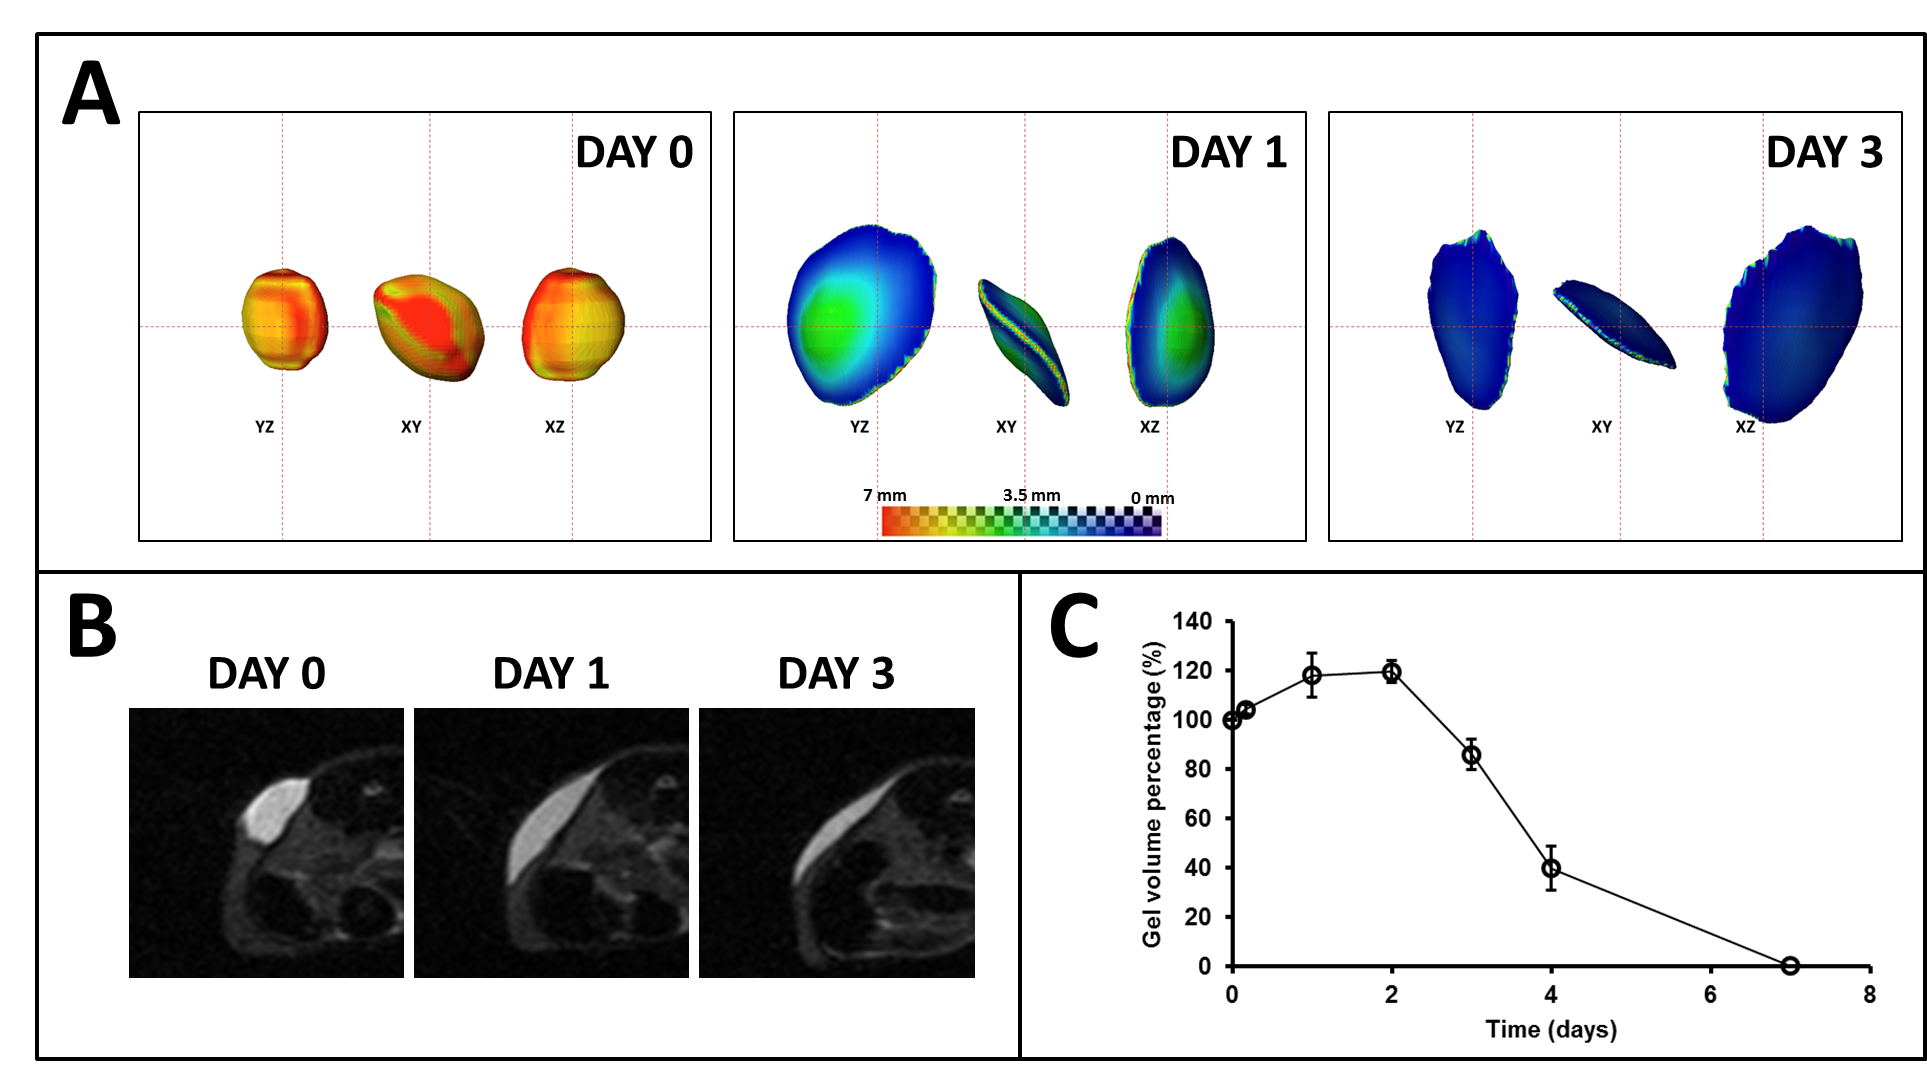
Fig. 2 – Data from a representative sample
showing the degradation of soluble HA hydrogel: (A) 3D reconstruction of the hydrogel in different planar
orientations and selected time-points; (B)
axial spin-echo images through a mid-slice section of the hydrogel; (C) time-course of the hydrogel volume
from implantation to complete degradation (n=4).
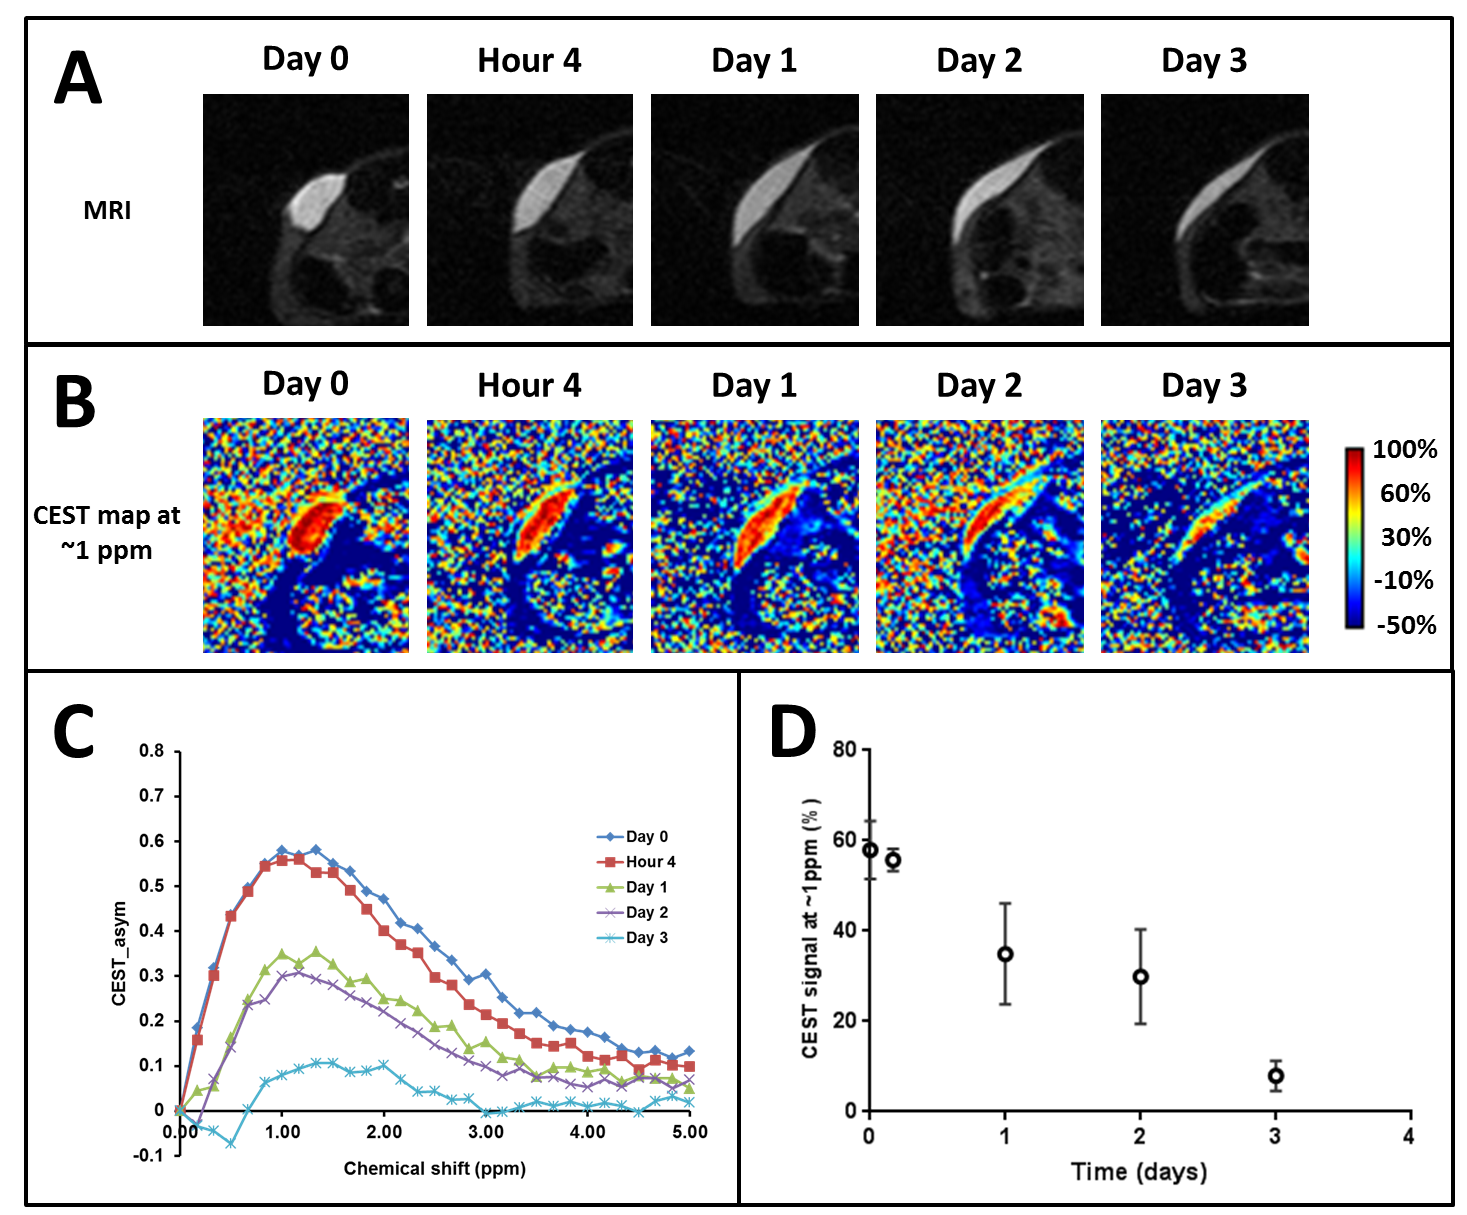
Fig. 3 – Data from a representative sample
showing the degradation of soluble HA hydrogel using (A) spin-echo MRI, and (B) CEST.
(C) The average CEST contrast (n=4)
is shown at different time-points where HA appears at ~1ppm. (D) Time-course of the peak CEST signal
from implantation to degradation (n=4).
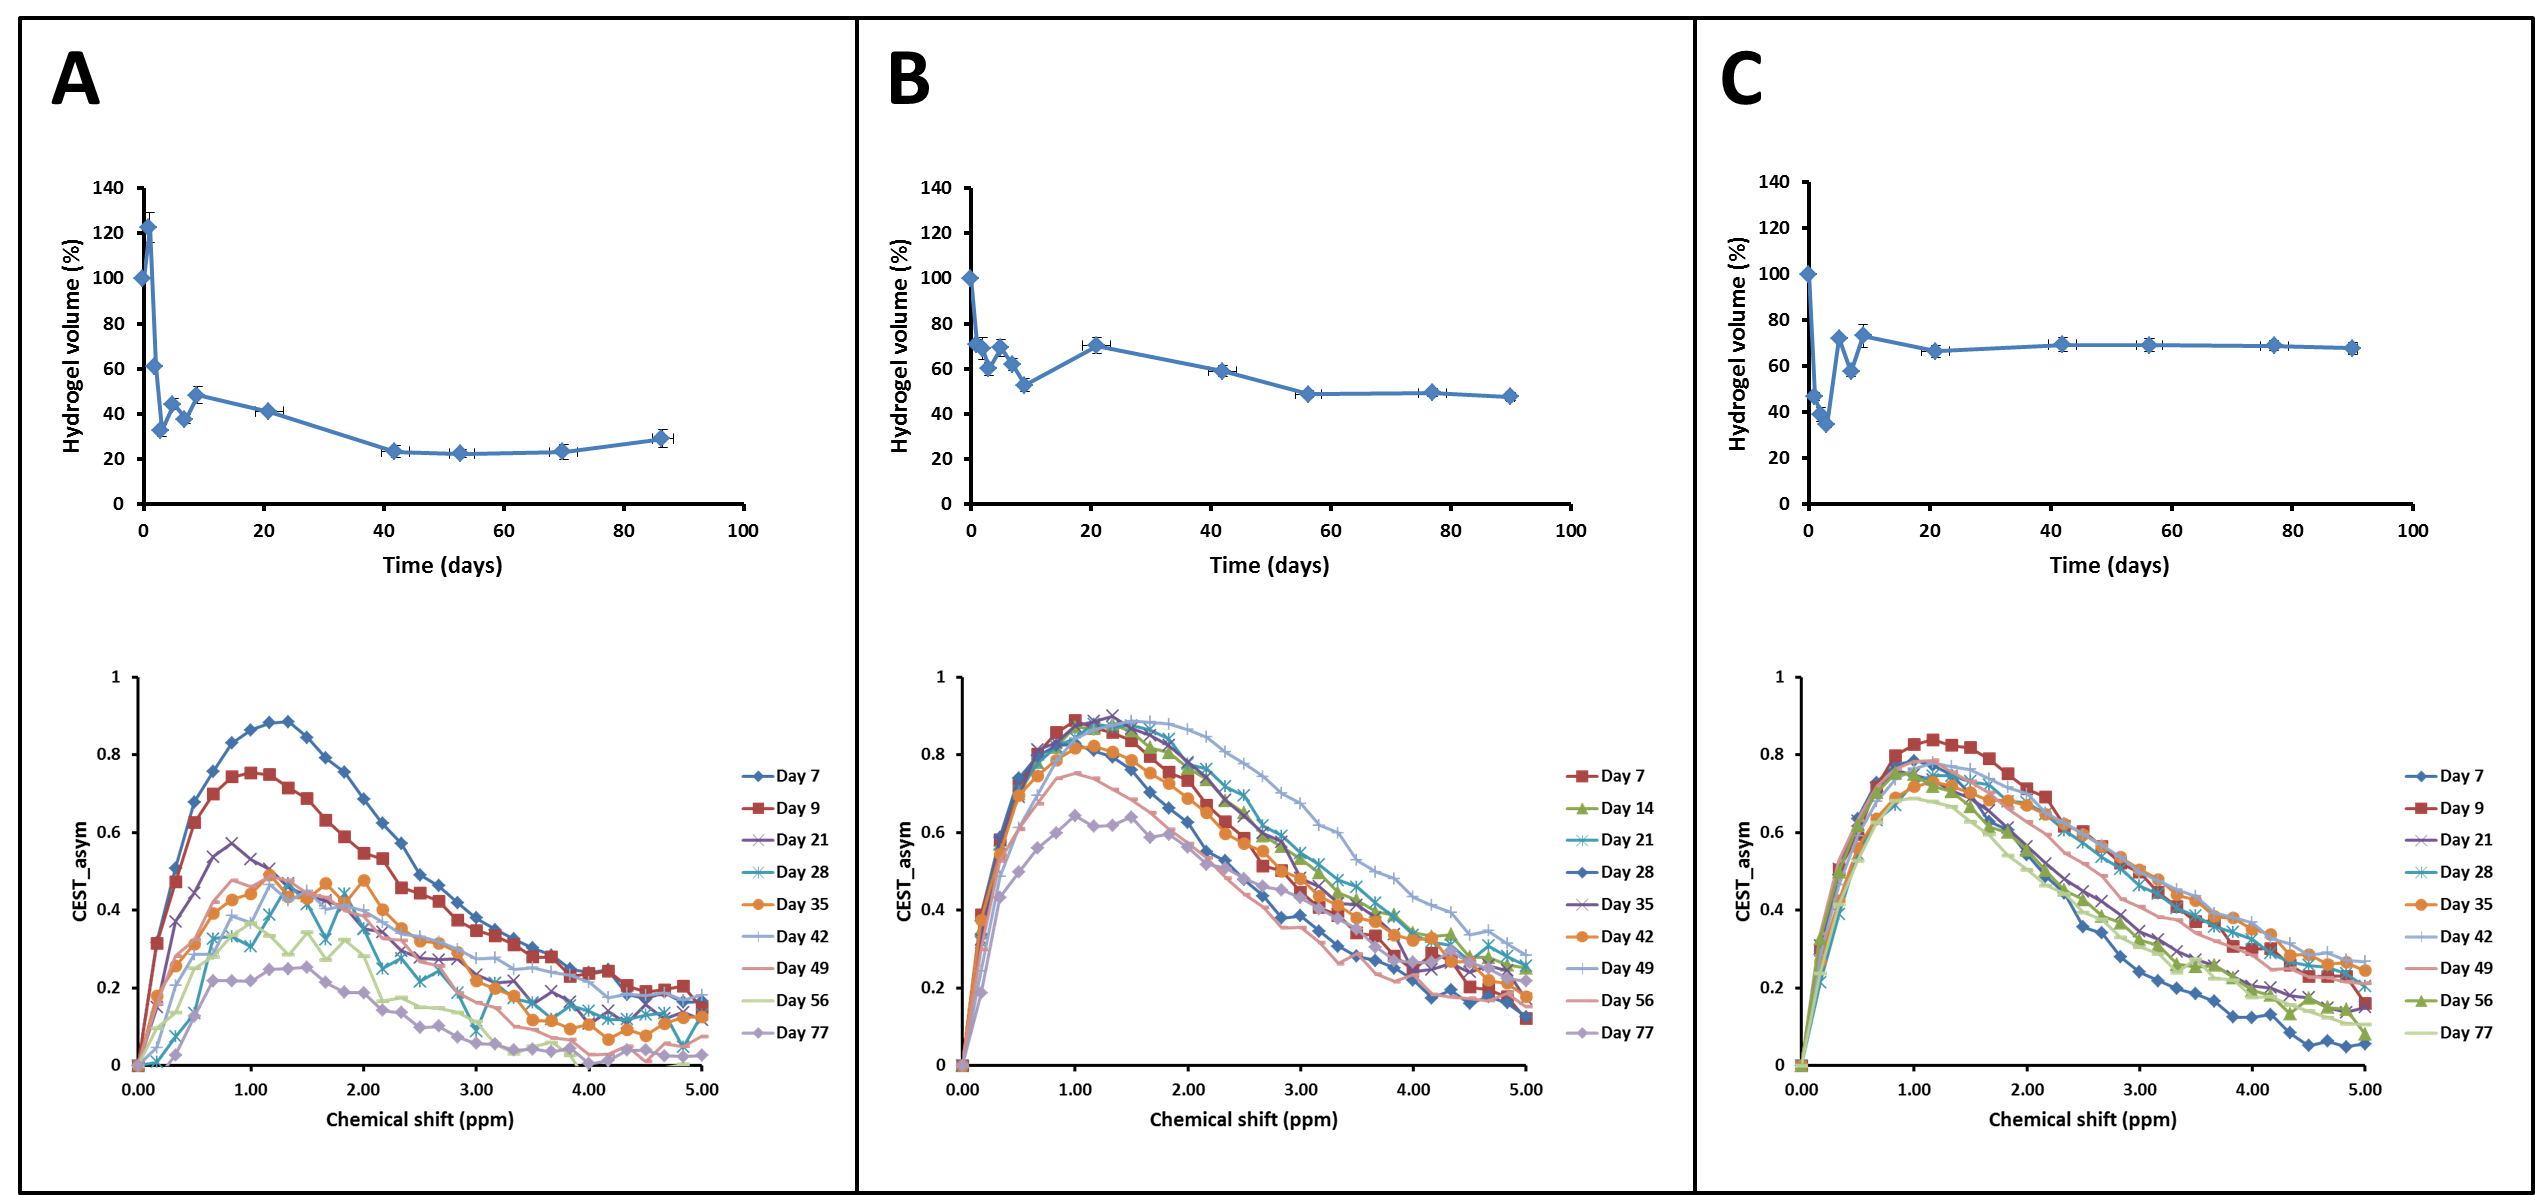
Fig. 4 – The top graphs of each panel show
the time-course of modified HA hydrogel volumes for (A) hydrogel 1 (n=6); (B) hydrogel 2 (n=7); and (C) hydrogel
3 (n=8). The bottom graphs of each
panel show the time-course of CEST contrast from a representative sample of
each corresponding group. Hydrogel 1
showed the fastest degradation rate, hydrogel 2 degraded at an intermediate rate and hydrogel 3 the slowest.
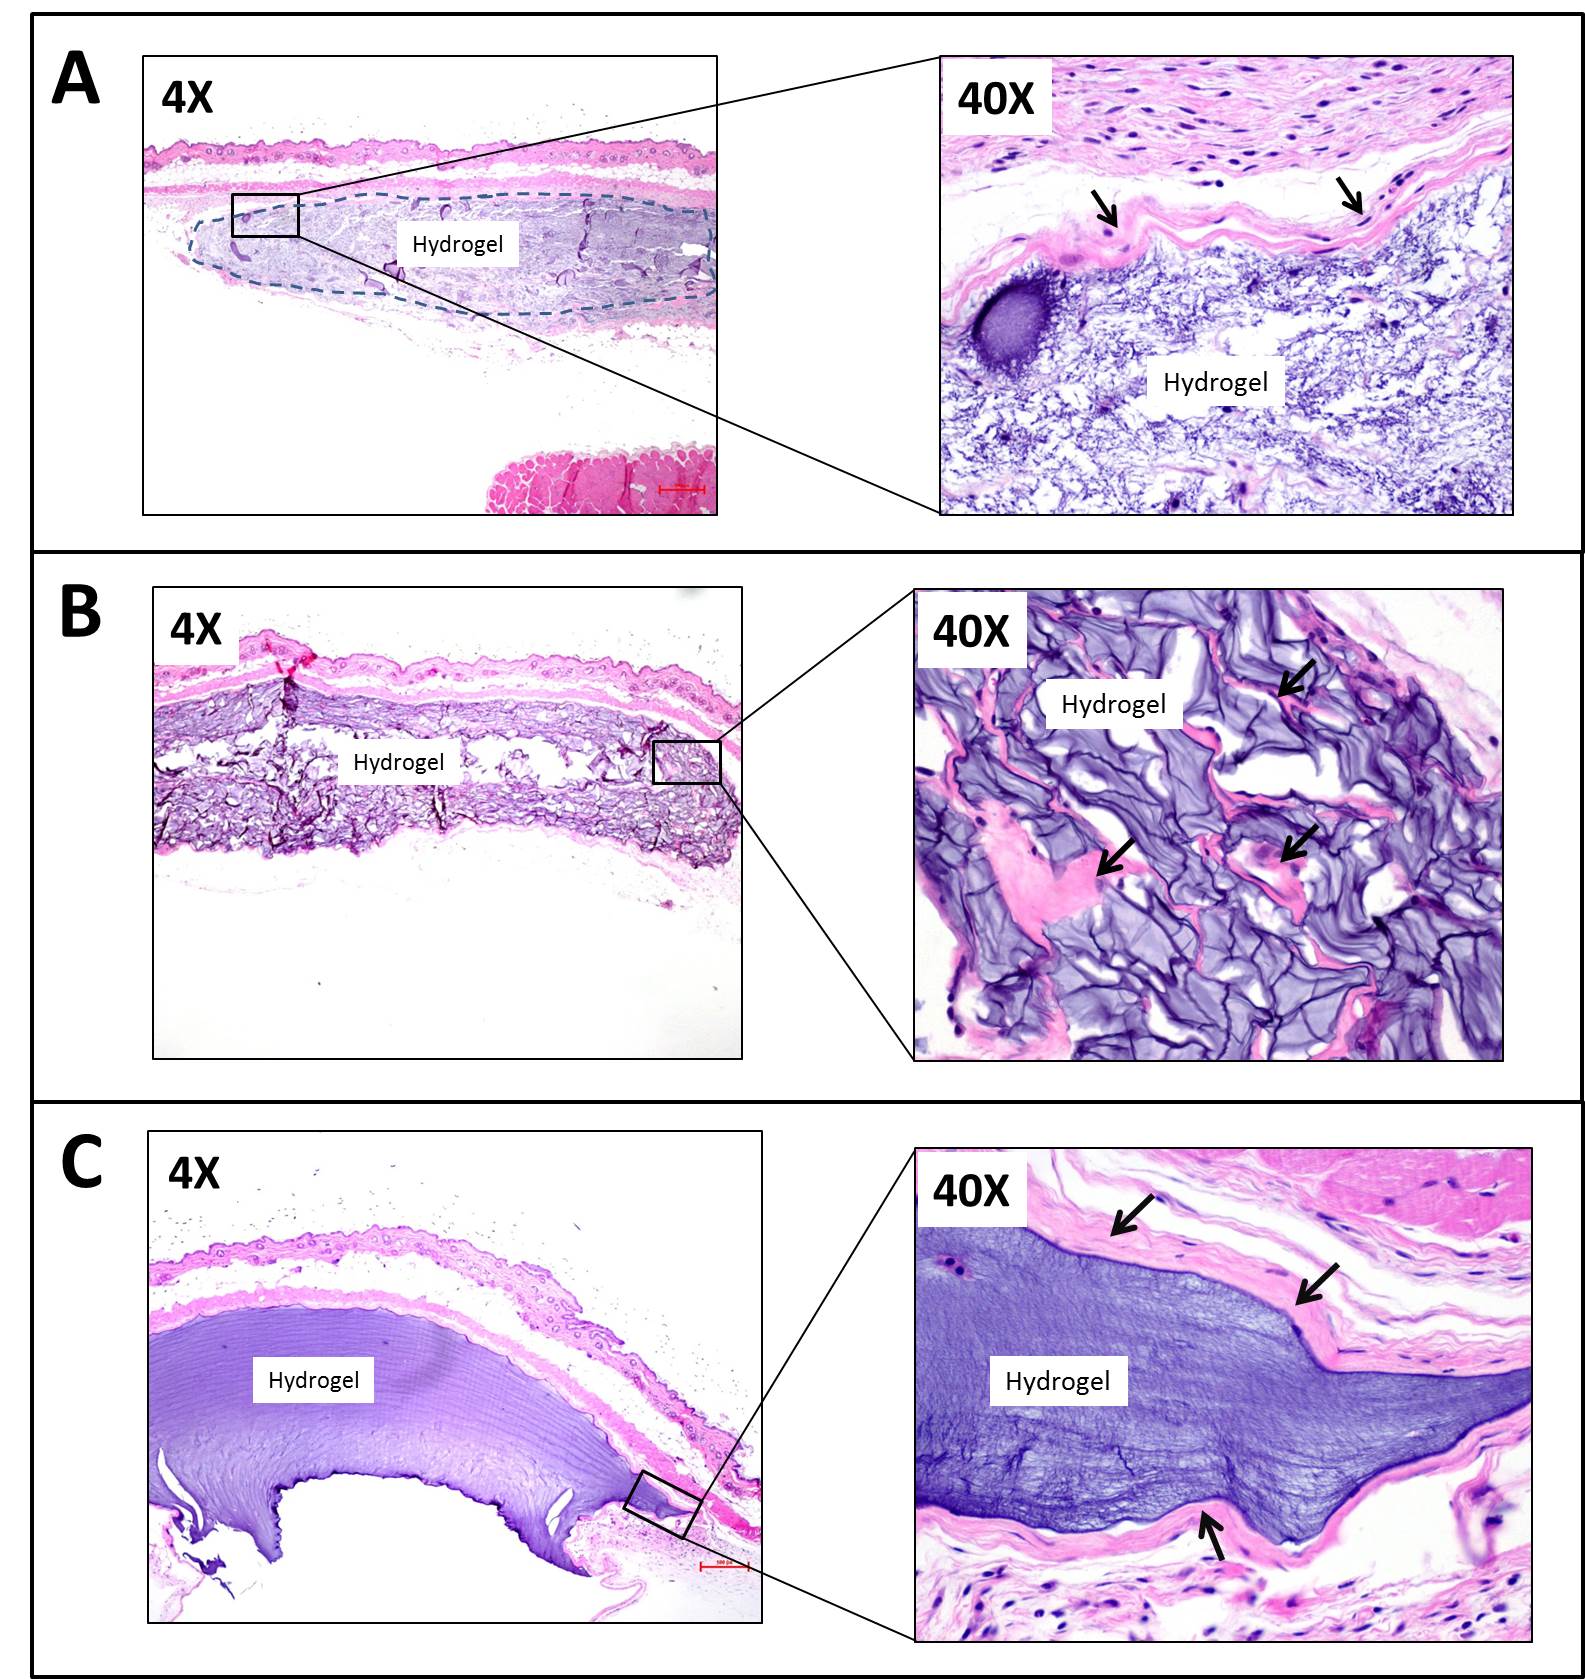
Fig. 5 – Representative H&E stained sections
of mouse skin and subcutis showing (A) hydrogel
1; (B) hydrogel 2; and (C) hydrogel 3. All samples were collected at 90 day post-injection. Boxed areas
in low magnification images on the left are shown at a higher magnification on the right. Note fibrous collagenous tissue (arrows) forming either a thin fibrous
capsule around the hydrogel depot (hydrogels 1 and 3), or septae within
the hydrogel depot (hydrogel 2).