3735
CEST imaging of an unlabelled chemotherapy agent (gemcitabine) 30 minutes after administration in a mouse model of colorectal cancer1Centre for Advanced Biomedical Imaging, University College London, London, United Kingdom
Synopsis
Imaging of drug delivery is useful for improving our understanding of the physical factors that contribute to the efficacy of anticancer therapies. Gemcitabine, a standard chemotherapeutic agent, has two hydroxyl groups and one amine group, making it potentially amenable to CEST imaging via proton exchange with tissue water. Recently, Li et al. (2016) showed that many anticancer drugs can induce CEST contrast and demonstrated that liposome-encapsulated gemcitabine can be imaged 5-hours post-administration in a pre-clinical model of cancer1. Here, we extend this exciting work and investigate the use of CEST to image acute gemcitabine uptake within 30 minutes of administration.
Purpose
To image acute delivery of an unlabelled chemotherapeutic agent (gemcitabine), within 30 minutes, in a mouse model of colorectal cancer using CEST MRI.Methods
CEST was performed on a 9.4T Agilent MRI scanner using a single-slice gradient echo CEST sequence, which included the following parameters: TR = 161ms, TE = 1.9ms, saturation power = 3.5µT, FA = 20°, FOV = 30mm2, slice thickness = 1mm, data matrix = 642. Z-spectra were acquired ranging from -8 to +8 ppm (see below for spacing) with a reference image at 80ppm. Acquisition time was 8 minutes.
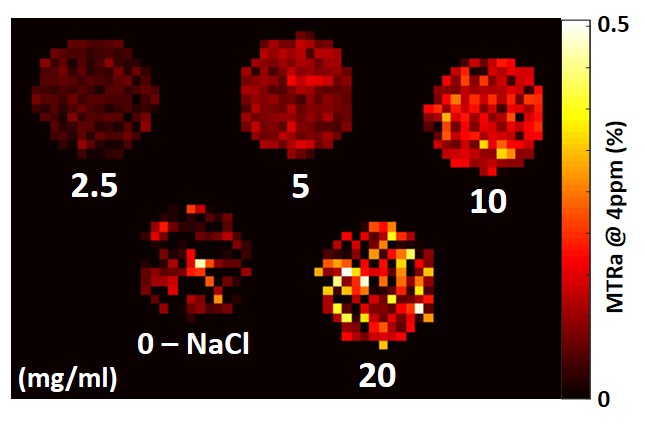
Phantom experiment: a serial dilution of gemcitabine in sodium chloride solution was imaged at four concentrations: 2.5, 5, 10 and 20 mg/mL. The z-spectra was acquired in steps of 0.15ppm.
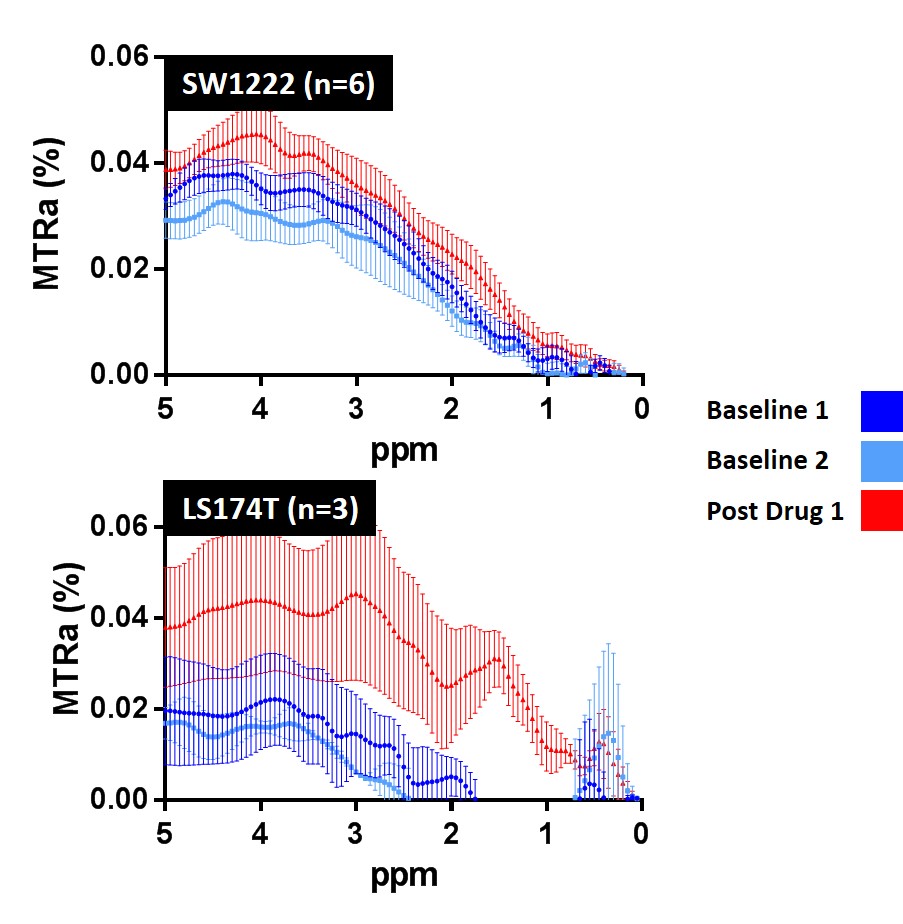
In vivo experiment: CD1 nu/nu mice were subcutaneously injected with 5x10⁶ SW1222 (n=6) or LS174T (n=3) colorectal cancer cells. CEST was performed axially through the widest extent of the tumour. Two baseline scans were acquired before intravenous injection of gemcitabine (15.2mg/mouse). Following 20 minutes for circulation, a post-drug scan was performed. Z-spectra were acquired in steps of 0.5ppm and interpolated to steps of 0.05ppm.
Results
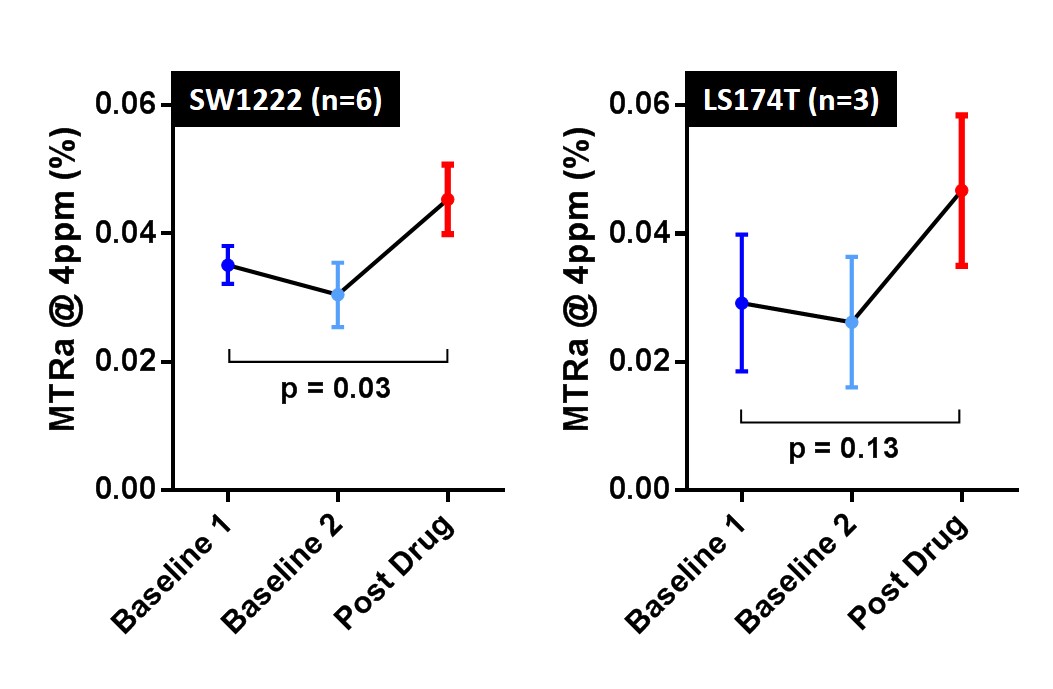
In the phantom experiment, MTR asymmetry (MTRa) at 4ppm increased with gemcitabine concentration (Fig 1). A clear increase in MTRa at approximately 4ppm was observed in both cohorts of mice, following administration of gemicitabine (Fig 2, red curves), when averaging the CEST signal across the tumour slice. In the SW1222 group, a significant increase in MTRa (4ppm) was observed 30 minutes after gemcitabine compared to baseline (p=0.03). A similar increase was observed in the LS174T cohort, but the difference was non-significant (Fig 3b, p=0.13).Discussion
In this study we have demonstrated the feasibility of using CEST MRI for imaging the uptake of a chemotherapy agent within 30 minutes of delivery, before the drug has had time to induce potentially CEST-sensitive microstructural changes2. Importantly, this technique utilises the inherent CEST signal from gemcitabine – a cheap, routinely-used clinical chemotherapy agent – thus negating labelling, liposome encapsulation or other advanced drug delivery techniques. Continuing studies will focus on increasing sensitivity to improve the spatiotemporal visualisation of drug delivery.Acknowledgements
No acknowledgement found.References
1Y. Li, H. Chen, J. Xu, et al. CEST theranostics: label-free MR imaging of anticancer drugs. Oncotarget (2016).
2E. Panagiotaki, S. Walker-Samuel, B. Siow, et al. Noninvasive Quantification of Solid Tumor Microstructure Using VERDICT MRI. Cancer Research (2014).
Figures