3732
Quantitative validation of Spin Echo and Magnetic Resonance Fingerprinting derived Proton Density using the qMRI Phantom1Radiology, NYU School of Medicine, New York, NY, United States, 2Sackler Institute of Graduate Biomedical Sciences, NYU School of Medicine, New York, NY, United States
Synopsis
Proton density (PD) measurements derived from single Spin Echo and PnP-MRF, which is a fingerprinting protocol that enables simultaneous estimation of the excitation field (B1+), were validated using the ISMRM/NIST MRI system phantom that contains known D2O/H2O solutions at 14 different concentrations. We also expanded the PnP-MRF protocol by exploiting the symmetry between B1+ and the receive field, B1-, produced by a quadrature body coil at 3 Tesla in order to remove all B1 contribution from our PD. Ultimately, all methods showed remarkable correlation with the known water fraction from NIST samples (Pearson’s rho>0.99).
Introduction
With growing emphasis on the quantitative nature of MRI measurements, validation against a ground truth becomes increasingly important. Magnetic resonance fingerprinting (MRF) potentially enables the simultaneous estimation of the relative proton density ($$$PD$$$), longitudinal relaxation ($$$T_1$$$), and transverse relaxation ($$$T_2$$$). Until now, the validation has mainly focused on the accuracy of $$$T_1$$$ and $$$T_2$$$ values1,2,3. The$$$\,PD$$$-map, however, also contains valuable clinical information4 and could be used to validate advanced diffusion metrics such as surface-to-volume ratio, S/V, in anisotropic fiber phantoms5,6. In this work, we analyze the accuracy and precision of MRF based$$$\,PD\,$$$measurements using the qMRI NIST phantom7.Methods
We used our Siemens Magnetom PRISMA (Siemens, Erlangen, Gremany) in combination with the standard 20-channel head coil, to image a single axial slice through the NIST phantom7. This phantom offers an array of 14 spheres with various concentrations of D2O/H2O to create a range of different$$$\,PD\,$$$values.
The Plug-and-Play MR Fingerprinting (PnP-MRF) sequence2 was used to generate a$$$\,PD$$$-map (total scan time 8-min). In addition to $$$PD$$$, $$$T_2$$$, and, $$$T_1$$$ PnP-MRF also enables the simultaneous estimation of the excitation field ($$$B_1^+$$$). Although this removes possible $$$B_1^+$$$ bias effects from the $$$T_1$$$ and $$$T_2$$$ measurements, the$$$\,PD\,$$$remains proportional to the receive field ($$$B_1^-$$$). A rigorous measurement of the field remains extremely challenging8. Instead, clinical systems typically use the large body coil as a reference to estimate the fields produced by an array of local receivers. This step, referred to as pre-scan normalize, mitigates the strong spatial variations in the fields of a close fitting receive array, leaving only a small variations corresponding to the residual variations in the receive field of the body coil. In this work we expanded on the pre-scan normalize method by exploiting the symmetry between and fields produced by a quadrature body coil at 3 Tesla9,10. After generating parametric maps from PnP-MRF, we used the estimated field to correct the$$$\,PD\,$$$maps.
$$\,\,\,\,\,\,\,\,\,\,\,\,PD=\frac{PD_{pnp-mrf}}{\alpha\,|B_1^+|}\,\,\,\,\,\,\,\,\,\,\,\,(1)$$
where $$$\,\alpha=|BC|/|B_1^+|$$$ and $$$BC\,$$$is the signal from the body coil.
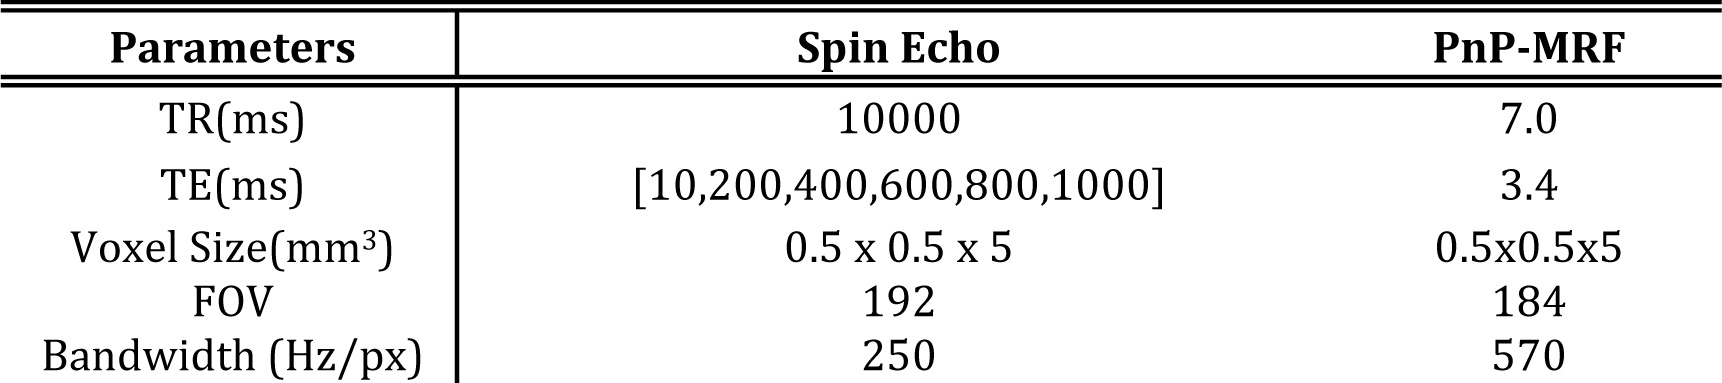
In addition, we also acquired a series of single Spin Echo (SE, Total scan time 8 hours). Signal decay from SE was modeled as a function of echo time (TE) using an exponential model:$$$\,S(TE)=PD\text{exp}(-TE/T_2)$$$, with 2 parameters:$$$\,PD\,$$$and$$$\,T_2\,$$$. In this case the product inline pre-scan normalize feature and the online Siemens reconstruction tools were used to reconstruct the data. A complete overview of all sequence parameters can be found in Table1.
The accuracy of these methods was quantified by comparing water fraction ($$$\phi$$$) in each of the 14 spheres to the ground truth fraction provided by NIST. The signal within each sphere was normalized by the signal from the sphere containing 100% H2O: $$\,\,\,\,\,\,\,\,\,\,\,\,\phi=\frac{PD_N}{PD_{100\%}}\,\,\,\,\,\,\,\,\,\,\,\,(2)$$
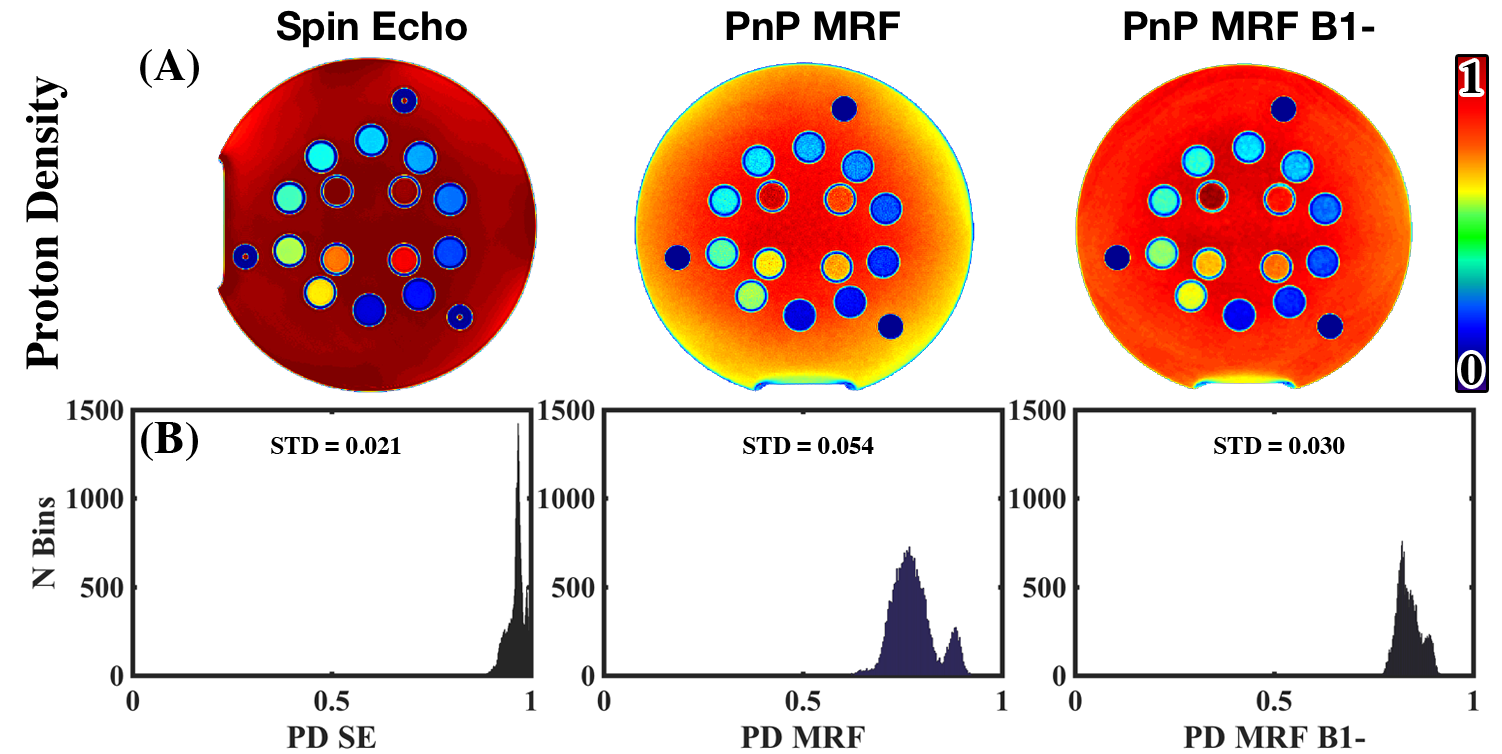
Histogram analysis was used to evaluate the signal variability on normalized images for the water outside of the D2O/H2O spheres, where the proton density is expected to be uniform. The width of the histogram serves as a marker for residual inhomogeneity in the image.
Results
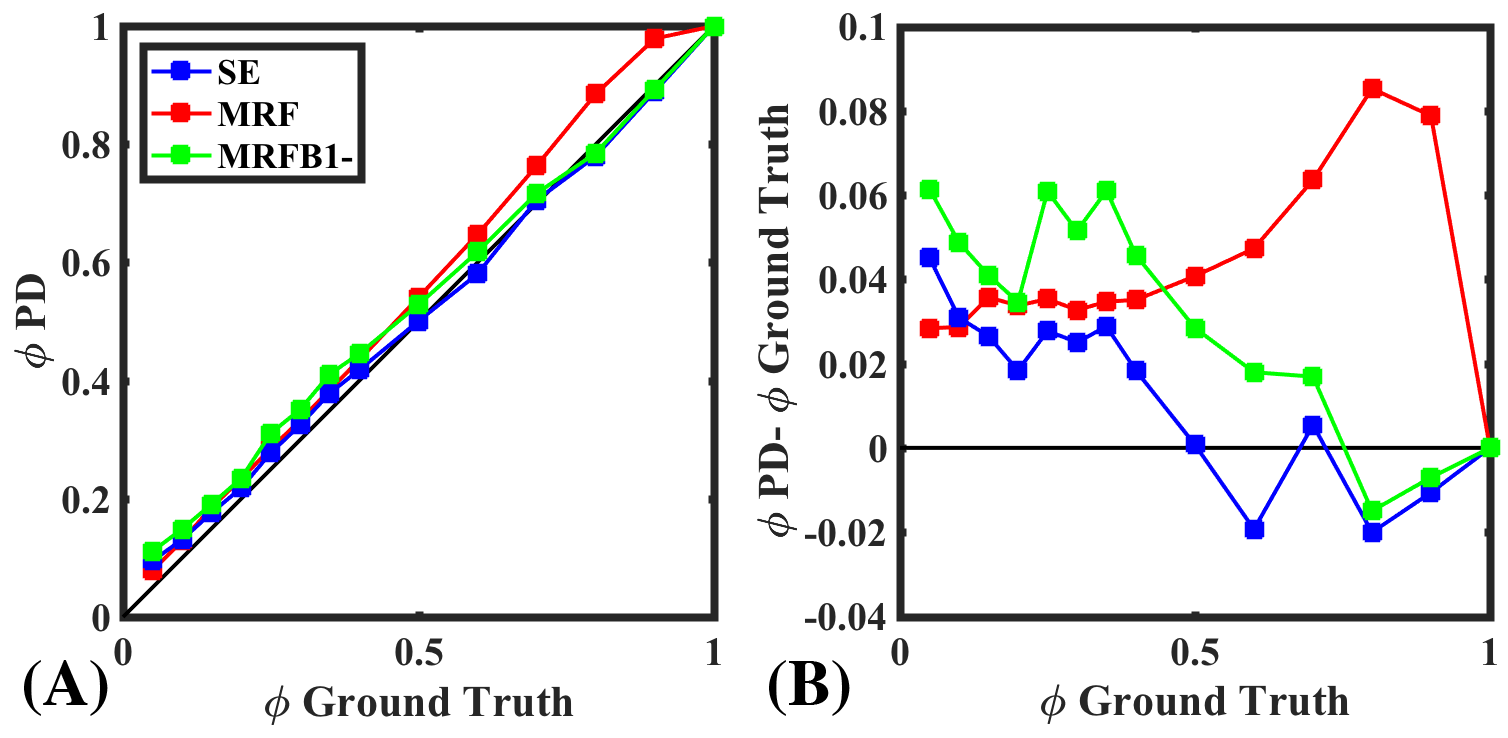
Qualitatively, implementing PnP-MRF$$$\,B_1^-$$$ results in greater uniformity in the image [Fig.1(A)]. This is confirmed through histogram analysis [Fig.1(B)], which shows lower standard deviation in PnP-MRF$$$\,B_1^-$$$ than in PnP-MRF. However, the SE method with proprietary pre-scan normalize still produces more homogenous$$$\,PD\,$$$maps. Comparing the$$$\,PD\,$$$derived$$$\,\phi\,$$$with the ground truth$$$\,\phi\,$$$reveals that SE has the greatest agreement with the ground truth [Fig.2(B)]. All three methods demonstrate a remarkable correlation with the ground truth (Pearson’s$$$\,\rho>0.99$$$) [Fig.2(A)].Discussion
The$$$\,\phi\,$$$derived from PnP-MRF$$$\,B_1^-\,$$$appears to converge towards the estimate of$$$\,\phi\,$$$from SE. PnP-MRF$$$\,B_1^-\,$$$does indeed improve agreement with the ground truth, however for many values of$$$\,\phi\,$$$SE are still slightly better. This may be the result of miscalculation$$$\,B_1^-\,$$$of the field. One possible explanation is that our phantom induces scatter fields, which interact with the incident field. In this situation the$$$\,B_1^+\,$$$and$$$\,B_1^-\,$$$field distributions will deviate somewhat, an effect that is expected to increase at higher frequencies9. Although PnP-MRF$$$\,B_1^-\,$$$shows a remarkable improvement in$$$\,PD\,$$$quantification, the histogram analysis shows that the 0/100% D2O/H2O sample has a higher$$$\,PD\,$$$than the un-doped water outside of the sphere. We believe this difference is an artifact that arises from increased flow sensitivity for high $$$T_2$$$. Although this abstract emphasizes the subtle differences between methods, the overall message is that these approaches are all sufficient for approximating$$$\,\phi\,$$$[Fig. 2(A)].Conclusion
PnP-MRF can derive$$$\,PD\,$$$metrics that are comparable to the gold standard SE measurement in terms of quantitative accuracy, but in a fraction of the time (8min vs 8hours). Further study into scatter field distribution and concrete exploration of the transceiver assumption for the quadrature coil is expected to result in even greater agreement with the ground truth.Acknowledgements
No acknowledgement found.References
[1] Ma D, Gulani V, Seiberlich N, Liu K, Sunshine JL, Duerk JL, Griswold MA. Magnetic resonance fingerprinting. Nature 2013;495(7440):187-192.
[2] Cloos MA, Knoll F, Zhao T, Block KT, Bruno M, Wiggins GC, Sodickson DK. Multiparametric imaging with heterogeneous radiofrequency fields. Nature communications 2016;7:12445.
[3] Jiang Y, Ma D, Keenan KE, Stupic KF, Gulani V, Griswold MA. Repeatability of magnetic resonance fingerprinting T1 and T2 estimates assessed using the ISMRM/NIST MRI system phantom. Magnetic Resonance in Medicine:n/a-n/a.
[4] Venn M, Maroudas A. Chemical composition and swelling of normal and osteoarthrotic femoral head cartilage. I. Chemical composition. Annals of the Rheumatic Diseases. 1977;36(2):121-129.
[5] Fieremans E, De Deene Y, Delputte S, Ozdemir MS, Achten E, Lemahieu I. The design of anisotropic diffusion phantoms for the validation of diffusion weighted magnetic resonance imaging. Physics in medicine and biology 2008;53(19):5405-5419. [6] Lemberskiy G, Baete S, Cloos M, Novikov D, Fieremans E. Validation of S/V derived from Oscillating Gradient Spin Echo on a clinical scanner using anisotropic fiber phantoms. Proceedings of the International Society of Magnetic Resonance in Medicine 24, Singapore;.Diffusion at the Cutting Edge. 0013, 2016.
[6] (http://collaborate.nist.gov/mriphan- toms/bin/view/MriPhantoms/MRISystemPhantom). (http://collaborate.nist.gov/mriphan- toms/bin/view/MriPhantoms/MRISystemPhantom).
[7] Quantitative (qMRI) ISMRM System phantom from NIST. (http://collaborate.nist.gov/mriphantoms/bin/view/MriPhantoms/WebHome)
[8] Sodickson D, Alon L, Deniz M C, Novikov S D, Generalized Local Maxwell Tomography for Mapping of Electrical Property Gradients and Tensors. Proceedings of the International Society of Magnetic Resonance in Medicine 21, Salt Lake City, USA, 4175, 2013.
[9] Voigt T, Katscher U, Doessel O. Quantitative conductivity and permittivity imaging of the human brain using electric properties tomography. Magnetic Resonance in Medicine 2011;66(2):456-466
[10] van Lier ALHMW, Raaijmakers A, Voigt T, Lagendijk JJW, Luijten PR, Katscher U, van den Berg CAT. Electrical Properties Tomography in the Human Brain at 1.5, 3, and 7T: A Comparison Study. Magnetic Resonance in Medicine 2014;71(1):354-363.
Figures