3730
Inversion-recovery Ultrashort Echo Time Imaging with Bi-component T2* Analysis of White Matter Signals in Native and Deuterated Ovine Brain Specimens1Dept. of Radiology, University of California, San Diego, San Diego, CA, United States, 2Radiology Service, VA San Diego Healthcare System, San Diego, CA, United States
Synopsis
Myelin protons have ultrashort-lived MR signals and are not accessible by clinical MRI. Such signals were probed herein using ultrashort echo time imaging (UTE) and inversion-recovery UTE (IR-UTE) with bi-component analysis in native and deuterated ovine brain specimens. UTE detected a fraction of ultrashort T2 components (STC) of < 4% in native specimens, and up to ~54% in deuterated specimens. Choice of inversion time in IR-UTE significantly affected such bi-component signal decay behavior in native samples in heavily deuterated samples. These results support the application of UTE and IR-UTE in quantitative myelin imaging.
Purpose
Brain water signals have been conventionally separated into three components: a cerebrospinal fluid-derived long T2 component (~2 s), a cellular water-derived intermediate component (~100 ms), and a myelin water-derived short component (~20 ms).1&2 Myelin protons have ultrashort-lived T2 signals and are not accessible by conventional MRI sequences.3 This study aimed to use ultrashort echo time (UTE) imaging and inversion-recovery UTE (IR-UTE) with bi-component analysis to probe myelin signal in fresh and deuterated ovine brain white matter (WM).Methods
Sample preparation: Five freshly-frozen ovine brains were dissected into one ~2×2×5 mm3 WM mini-specimen, three corpus callosum segments (~2×4×10 mm3), and five ~3-mm thick cerebral hemisphere specimens (hemisphere samples, n=5). The WM mini-specimen was imaged in the native condition. Each corpus callosum segment was imaged before and after 1-hr, 2-hr or 27-hr exchange with D2O. One hemisphere specimen was imaged after 7-day exchange with D2O; the D2O was refreshed daily. Four cerebral hemisphere specimens were imaged before and after 27-hr exchange with D2O.
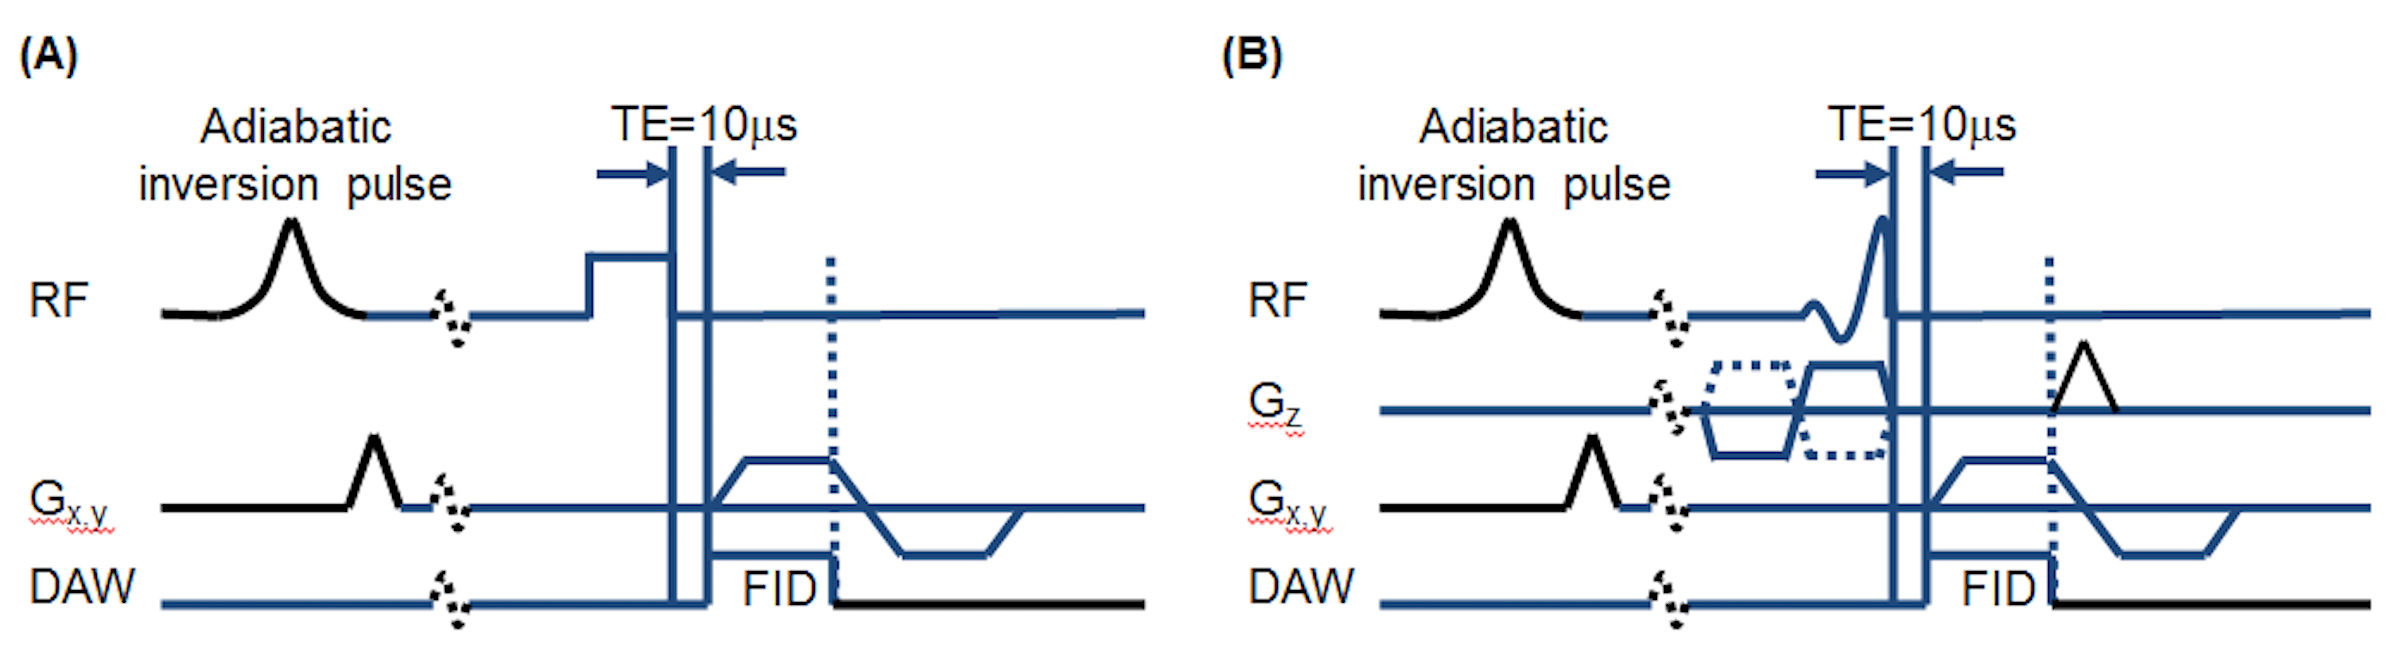
Data acquisition: All specimens were imaged at 3T using a 1-mL solenoid coil (the WM mini-specimen) or a 3-inch surface coil. A conventional proton density-weighted fast spin echo (PD-FSE) sequence with TR/TE = 8000/13.5 ms was used to measure long T2 signals to assess exchange between tissue water and D2O. T1 of long T2 signals and T2* of ultrashort T2 signals were measured using IR-UTE with variable inversion times and echo times, respectively (Figure 1).4
Data analysis: T1s of long T2 signals, the optimal inversion time (TI) for nulling long T2 signals (TInull), and T2*s of ultrashort T2 signals were calculated in each manually-defined WM ROIs offline using single- and bi-component fitting models in Matlab. PD-FSE signal intensities were measured in ImageJ offline.
Results
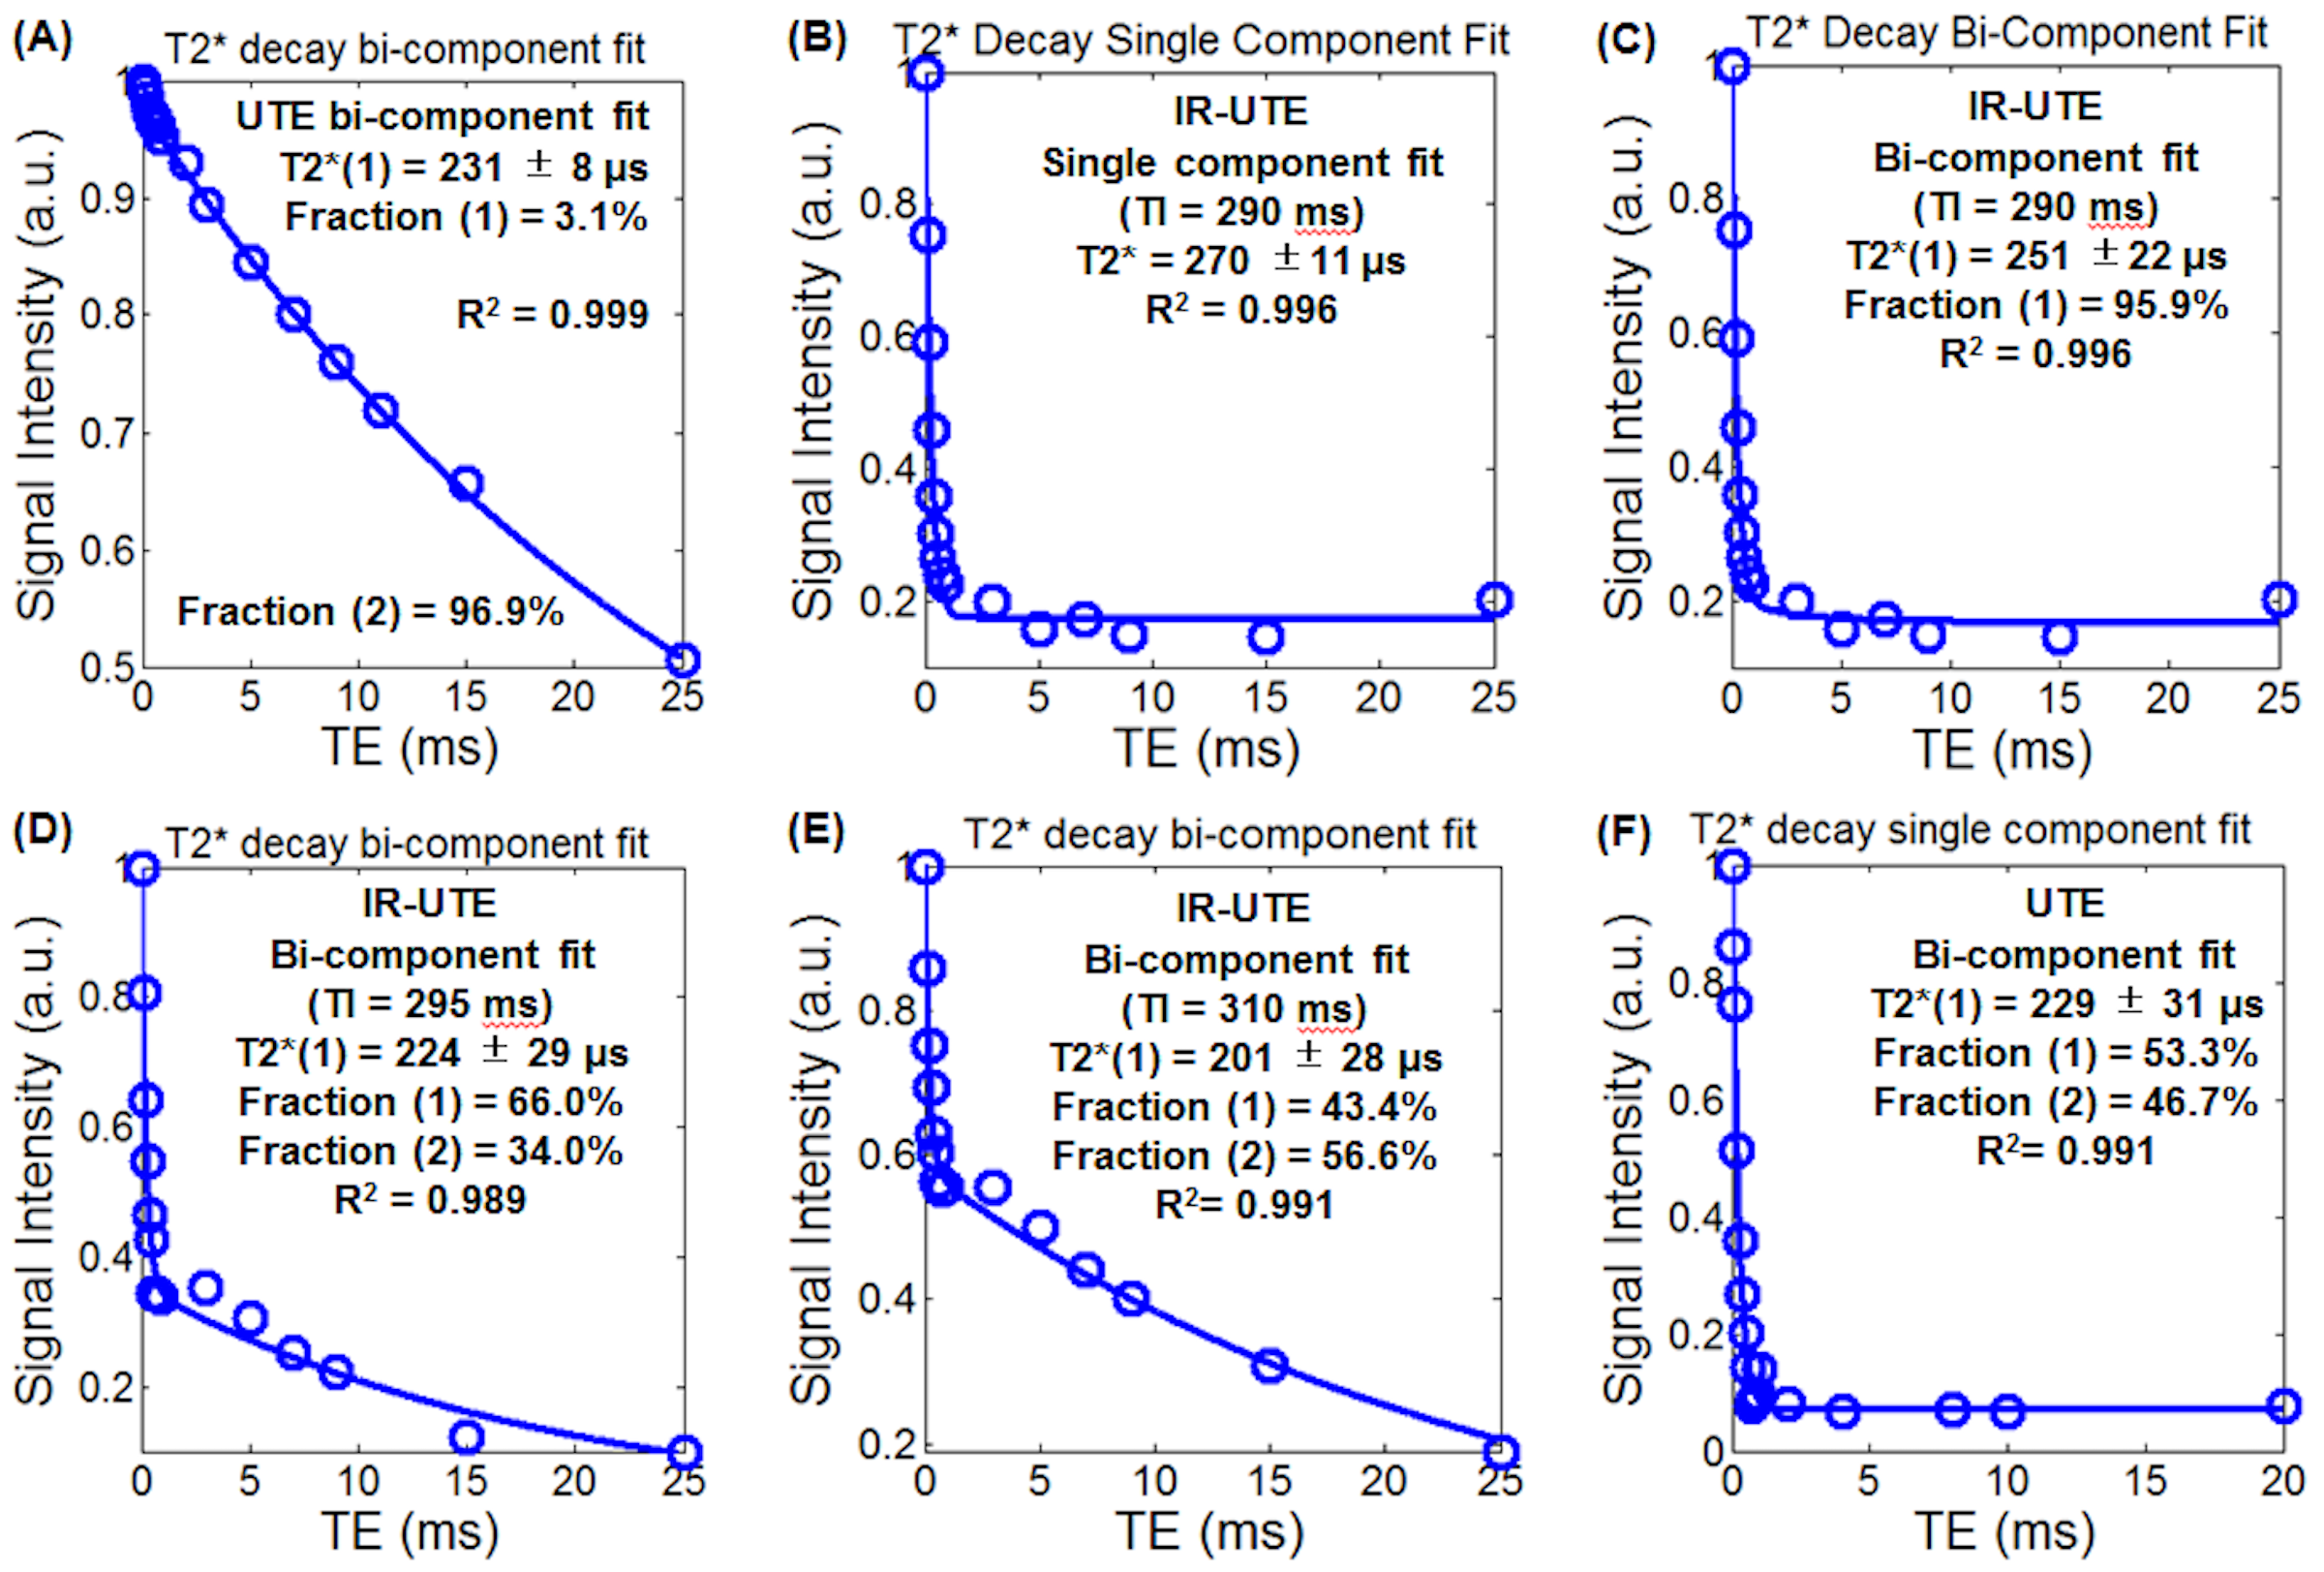
UTE with bi-component fitting detected a fraction of ultrashort T2 components (STCs) of 3.1% with T2* = 231±8 µs in the native WM mini-specimen (Figure 2A), and 53.3% with T2* = 229±31 µs in WM of the hemisphere specimen deuterated for 7 days (Figure 2F). Using hard-pulse excitation (Figure 1A) and a 1-mL solenoid coil, IR-UTE with TInull = 290 ms detected a largely single-component T2* decay in the native WM mini-specimen (Figure 2B), with the measured T2* value similar to that derived from bi-component fitting (Figure 2C); with TI increased from 290 ms to 310 ms, the STCs fraction dramatically decreased from 95.9% to 43.4% (Figures 2D-E).
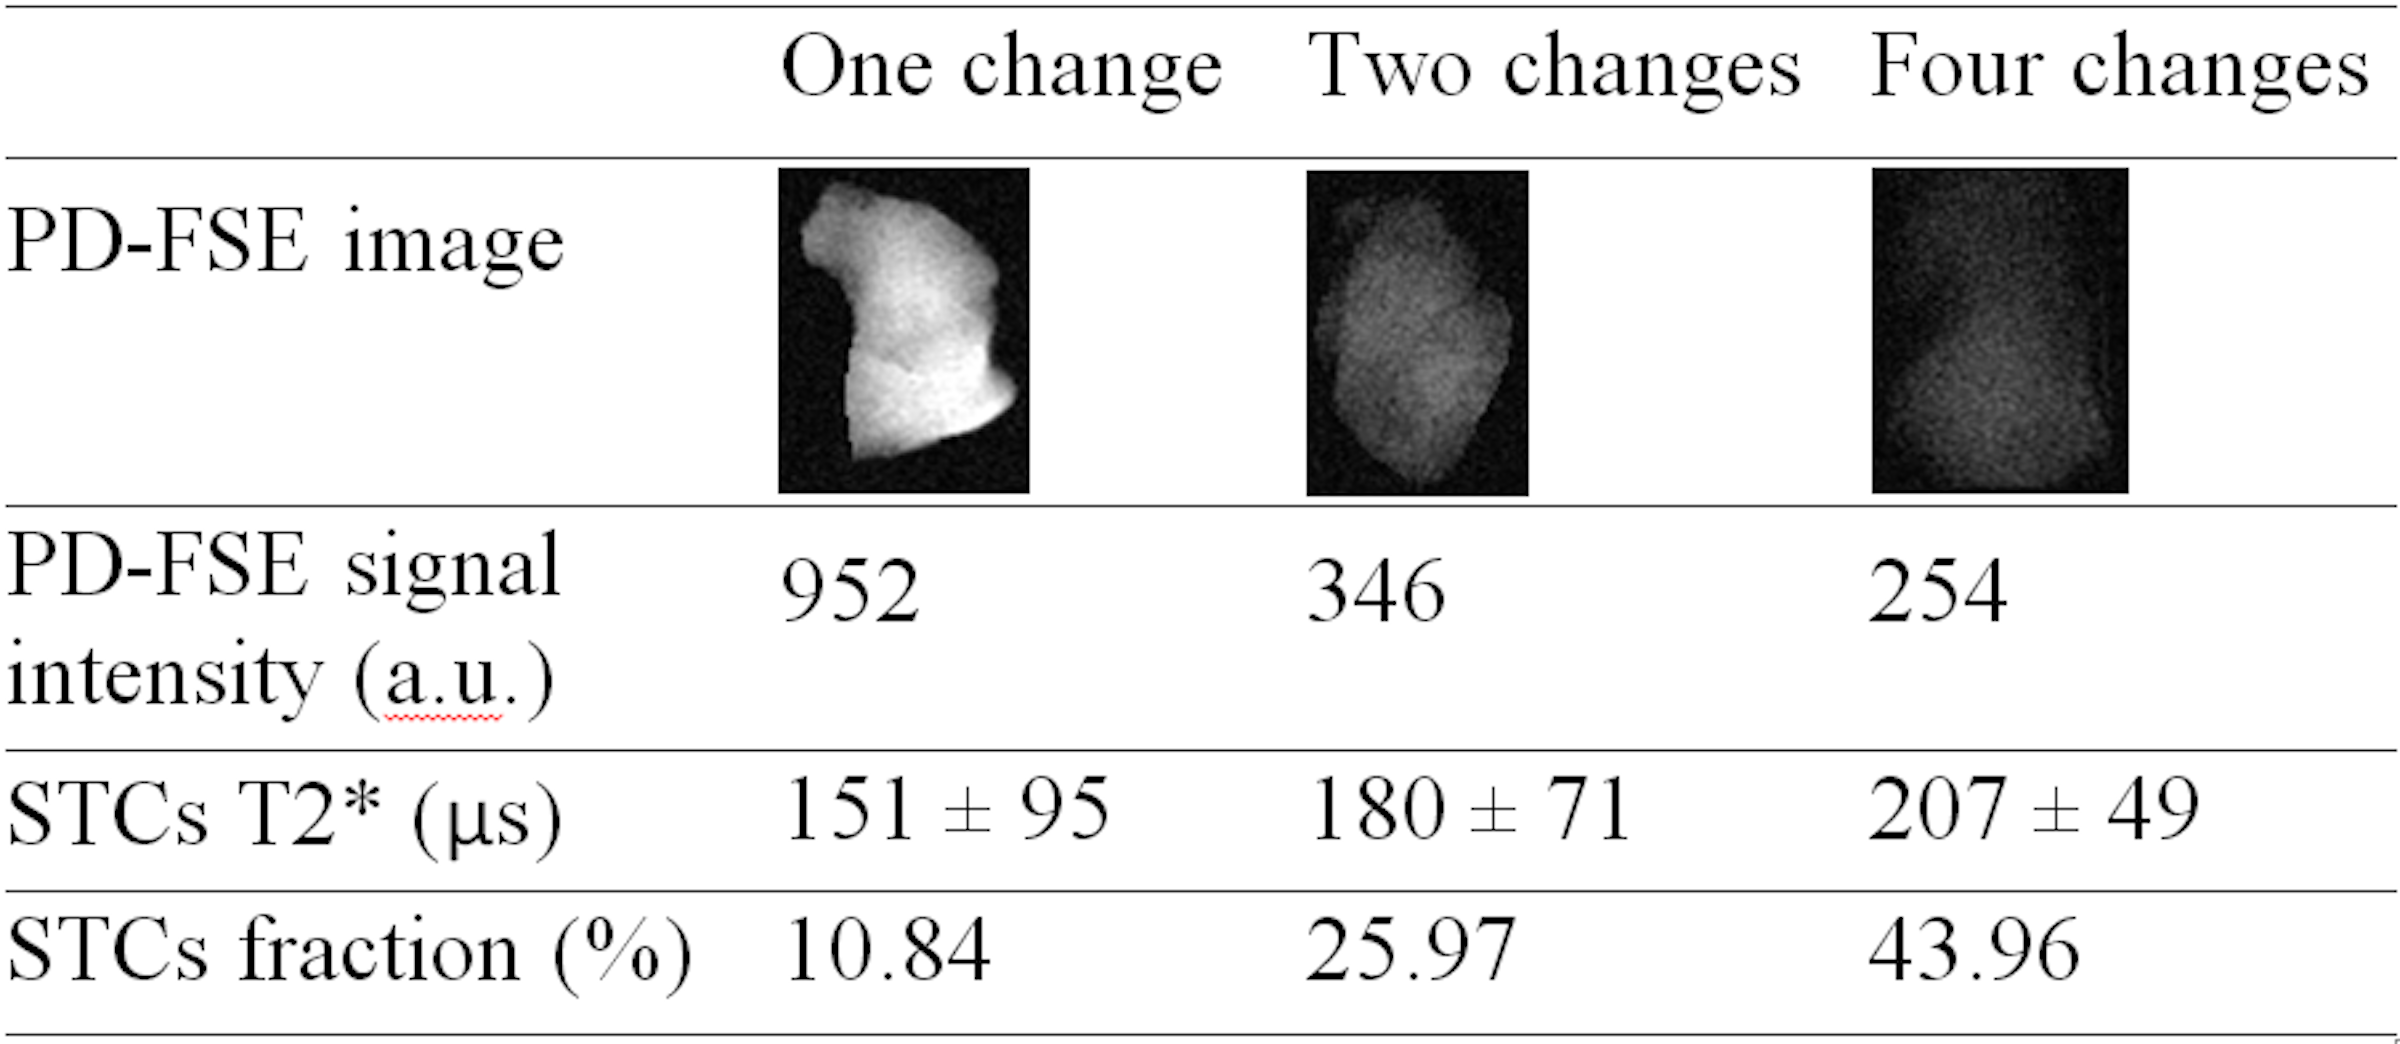
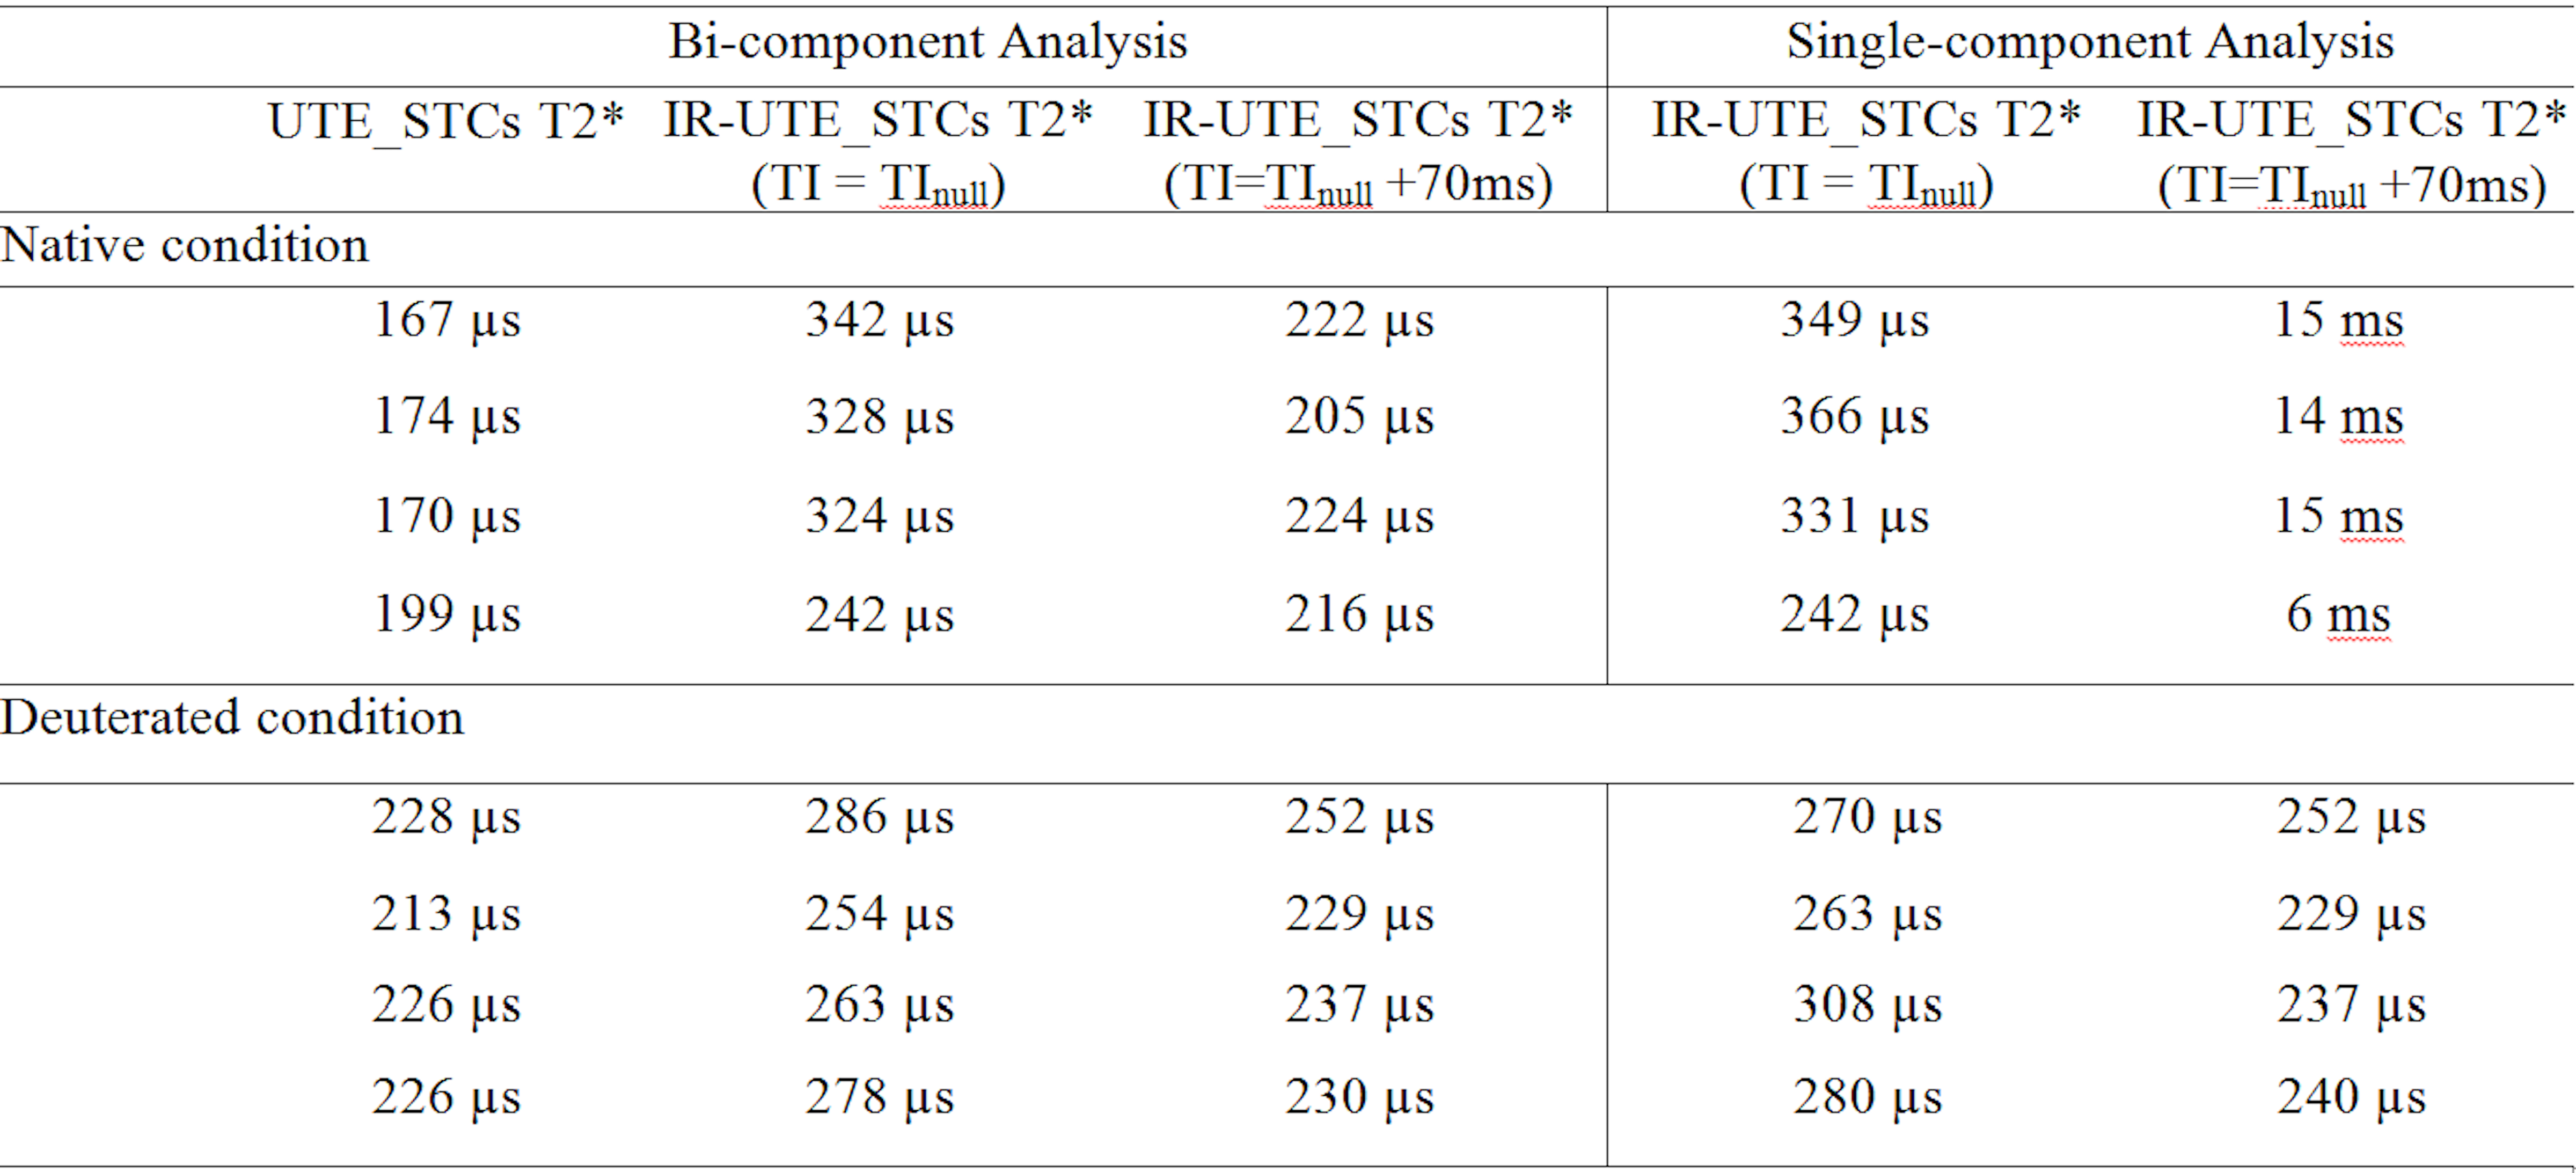
Using soft pulse excitation (Figure 1B) and a 3-inch surface coil, the UTE sequences detected relatively constant STCs T2*s and dramatic differences of STCs fractions among three corpus callosum specimens that were deuterated for 1-hr, 2-hr or 27-hr (Table 1). In hemisphere specimens, STCs fractions were 2.39-3.17% in the native condition and 33.2-42.47% in the deuterated condition (27-hr exchange with D2O). Using the same setup, native WM STCs fractions were 94.64±3.70% in IR-UTE experiments at TInull, which decreased to 17.08±0.74% with TI increased by 70 ms. In deuterated WM, T2* values obtained by single- and two-component analyses were approximately the same (210-310 µs) both TInull and TInull+70 ms (Table 2).
Discussion
Deuteron in D2O is an isotope of proton and is not detectable in proton MRI.5 Myelin protons mainly exist in methylene groups and are not interchangeable with deuterons.6&7 In this study, STCs fractions, obtained with UTE and bi-component analysis, were negatively correlated with PD-FSE signal intensities in partially deuterated corpus callosum segments. Increasing TI in IR-UTE led to dramatic decrease of STCs fractions and affected STCs T2* measurements in native WM, but not in heavily deuterated WM. These results support: 1) the major source of IR-UTE signals at TInull is likely to be myelin protons; and 2) UTE and IR-UTE sequences are sensitive to myelin fraction changes and therefore could be applied for direct quantification of myelin loss in neurological diseases.
Hard excitation pulses have higher power and shorter duration than half pulses and thus are more efficient in probing extremely short T2* signals.8 In this study, UTE and IR-UTE sequences with half pulses showed similar sensitivity as those with hard pulses to WM water fraction changes. Nevertheless, the STCs fractions were not ~100% in native WM in IR-UTE at TInull, suggesting imperfect nulling of long T2 signals. These findings show confidence as well as potential problems for clinical applications of IR-UTE, which warrants further investigation.
Conclusion
UTE and IR-UTE sequences hold potential for direct and quantitative imaging of myelin loss. Realization of these potentials needs further technical improvements for optimal nulling of long T2 signals.Acknowledgements
The authors acknowledge
grant support from NIH (1R01 NS092650).
References
1. Laule C, Vavasour IM, Kolind SH, Li DK, Traboulsee TL, Moore GR, MacKay AL. Magnetic resonance imaging of myelin. Neurotherapeutics 2007;4(3):460-484.
2. Alexander AL, Hurley SA, Samsonov AA, Adluru N, Hosseinbor AP, Mossahebi P, Tromp do PM, Zakszewski E, Field AS. Characterization of cerebral white matter properties using quantitative magnetic resonance imaging stains. Brain Connect 2011;1(6):423-446.
3. Du J, Ma G, Li S, Carl M, Szeverenyi NM, VandenBerg S, Corey-Bloom J, Bydder GM. Ultrashort echo time (UTE) magnetic resonance imaging of the short T2 components in white matter of the brain using a clinical 3T scanner. Neuroimage 2014;87:32-41.
4. Du J, Peterson M, Kansal N, Bydder GM, Kahn A. Mineralization in calcified plaque is like that of cortical bone--further evidence from ultrashort echo time (UTE) magnetic resonance imaging of carotid plaque calcification and cortical bone. Med Phys 2013;40(10):102301.
5. Muller S, Seelig J. Invivo Nmr Imaging of Deuterium. J Magn Reson 1987;72(3):456-466.
6. Horch RA, Gore JC, Does MD. Origins of the ultrashort-T2 1H NMR signals in myelinated nerve: a direct measure of myelin content? Magn Reson Med 2011;66(1):24-31.
7. Wilhelm MJ, Ong HH, Wehrli SL, Li C, Tsai PH, Hackney DB, Wehrli FW. Direct magnetic resonance detection of myelin and prospects for quantitative imaging of myelin density. Proc Natl Acad Sci U S A 2012;109(24):9605-9610.
8. Carl M, Bydder M, Du J, Takahashi A, Han E. Optimization of RF excitation to maximize signal and T2 contrast of tissues with rapid transverse relaxation. Magn Reson Med 2010;64(2):481-490.
Figures