3729
Ex vivo whole-blood $$$T_2$$$ versus $$$HbO_2$$$ calibration for $$$T_2$$$-prepared balanced steady-state free precession (bSSFP) at 1.5T1Department of Radiology, University of Pennsylvania, Philadelphia, PA, United States, 2Division of Hematology, The Children's Hospital of Philadelphia, Philadelphia, PA, United States
Synopsis
The transverse relaxation rate (1/T2) of blood water protons is governed by deoxyhemoglobin concentration, therefore providing a means to determine oxygen saturation (HbO2) in vivo. However, besides CPMG inter-pulse interval of the T2 preparation and field strength, whole-blood T2 depends on sequence-specific parameters. Balanced SSFP allows for rapid image acquisition and higher in-plane resolution and thus provides an ideal readout for T2-based oximetry. Here, we quantified T2 of human blood at 1.5T for the entire range of HbO2 saturation levels using T2-prepared bSSFP sequence. The data show the expected linearity of 1/T2 with (1-HbO2)2 with the y-intercept depending on hematocrit.
PURPOSE
The transverse relaxation rate of blood water protons has long been known to be governed by deoxyhemoglobin concentration.1 Wright et al2 first described the relationship between blood T2 and oxygen saturation (HbO2) in terms of a model derived from the Luz-Meiboom equation for two-site chemical exchange, yielding: $$$\frac{1}{T_2}=\frac{1}{T_{2o}}+K(1-HbO_2)^2$$$. Here, T2 and T2o are the transverse relaxation times of partially and fully oxygenated blood, respectively, and K is a constant that depends on field strength, hematocrit and refocusing pulse interval (τ180) of T2-preparation, and potentially, on the acquisition scheme. Values for K and T2o at various field strengths have been described for T2-prepared EPI and spiral readouts.2-4 In these methods the trade-off between scan duration and in-plane resolution is considerable, making them less than ideal for in vivo studies in the body. In contrast, balanced steady-state free precession (bSSFP) offers far more rapid image acquisition and higher in-plane resolution. However, a calibration curve describing the relationship between HbO2 and T2 of whole-blood estimated using T2-prepared bSSFP does not exist. Therefore, in this work we quantify T2 of human blood samples for the entire range of HbO2 saturation levels using a T2-prepared sequence with bSSFP readout.METHODS
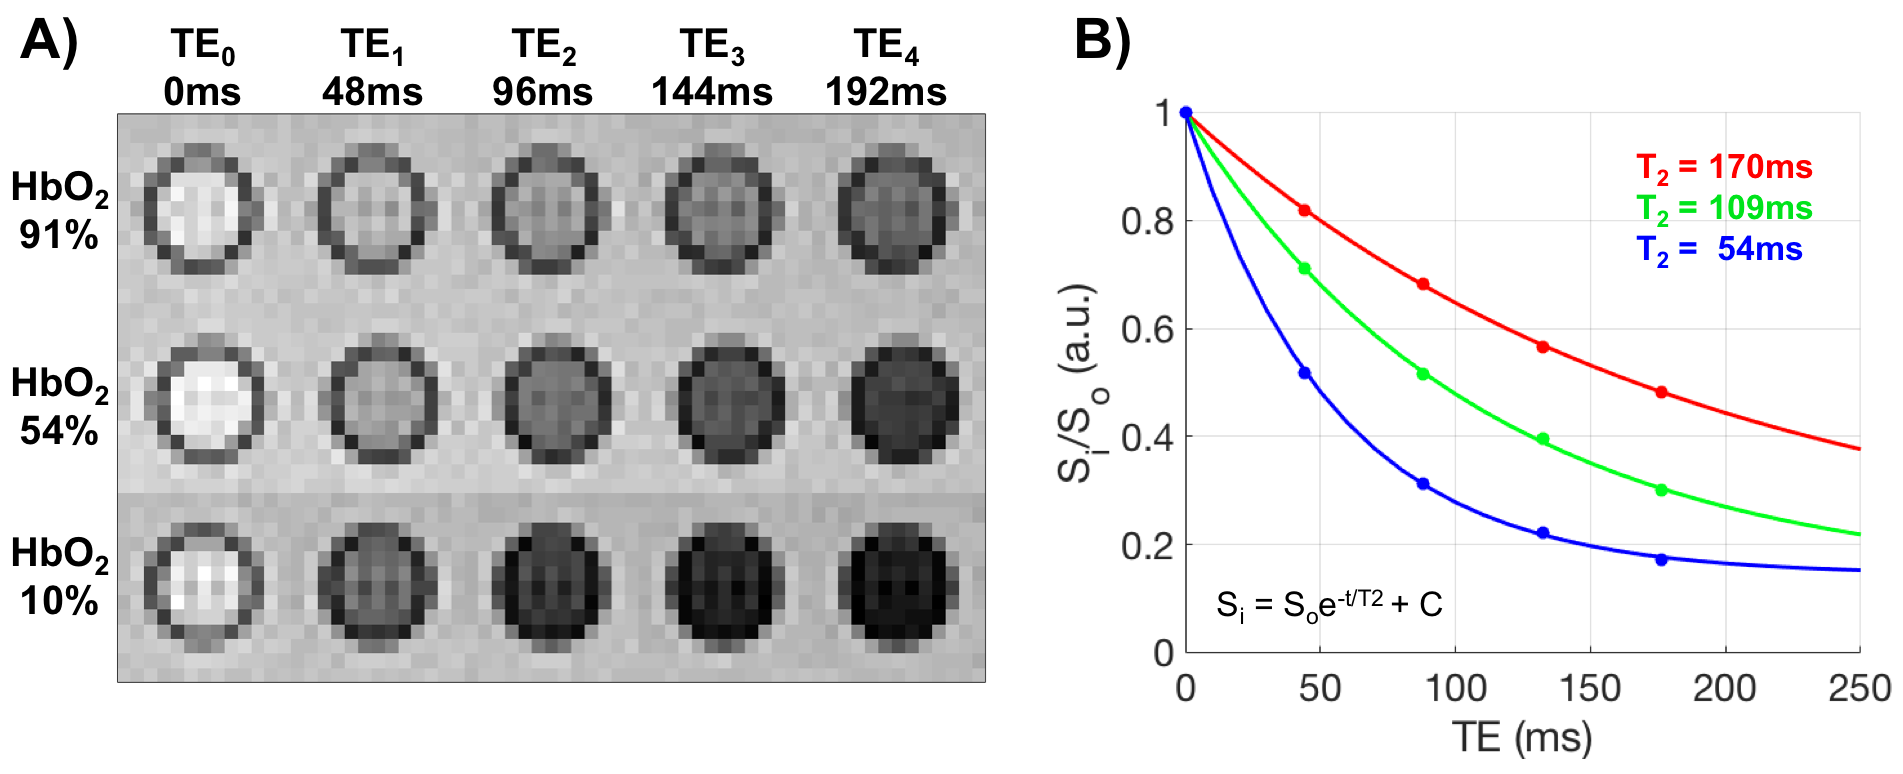
Fresh whole blood was collected from four healthy human subjects (31.5±1.7 years old, 1 male) yielding a total of 35 samples, which were scanned within 12hrs of blood draw. Samples were placed into an apparatus consisting of 6 wells (35.4mm diameter and 17.4mm height each) mounted on a shaker platform with an air-tight lid. Blood was oxygenated to different HbO2 levels by varying time of exposure to N2 gas. HbO2 was measured with a clinical level blood gas analyzer. Once desired oxygenation levels were achieved blood was transferred to 3mL syringes and sealed. Syringes were kept in a dry bath at 37°C and then placed in a cylindrical container filled with distilled water at the same temperature. This assembly was scanned at 1.5T (Siemens Avanto) with a 10-channel head coil. Imaging parameters: TR=4400ms, T2-preparation TEs=0,48,96,144,192ms, bSSFP TR/TE=3.8/1.9ms, FOV=128×128mm2, voxel size=1.25×1.25×5mm3, FA=60°, half-Fourier with 14 reference lines and τ180 of 12ms. A three-parameter fit was used to derive T2 (as the bSSFP transient signal approaches non-zero amplitude).5 Additionally, TEs were corrected as the magnetization is temporarily stored along the longitudinal axis (signal decay occurs with time constant T1, not T2) during the execution of refocusing pulses.6RESULTS
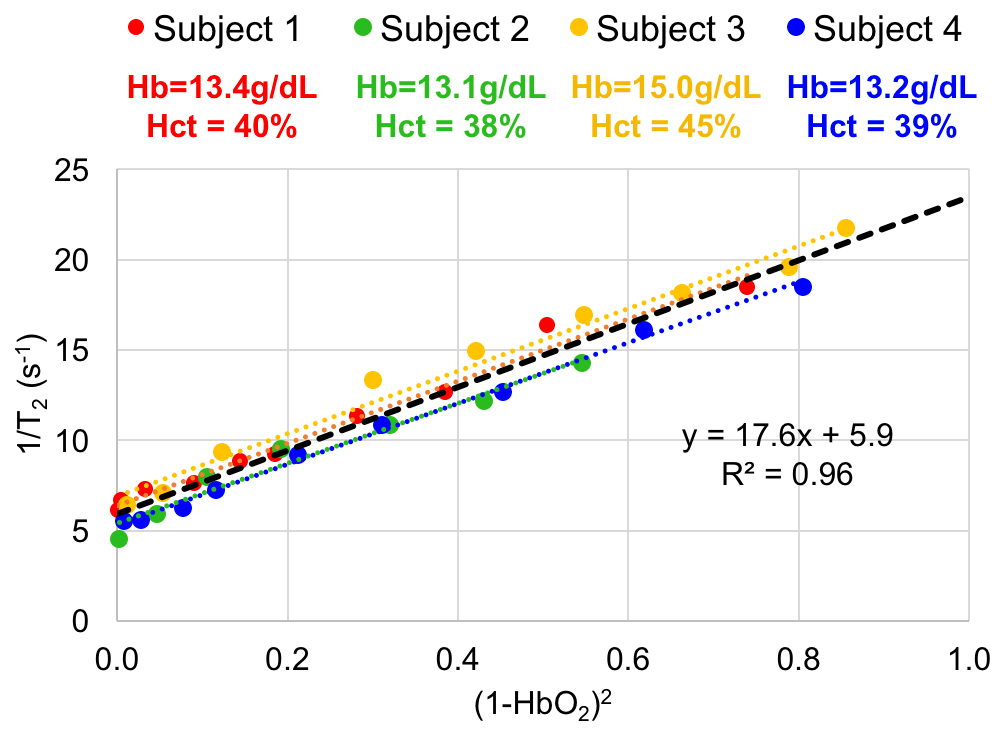
Fig. 1 shows sample images from blood oxygenated to three HbO2 levels, along with the T2 decay curves. The extracted transverse relaxation rates (1/T2) are plotted versus (1-HbO2)2 in Fig. 2. Constants K and T2o estimated by regressing the data from all 35 sample (Fig. 2, black line) were 17.6s-1 and 169ms, respectively. The same plots are also shown for the data pertaining to each participant’s samples (Fig. 2, colored lines; R2~0.96-0.99, individual T2o range: 144-187ms). Interestingly, the slopes of these lines are virtually identical. However, the vertical intercepts appear to vary slightly as a function of hemoglobin concentration.DISCUSSION
Values for both sensitivity K and T2o reported here are lower than those previously described.2 We attribute the discrepancies to the evolution of the magnetization following T2-preparation and the acquisition of k-space center for each T2-preparation TE, which for bSSFP is a function of T2 as well as T1. It is therefore essential for the calibration to be performed with the actual sequence used for T2 mapping. Furthermore, our findings suggesting T2o dependence on hemoglobin concentration are in agreement with those from Spees et al.7 who found T2o to be lower by 95ms at 40% relative to 30% hematocrit (equivalent to 13.3 versus 10.0 g/dL hemoglobin).CONCLUSION
MR oximetry based on T2-prepared bSSFP is an attractive approach for its speed and SNR efficiency. The calibration constants presented here should ensure improved accuracy for whole-blood oximetry based on this method.Acknowledgements
NIH grants U01-HD087180 and K25 HL111422 supported this work.References
1. Thulborn KR, Waterton JC, Matthews PM, Radda GK. Oxygenation dependence of the transverse relaxation time of water protons in whole blood at high field. Biochemica et Biophysica Acta 1982;714(2):265-70.
2. Wright G, Hu B, Macovski A. Estimating oxygen saturation of blood in vivo with MR imaging at 1.5T. Magn Reson Med. 1991;1:275-83.
3. Lu H, Xu F, Grgac K, Liu P, Qin Q, van Zijl P. Quantitative evaluation of oxygenation in venous vessels using T2-relaxation-under-spin-tagging MRI. Magn Reson Med. 2008;60:357-63.
4. Chen J, Pike B. Human whole blood T2 relaxometry at 3 Tesla. Magn Reson Med. 2009;61:249-54.
5. Akçakaya M, Basha TA, Weingärtner S, Roujol S, Berg S, Nezafat R. Improved quantitative myocardial T2 mapping: impact of the fitting model. Magn Reson Med. 2015;74:93-105.
6. Foltz WD, Stainsby JA, Wright GA. T2 accuracy on a whole-body imager. Magn Reson Med. 1997;38:759-68.
7. Spees WM, Yablonskiy DA, Oswood MC, Ackerman JH. Water proton MR properties of human blood at 1.5 Tesla. Magn Reson Med. 2001;45:533-42.
Figures