3728
Correction of fixation effects in post-mortem T2 measurements using a kinetic tensor model1FMRIB Centre, University of Oxford, Oxford, United Kingdom, 2Department of Neurology, University of Oxford, Oxford, United Kingdom
Synopsis
MRI of fixed post-mortem tissue can be used to relate MR signals to histopathology. However, MR relaxation parameters are altered by the process of fixation. We propose a “kinetic tensor” model that simulates the influx of fixative into the brain using diffusion tensor data, and demonstrate a correction by fitting a fixative concentration map to quantitative T2 measurements. Compared to correction methods based on distance-to-surface or isotropic diffusion, our approach captures an individual brain’s morphology and microstructure, both of which influence fixation. T2 maps corrected with the kinetic tensor model are more homogeneous than those with alternate corrections.
Purpose
To demonstrate a novel method for correcting for the effects of fixation on quantitative MRI of post-mortem tissue.
Introduction
Post-mortem MRI represents a common tissue state to histopathology and shares common signals with in-vivo MRI, and therefore is important to understanding the biological meaning of signals by providing an intermediary between in-vivo MRI and histopathology1. However, immersion of post-mortem tissue into fixative solutions alters MR properties due to changes in microstructure such as protein cross-linking. Moreover, fixative solutions typically have different MR properties compared to water, and their presence will alter endogenous tissue properties such as T2. Rates of decomposition also differ between deep and superficial tissues for immersion fixation, which requires fixative to diffuse into the tissue, resulting in a long effective post-mortem interval (PMI). This is particularly problematic for large specimens, such as human brains, which may require weeks to fix deep tissues. Thus, a prerequisite to use of post-mortem MR data is correction for the influence of fixation. We propose a novel model called Kinetic Tensor (KT) model to improve the accuracy of correction.
Methods
A post mortem human brain with motor neuron disease (68 year old, PMI 1 day, scan interval 35 days) was imaged with a Siemens 7T scanner using a 32ch Tx/Rx head coil. The brain was fixed in 10% Formalin for 35 days, then transferred to Fluorinert solution (an MR-invisible perfluorocarbon used to match susceptibility to tissue) one day before scanning. T2 maps were computed from TSE data (TE=[11,23,34,46,57,69] ms) and DTI measures were computed using DW-SSFP2 (120 directions, beff=6000 s/mm2). White matter (WM), gray matter (GM) and residual fixative were segmented using FSL FAST3.
Our goal is to develop a correction for post-mortem MRI measures, in this case quantitative T2 mapping, that accounts for variation across the brain based on spatial distributions that are consistent with the fixation process. A simple approach is considered using distance to the nearest surface as a proxy for immersion fixation; for this we use the distancemap tool in FSL. Alternatively, Dawe4 used numerical simulation of isotropic diffusivity of 8.0x10⁻⁷cm2/s, seeded from the surface of a brain mask.
Our KT model builds on Dawe’s approach using measured voxel-wise diffusion tensors in the same brain. Diffusion MRI measures the diffusivity of water in tissues; however, because the molecular weight and composition of formaldehyde (CH2O) is similar to that of water (H2O), the measured diffusion tensor of water is a good surrogate for formaldehyde. In the KT model, the diffusion process (Eq.1) is discretised for numerical simulation, with outer surface of the brain used to impose a boundary constraint. Fig.1 shows an example simulation of fixative diffusing into tissue over five days; the full correction simulated the influx of formalin over the full 35-day PMI period. To account for the period when the brain was transferred to Fluorinert before imaging, the diffusion of formalin out into Fluorinert was also simulated using the KT model with a duration of 24 hours. The resulting concentration map was then used as a linear regressor to correct T2 measurements.
Results and Discussion
Fig.2 illustrates the various approaches to correction of post-mortem MR signals. The distance-to-surface map approach is illustrated in Fig.2.a. Fig.2.b-c show the final result of the isotropic (Fig.2.b) and the KT model (Fig.2.c) simulation of the brain immersed in formalin for 35 days, then in Florinert for 24 hours prior to scanning. Effective PMI (Fig.2.d) can also be estimated by computing the time at which fixative concentration reaches 50%.
As demonstrated in Fig.3, T2 has an exponential relationship to distance-to-surface, and a linear relationship to concentration estimated from the isotropic and KT models. We calculated the global fits (green dotted line) for each correction approach and applied this fit to correct T2 values for the effects of fixation (black circles). Histograms of whole-brain T2 values show distinctive WM/GM peaks using KT correction that are obscured or less apparent after the other corrections. Table 1 illustrates that the KT-corrected T2 has lowest variance within each tissue type when expressed as percent coefficient of variation.
Uncorrected T2 maps (Fig.4.a) clearly demonstrate variation unrelated to tissue type, but consistent with how fixative would permeate large brains. While distance-to-surface correction (Fig.4.b) lowers variance within tissue types, the periventricular areas are not accurately corrected. The isotropic diffusion model (Fig.4.c) improves correction around ventricles, but has underestimated T2 in deep tissues and overestimated T2 near the surface of the brain. The anisotropic KT model (Fig.4.d), which uses the full diffusion tensor, produces the most homogeneous T2 maps.
Acknowledgements
We would like to thank the support of the Oxford Brain Bank and MRC (MR/K02213X/1)References
1. Miller KL, et al. Diffusion imaging of whole, post-mortem human brains on a clinical MRI scanner. NeuroImage, 57: 167–181, 2011.
2. Foxley S, et al. Improving diffusion-weighted imaging of post-mortem human brains: SSFP at 7T. NeuroImage, 102: 579-589, 2014.
3. Zhang, Y., Brady M. and Smith SM. Segmentation of brain MR images through a hidden Markov random field model and the expectation-maximization algorithm. IEEE Trans Med Imag, 20(1):45-57, 2001.
4. Dawe RJ et al. Postmortem MRI of human brain hemispheres: T2 relaxation times during formaldehyde fixation. Magn. Reson. Med. 61:810–818, 2009.
5. Shepherd TM, et al. Aldehyde Fixative Solutions Alter the Water Relaxation and Diffusion Properties of Nervous Tissue. Magn. Reson. Med. 62, 24–34,. 2009.
Figures
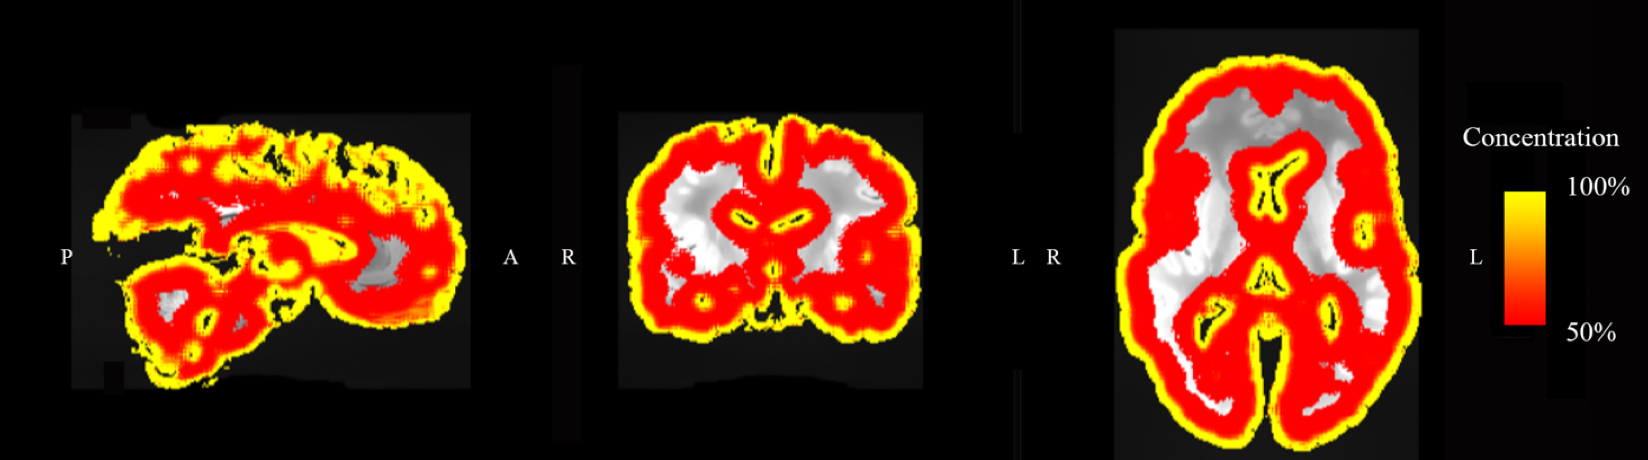
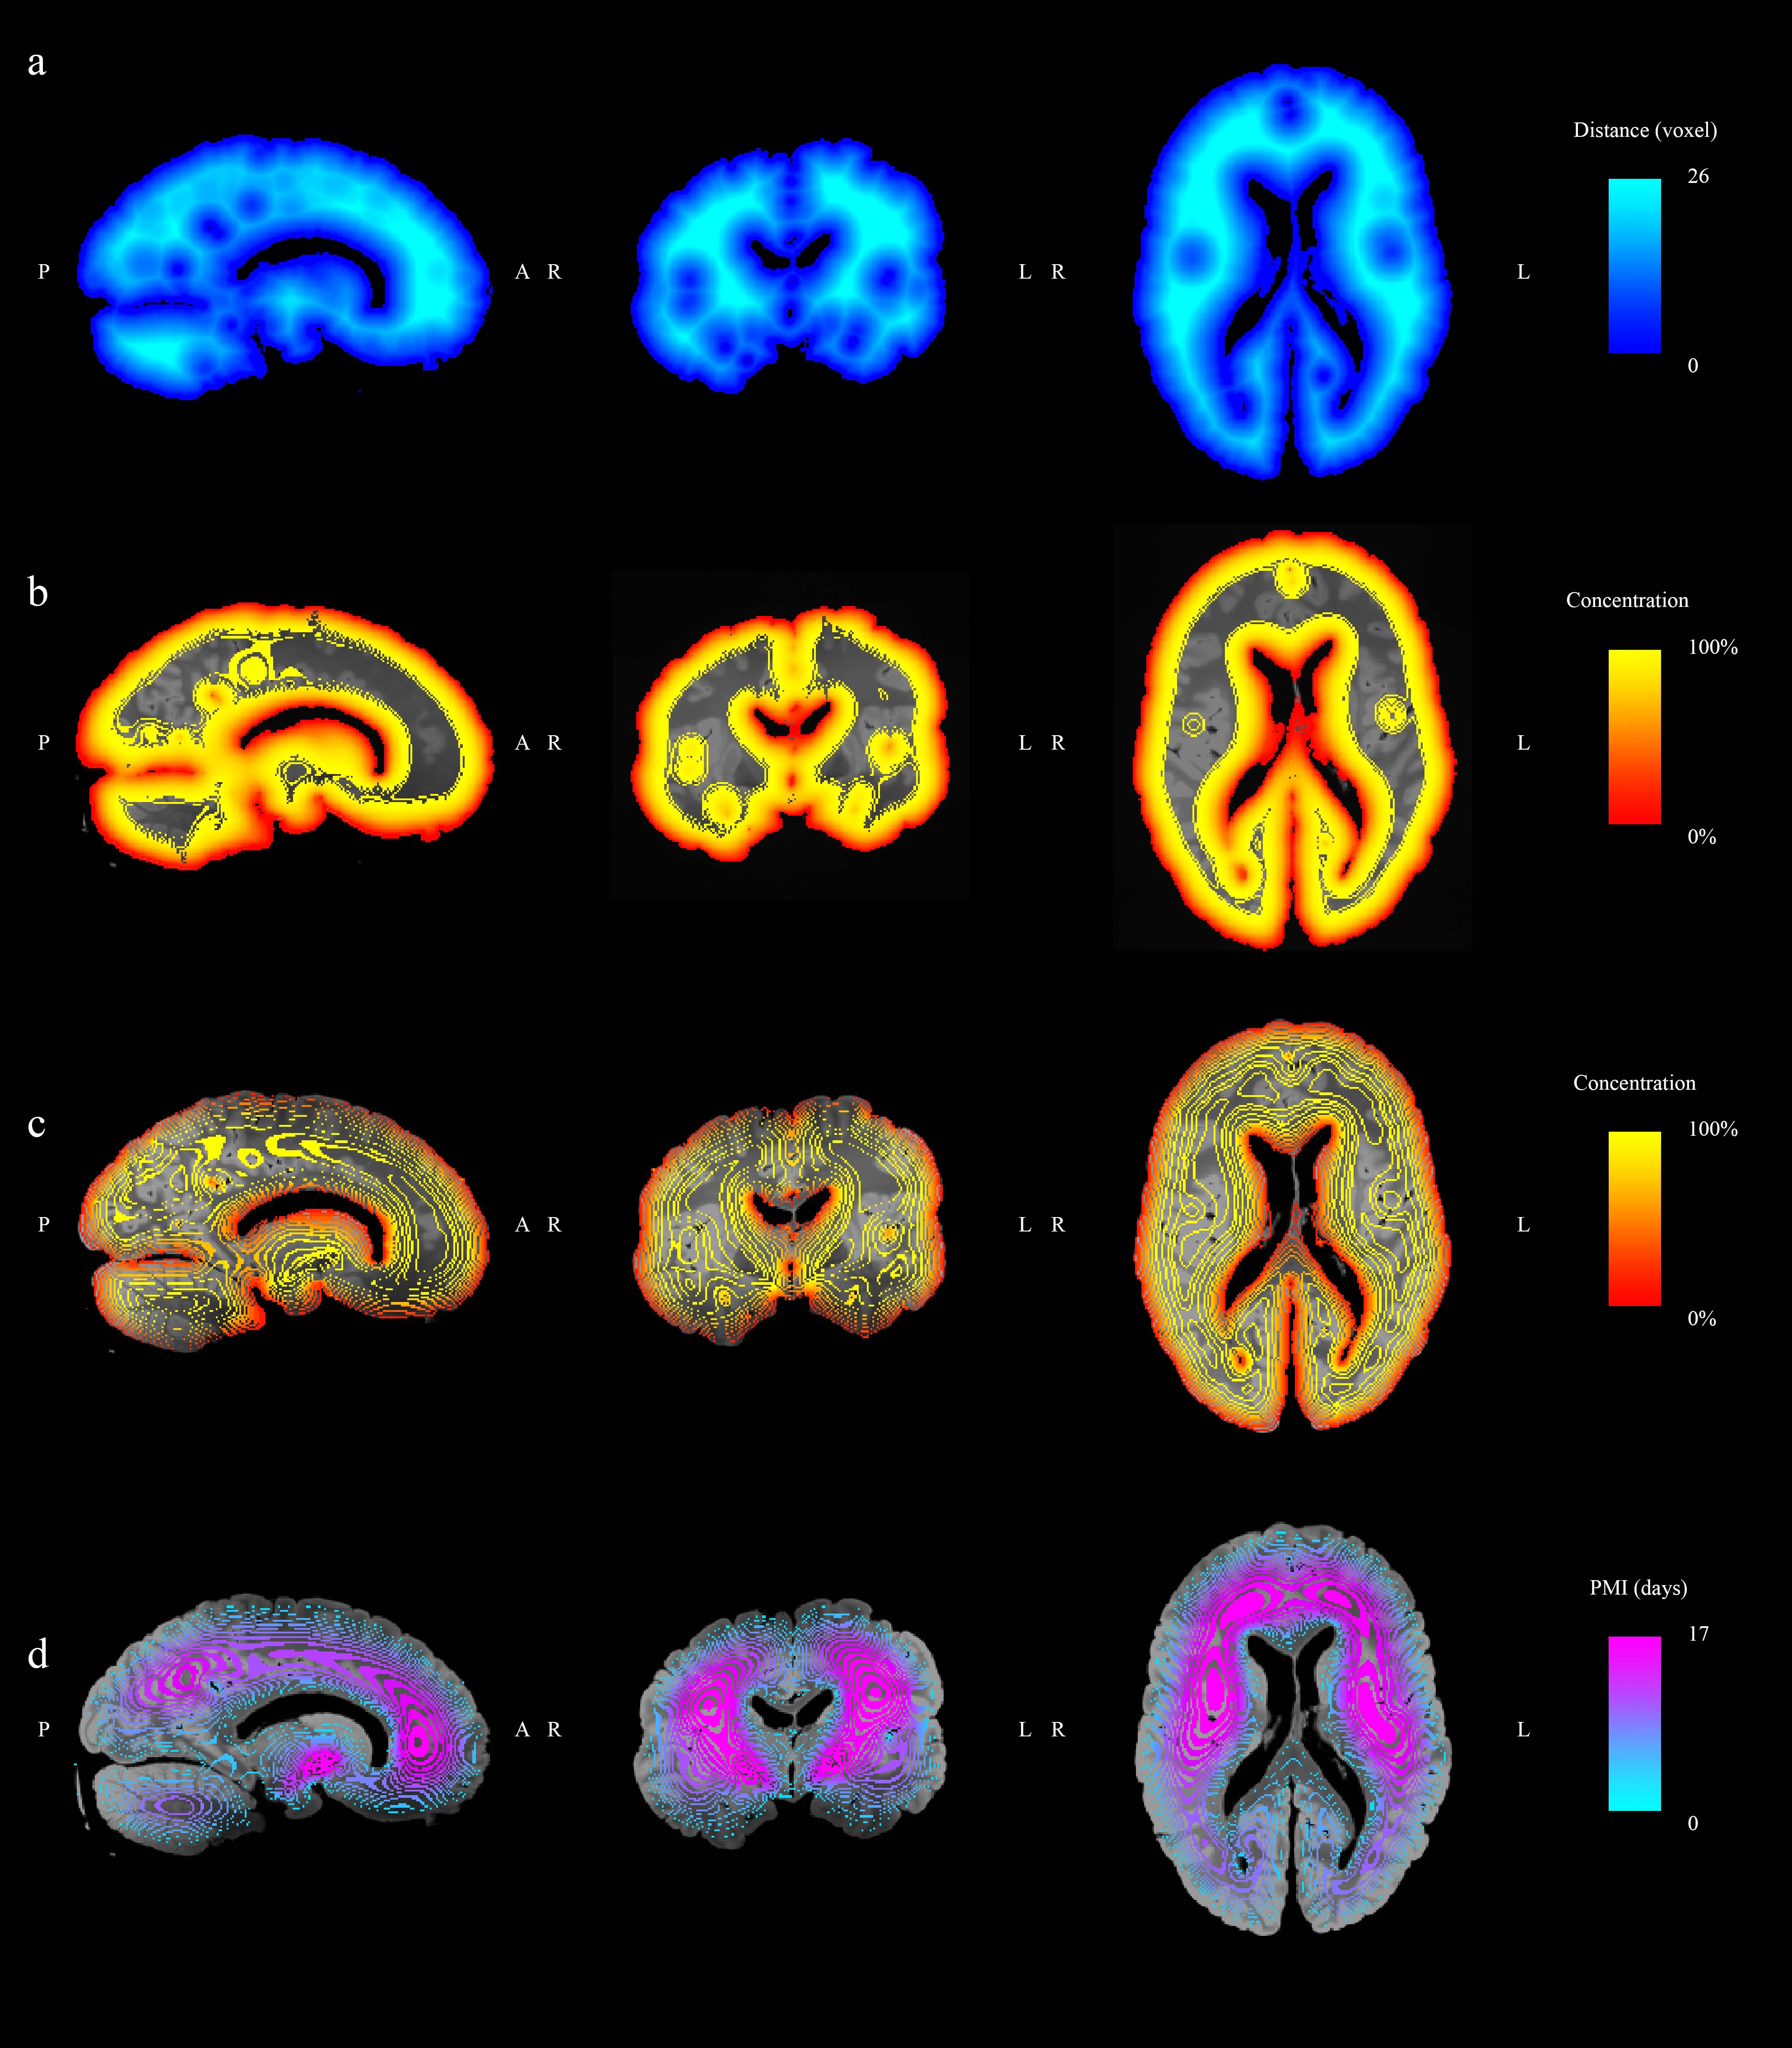
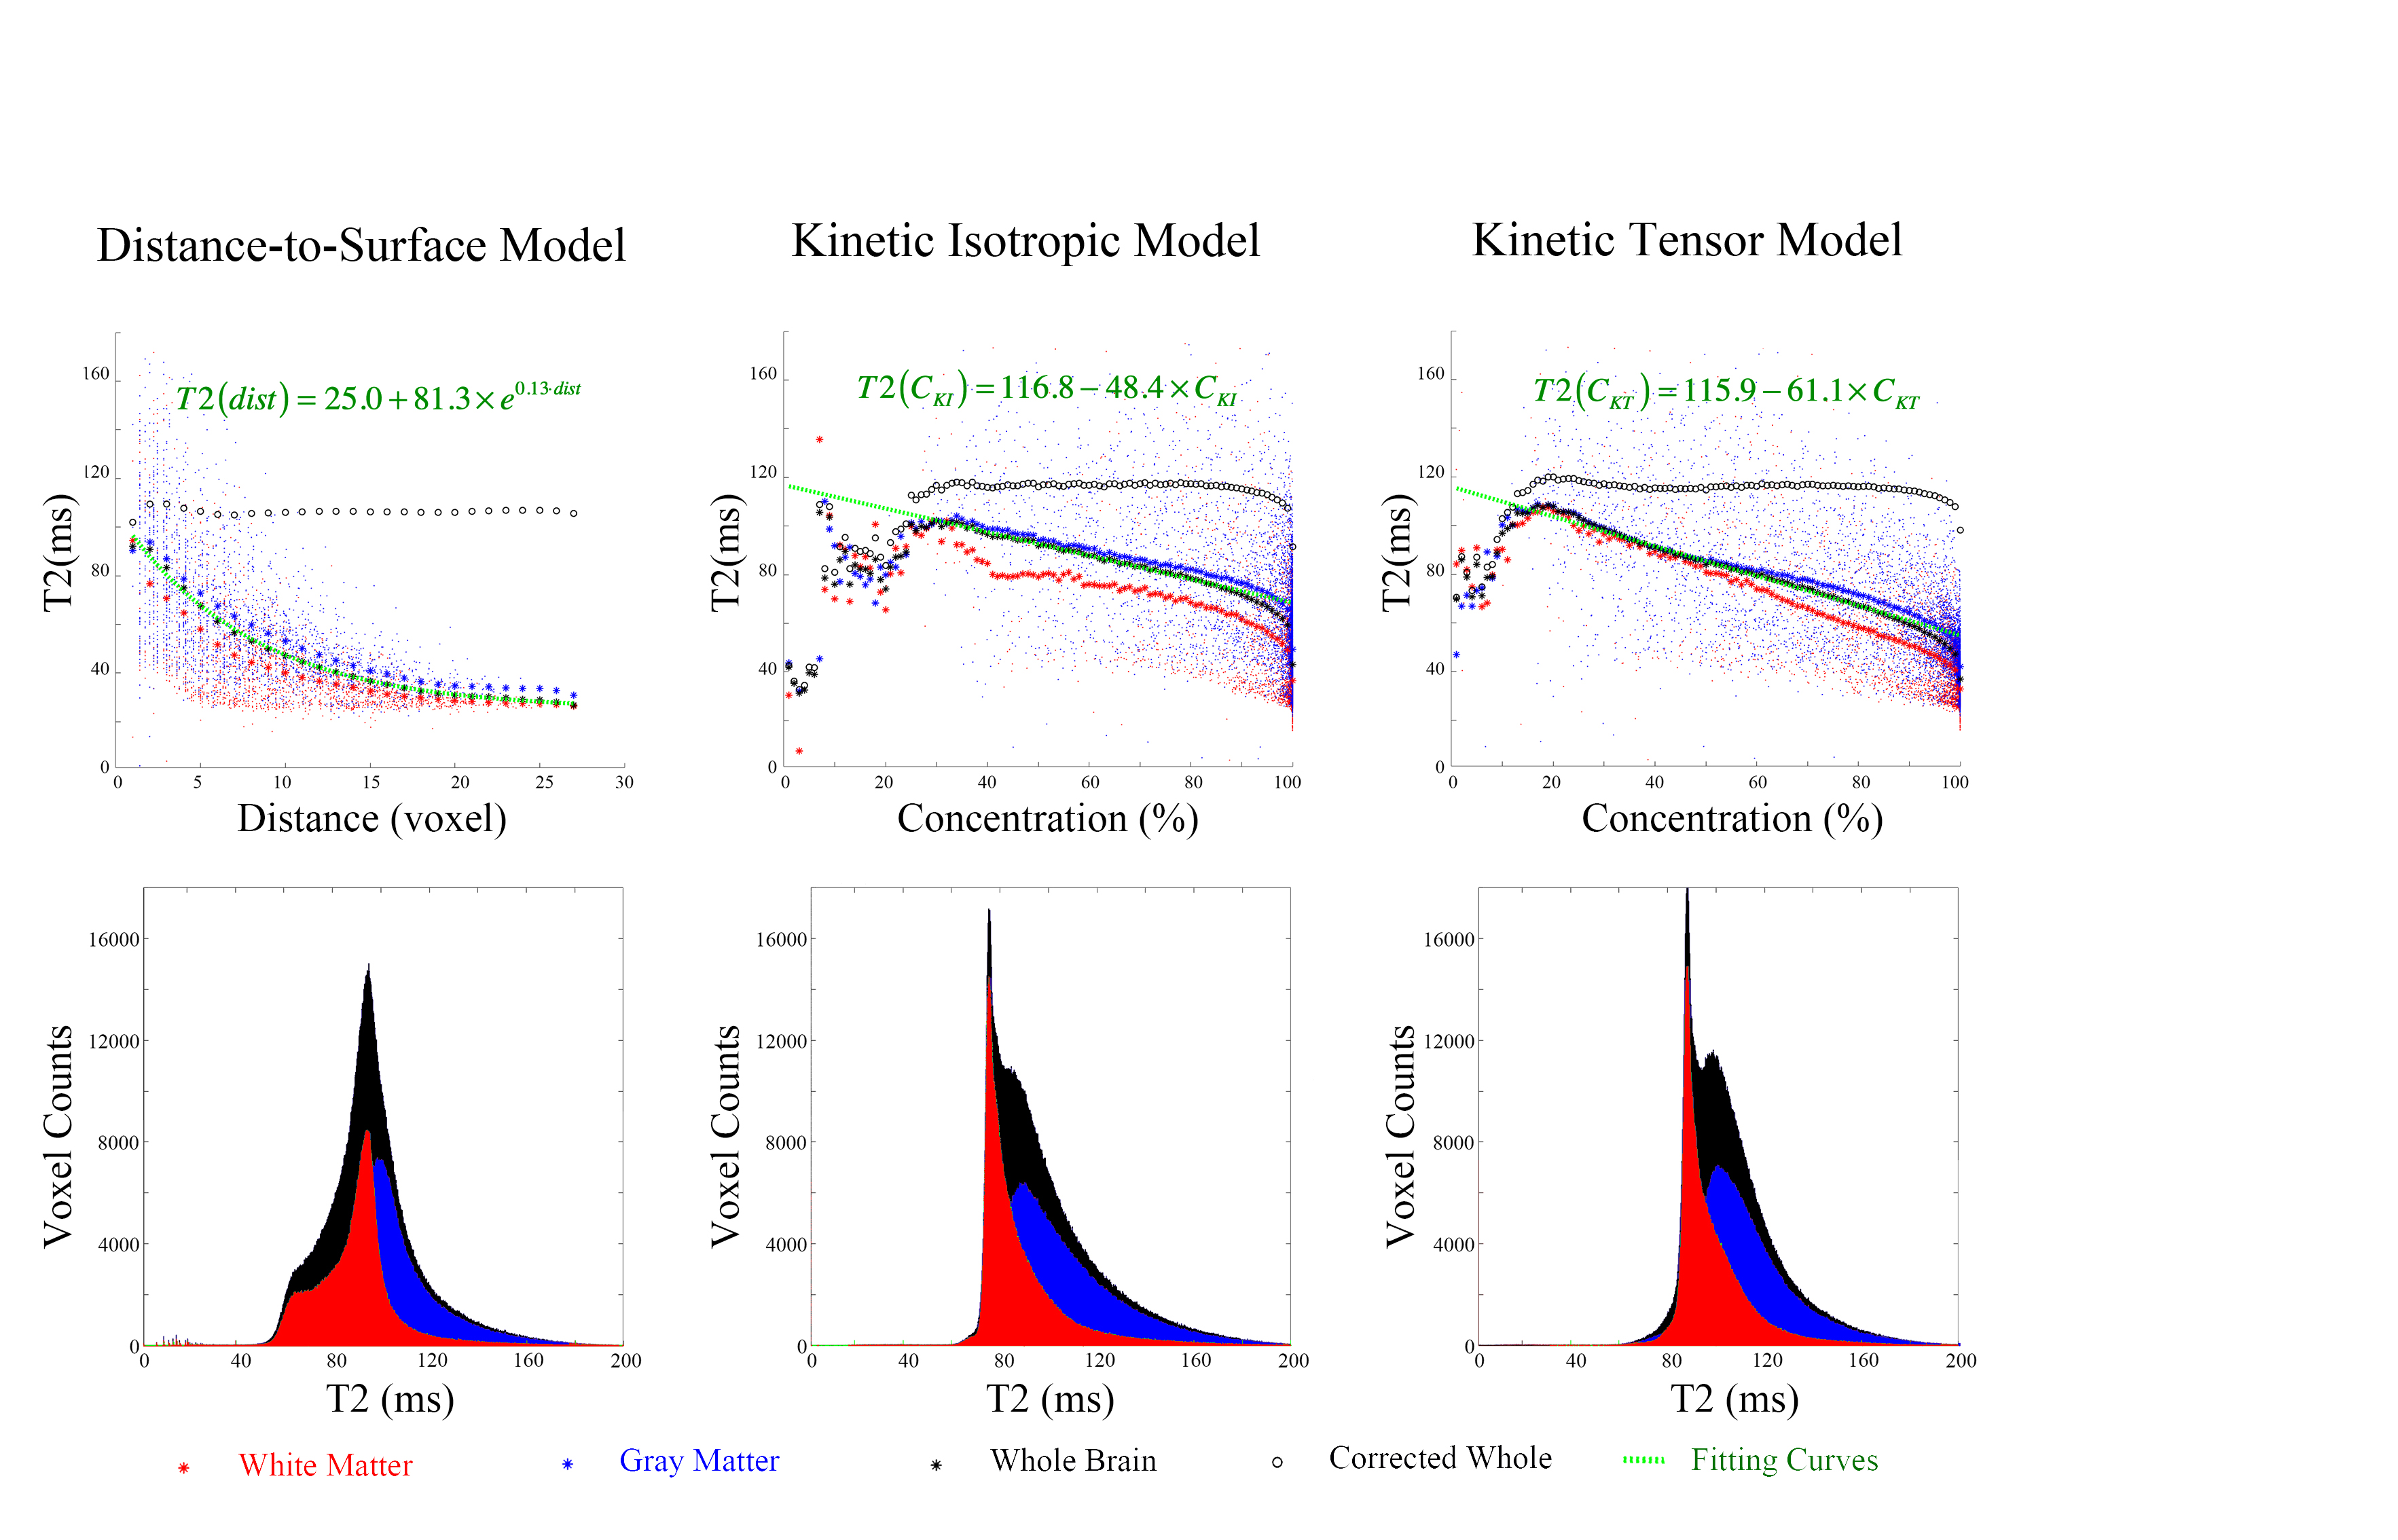
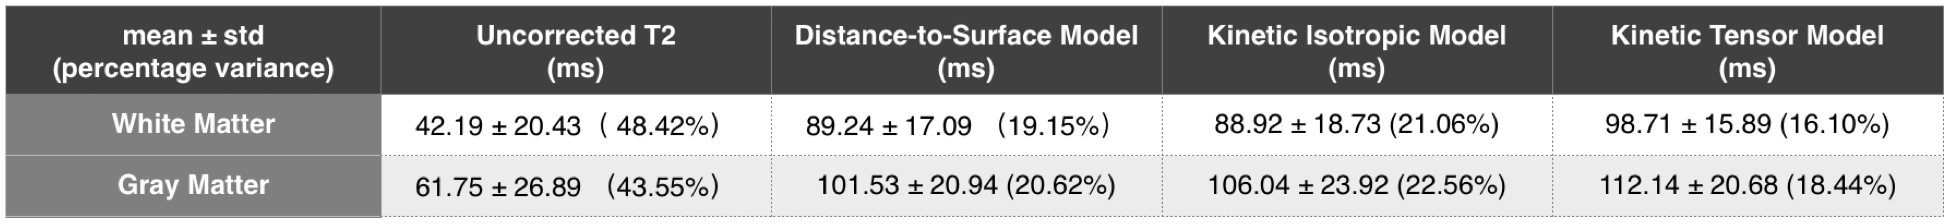
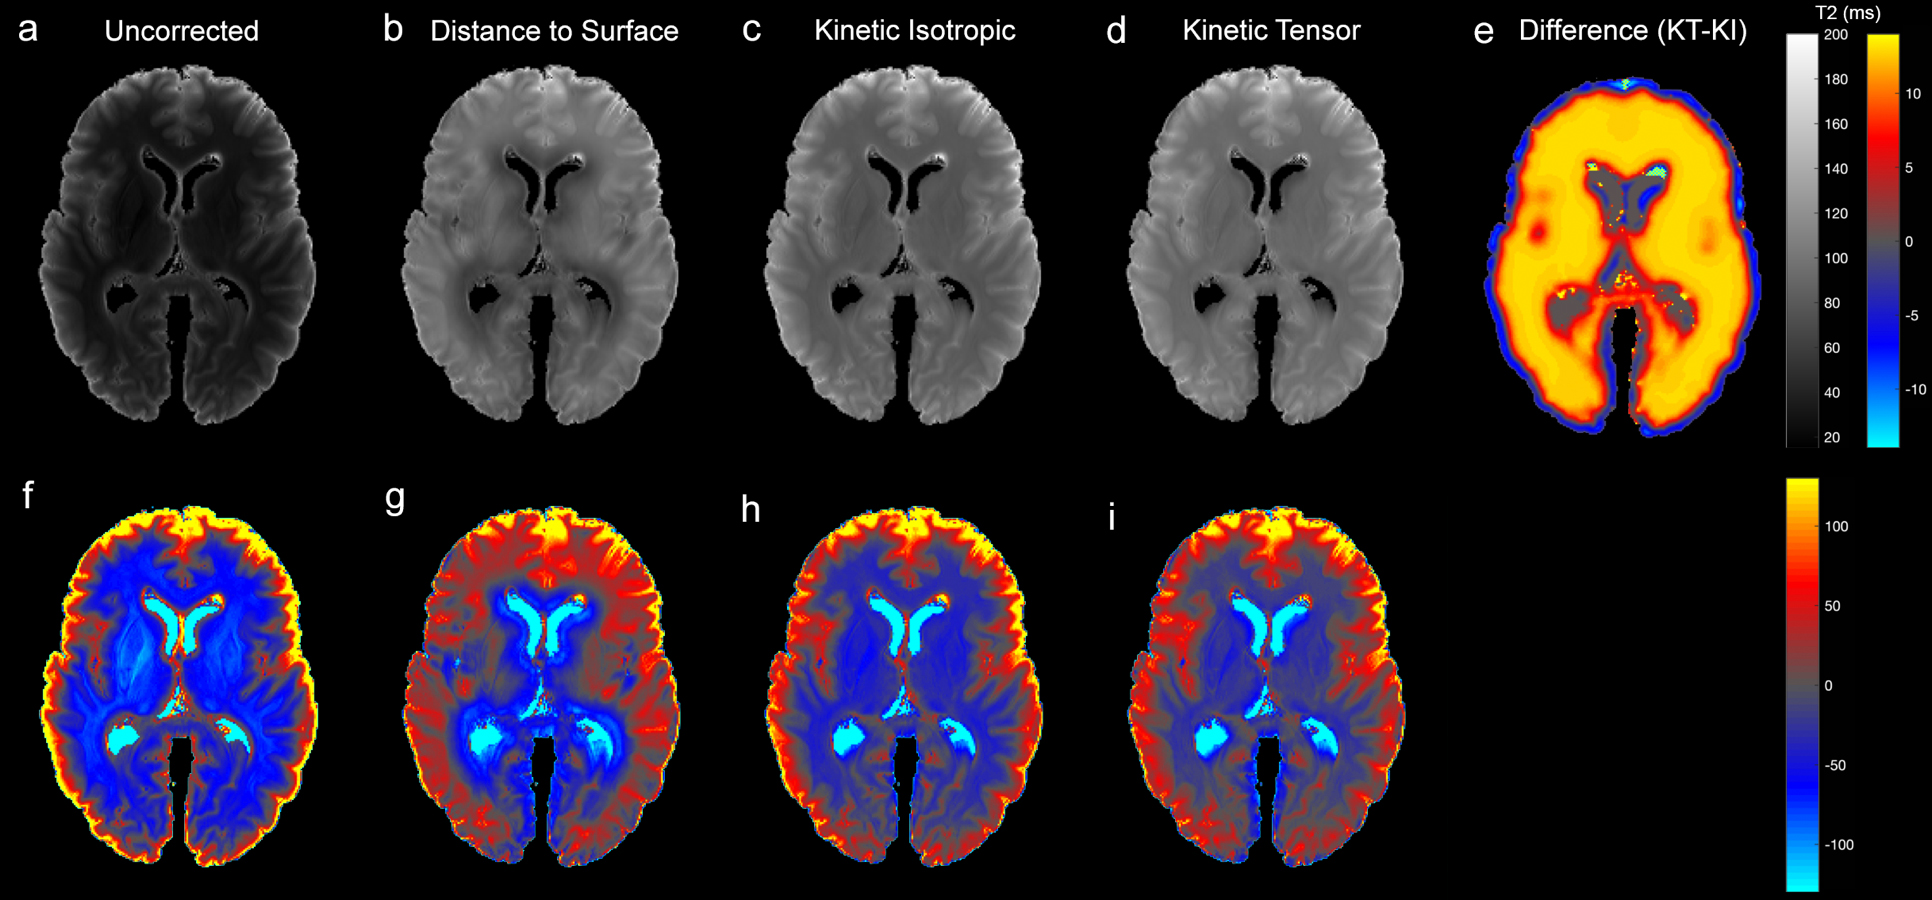
Figure 4: Comparison of post-mortem T2 maps with (a) no correction, (b) correction using distance-to-surface model, (c) using the isotropic model, and (d) using the KT model. The kinetic tensor model produces the most uniform T2 map, as seen by a sharp histogram in Fig.3 and a difference image (e), which highlights underestimation of T2 in deep structures with isotropic correction. To highlight subtle inhomogeneity in the images, (f-i) show percent deviation from mean, normalised by standard deviation, for a-d respectively.