3727
Exploring the Utility of Temporal Phase Correction in Multi-Echo T2 Relaxation at 3T1Medicine, University of British Columbia, Vancouver, BC, Canada, 2Radiology, University of British Columbia, Vancouver, BC, Canada, 3Diagnostic Imaging Services, Interior Health, Kelowna, BC, Canada, 4Computer Science, Mathematics, Physics & Statistics, University of British Columbia, Kelowna, BC, Canada, 5Pediatrics, University of British Columbia, Vancouver, BC, Canada, 6GE Healthcare, Vancouver, BC, Canada, 7Pathology & Laboratory Medicine, University of British Columbia, Vancouver, BC, Canada, 8International Collaboration on Repair Discoveries, University of British Columbia, Vancouver, BC, Canada, 9Physics and Astronomy, University of British Columbia, Vancouver, BC, Canada
Synopsis
T2 relaxation using combined gradient and spin echo (GRASE) is a fast and robust approach for myelin water imaging in vivo. For long echo trains, when the noise floor is reached, the magnitude signal will converge towards a non-zero mean due to the Rician noise characteristics of the magnitude data. This can give rise to artificial long-T2 components in analysis. In this study we employed temporal phase correction to multi-echo GRASE data and showed that for echo trains longer than 300ms, phase correction will effectively reduce artificial long-T2 components, thus improving the ability to interpret the T2 distribution.
Introduction and Motivation
Multi-echo T2 relaxation is a popular method for myelin water imaging (MWI) in vivo in brain and spinal cord.1 To obtain a T2-distribution, the decay of the magnitude data is analyzed with a non-negative least squares (NNLS) algorithm.2 Components with T2<40ms yields the myelin water fraction (MWF), linked to myelin content,3 and T2 between 40-200ms represents the intra-extracellular (IE) water. Sometimes a signal with T2 between 200-800ms is observed; this long T2 fraction (LT2F), has provided interesting information in diseases such as multiple sclerosis and phenylketonuria.4,5 Beyond 800ms we can find a T2 component commonly attributed to cerebrospinal fluid (CSF). However, at long echo times the noise of the magnitude data approaches a Rayleigh distribution which has a non-zero mean.6 This non-zero component will give rise to artificial long T2-components that can be misinterpreted as CSF. To resolve this problem, phase corrected real data, which has a Gaussian noise distribution, can be used.7,8 Previous studies have used phase correction for a variable TE spin-echo sequence at 1.5T to capture short T2-components (myelin water) as well as to characterize the noise floor accurately.7 The purpose of this study is to perform phase correction on multi-echo T2-relaxation data collected with parallel imaging at 3T using a gradient and spin echo (GRASE) sequence.Methods
Two different GRASE sequences were acquired for a healthy volunteer (male, age 24 years) on a 3T Philips Achieva scanner using an 8-channel head coil: [1] GRASE32: 32 echoes, TE/TR=10/1000ms, 20 slices, resolution=1x0.85x5mm3, and [2] GRASE64: 64 echoes, TE/TR=15/1640ms, 20 slices, resolution=1x1.7x5mm3.9,10 The longer TR for GRASE64 is to ensure equivalent effective TR (time from the final refocusing pulse to subsequent excitation) for both GRASE sequences. A 3D gradient-echo T1-weighted scan (TR/TE=7.8/3.5ms, 170 slices, resolution=1x1x1mm3) was also acquired for manual delineation of regions of interest (ROI).
Phase correction was performed using the temporal phase correction (TPC) method proposed by Bjarnason et al.7 Magnitude and phase corrected real data were analyzed using regularized NNLS with stimulated echo correction2 to produce maps of the MWF, geometric mean T2 of intra-extracellular T2 peak (IET2), and the fraction of the very long T2-distribution with T2>800ms (vLT2F). To accurately quantify the T2-signal from myelin a short echo spacing ($$$\leq$$$10ms) is recommended,11 thus MWF values were not calculated for the GRASE64 sequence.
Whole brain white matter was segmented from the 3DT1 using FSL-FAST.12 Seven bilateral white matter (WM) and gray matter (GM) ROIs were defined on the 3DT1. Significant differences between uncorrected and phase corrected data for each ROI were assessed with a t-test using the standard deviation of the contralateral means for each ROI.
Results
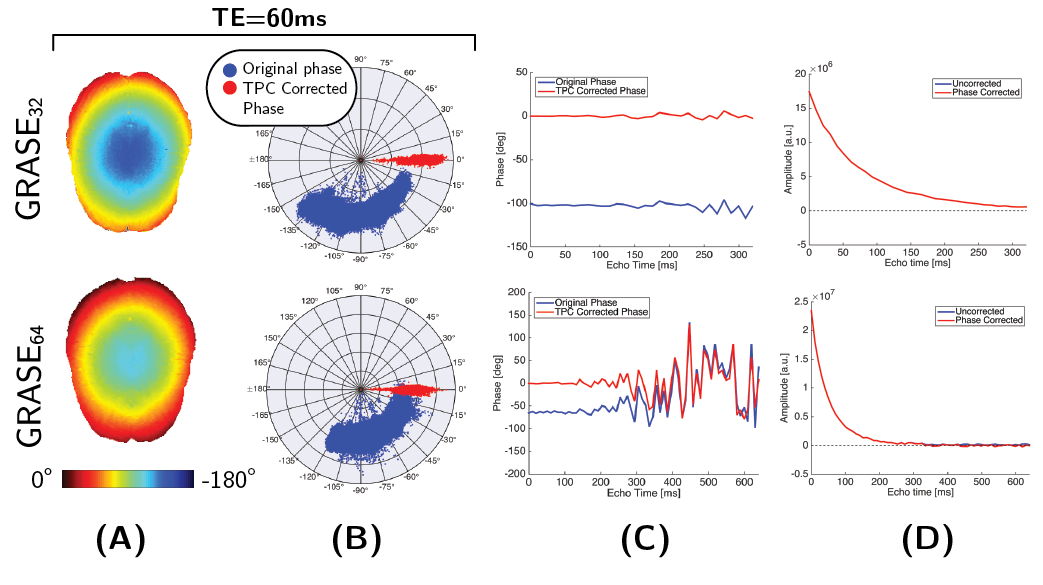
Figure 1 shows an example of the smooth spatial phase distribution from the uncorrected GRASE32 and GRASE64 data at TE=60ms and how the phase distribution is scattered around the real axis after phase correction. The phase in Figure 1C shows a linear evolution up until TE$$$\approx$$$300ms; at this point the noise floor is reached (Figure 1D) and the noise in the phase signal increases.
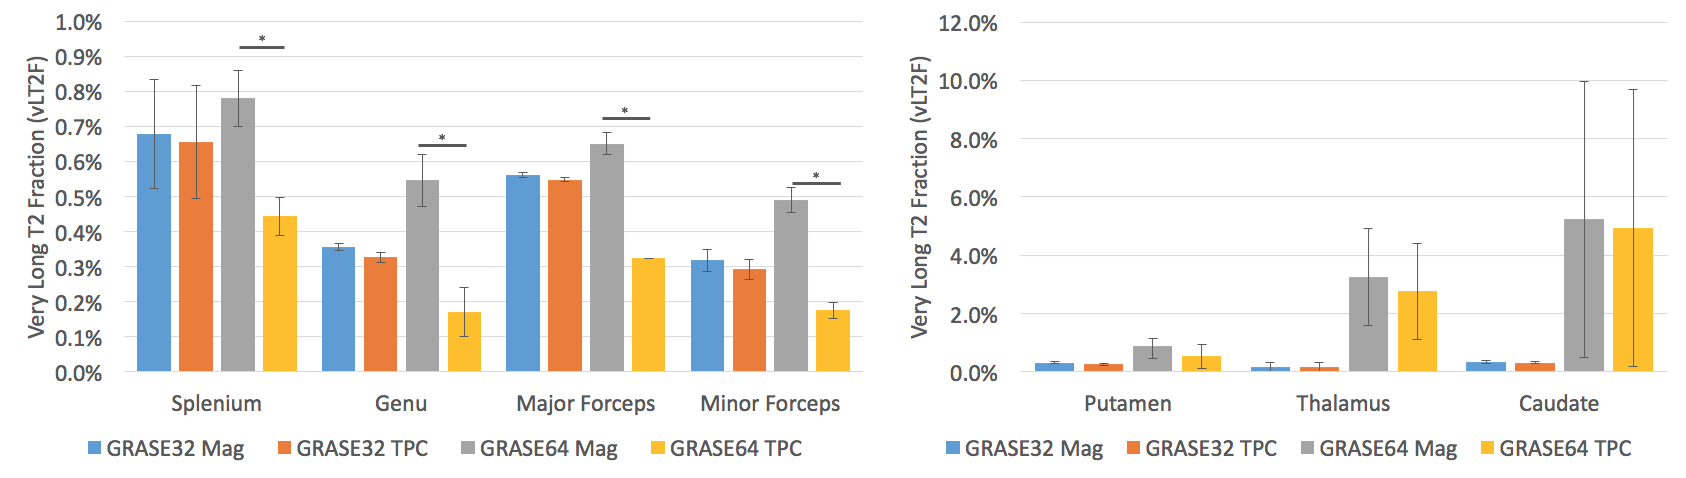
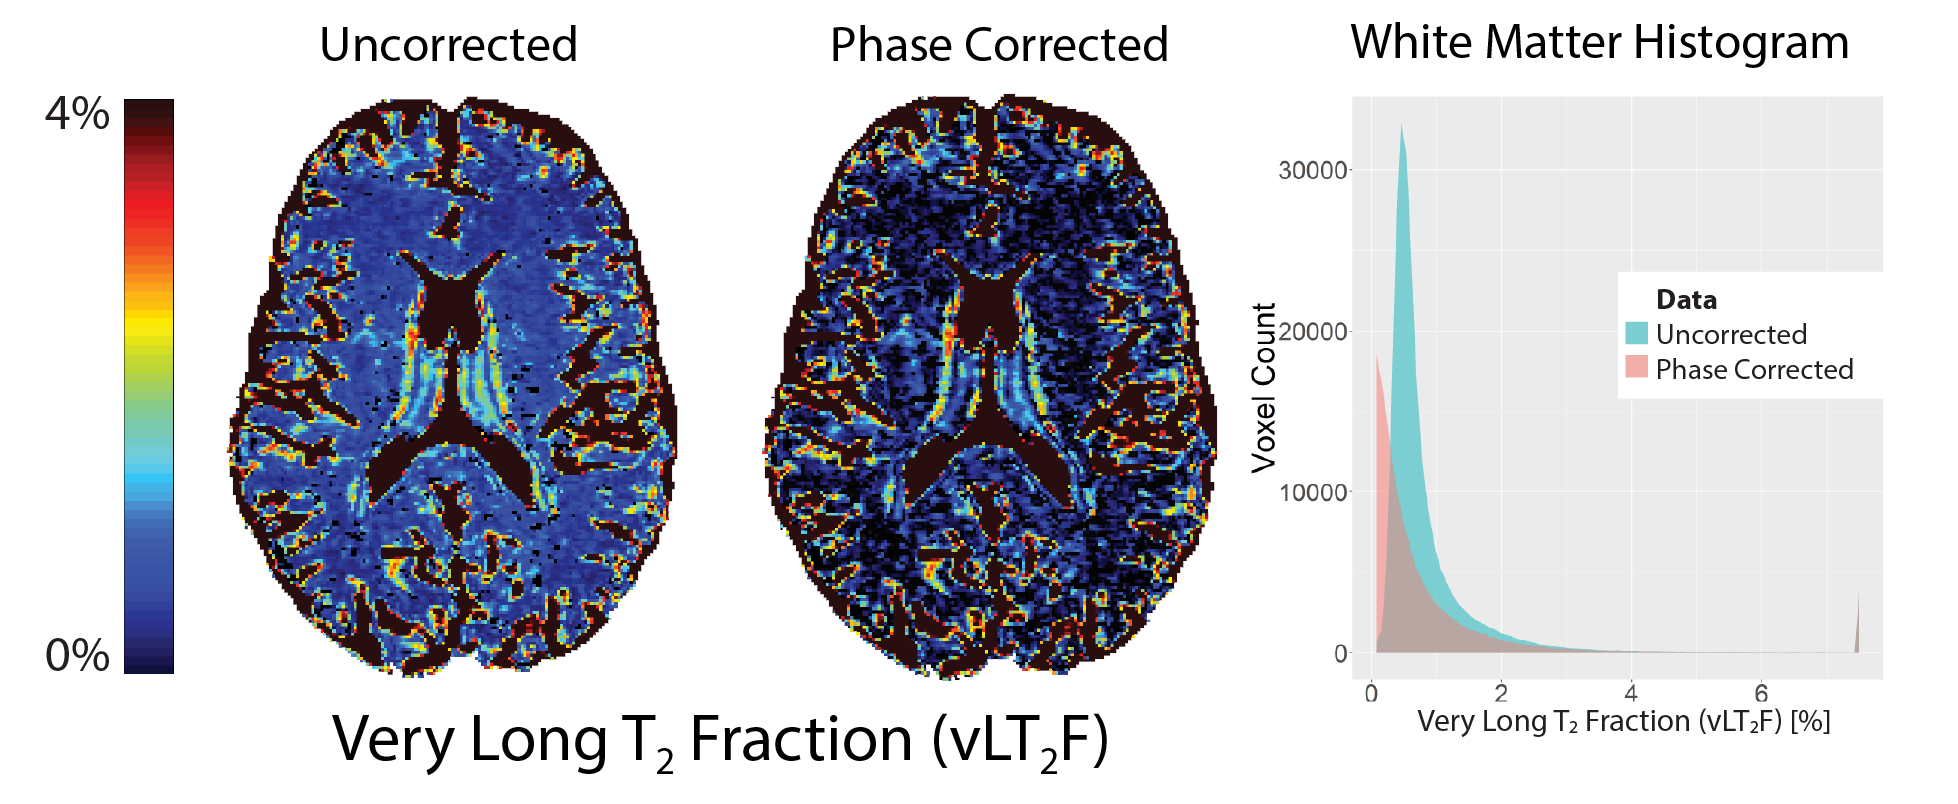
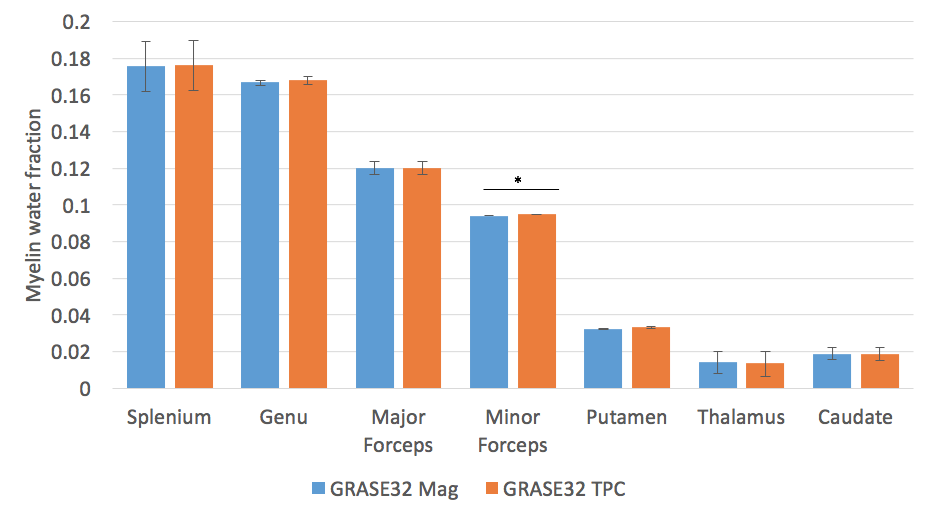
No significant change in IET2 was observed after phase correction for either of the sequences (p>0.1, two-tailed t-test). After phase correction, the vLT2F from GRASE64 was significantly decreased (p<0.05, one-tailed t-test, average decrease = 0.34%) for all WM ROIs (Figure 2). This is also seen in the quantitative vLT2F map and the whole brain WM histogram (Figure 3). A significant increase in MWF was found only in minor forceps (p<0.05, two-tailed t-test, increase=0.08%,) (Figure 4).
Discussion and Conclusion
Results from the present study suggest that phase correction is non-essential for a 32 echo GRASE sequence with 10ms echo spacing. With GRASE64, the noise floor was reached after half of the echo train and the non-zero mean of the Rician noise gave rise to an artificial long T2 component, which was significantly reduced in WM using temporal phase correction. By sampling the noise floor in the late echoes of GRASE64 we were able to reduce the vLT2F below that of the GRASE32 using phase correction.
Results from the present study suggest that a GRASE sequence with the ability to characterize both myelin water and the noise floor, i.e. short TE for early echoes and longer TE for late echoes, would benefit from phase correction. Such a variable TE approach has been successfully used with a spin echo sequence at 1.5T,7 but has not yet been implemented for GRASE at 3T. By reducing the Rician noise floor, we improve the biological specificity of the T2-distribution, leading to more accurate estimates of the MWF and LT2F.
Acknowledgements
This study was supported by the Milan & Maureen Ilich Foundation.References
1. Mackay, A. et al. In vivo visualization of myelin water in brain by magnetic resonance. Magn. Reson. Med. 31, 673–677 (1994).
2. Prasloski, T., Mädler, B., Xiang, Q. S., MacKay, A. & Jones, C. Applications of stimulated echo correction to multicomponent T2 analysis. Magn. Reson. Med. 67, 1803–1814 (2012).
3. Laule, C. et al. Myelin water imaging of multiple sclerosis at 7T: Correlations with histopathology. Neuroimage 40, 1575–1580 (2008).
4. Laule, C. et al. MR Evidence of Long T2 Water in Pathological White Matter. J. Magn. Reson. Imaging 26, 1117–1121 (2007).
5. Laule, C. et al. Long T2 water in multiple sclerosis: What else can we learn from multi-echo T2 relaxation? J. Neurol. 254, 1579–1587 (2007).
6. Gudbjartsson, H. & Patz, S. The Rician distribution of noisy MRI data. Magn. Reson. Med. 34, 910–914 (1995).
7. Bjarnason, T. A., Laule, C., Bluman, J. & Kozlowski, P. Temporal phase correction of multiple echo T2 magnetic resonance images. J. Magn. Reson. 231, 22–31 (2013).
8. Bjork, M. & Stoica, P. New approach to phase correction in multi-echo T2 relaxometry. J. Magn. Reson. 249, 100–107 (2014).
9. Prasloski, T. et al. Rapid whole cerebrum myelin water imaging using a 3D GRASE sequence. Neuroimage 63, 533–539 (2012).
10. Zhang, J. et al. Advanced Myelin Water Imaging Techniques for Rapid Data Acquisition and Long T2 Component Measurements. in Proc. Intl. Soc. Mag. Reson. Med 23 824 (2015).
11. Graham, S. J., Stanchev, P. L. & Bronskill, M. J. Criteria for Analysis of Multicomponent Tissue T2 Relaxation Data. Magn. Reson. Med. 35, 370–378 (1996).
12. Zhang, Y., Brady, M. & Smith, S. Segmentation of brain MR images through a hidden Markov random field model and the expectation-maximization algorithm. Med. Imaging, IEEE Trans. 20, 45–57 (2001).
Figures