3726
Approaching the Limits of Imaging Brain Tissue with Ultra Short T21JABSOM, University of Hawai'i, Honolulu, HI, United States, 2JABSOM, University of Hawai'i
Synopsis
A 3D radial UTE sequence optimized for the selective detection of fast relaxing tissue in the range of 500-60 μs using a composite hard pulse is presented. Its imaging properties on a T2-phantom are analyzed and used for the discussion of human brain images.
Introduction
Direct MRI of myelin with ultra short transverse relaxation times below 500 μs (1) has a large potential as a diagnostic marker for diseases such as multiple sclerosis or Alzheimer's (2). This study was aimed to develop a method that specifically targets this extreme regime of ultra short T2 and test its implications for direct myelin imaging. Besides the importance of a minimal TE and readout times, the choice of RF pulse design is also crucial. Half pulses, which are frequently used in UTE imaging (3), require a minimum duration to guarantee a well defined slice profile. However this pulse duration exceeds the desired T2 values and efficient slice selective excitation is no longer achievable (4). Hard pulses on the other hand can be applied with a far shorter pulse length and enable the generation of MR signal with significantly shorter T2 values. In this study we present the application of "back and forth" composite hard pulses previously described by Johnson et al. (5) as an effective way to obtain T2 selective excitation of brain tissue with T2 values well below 100 μs.Methods
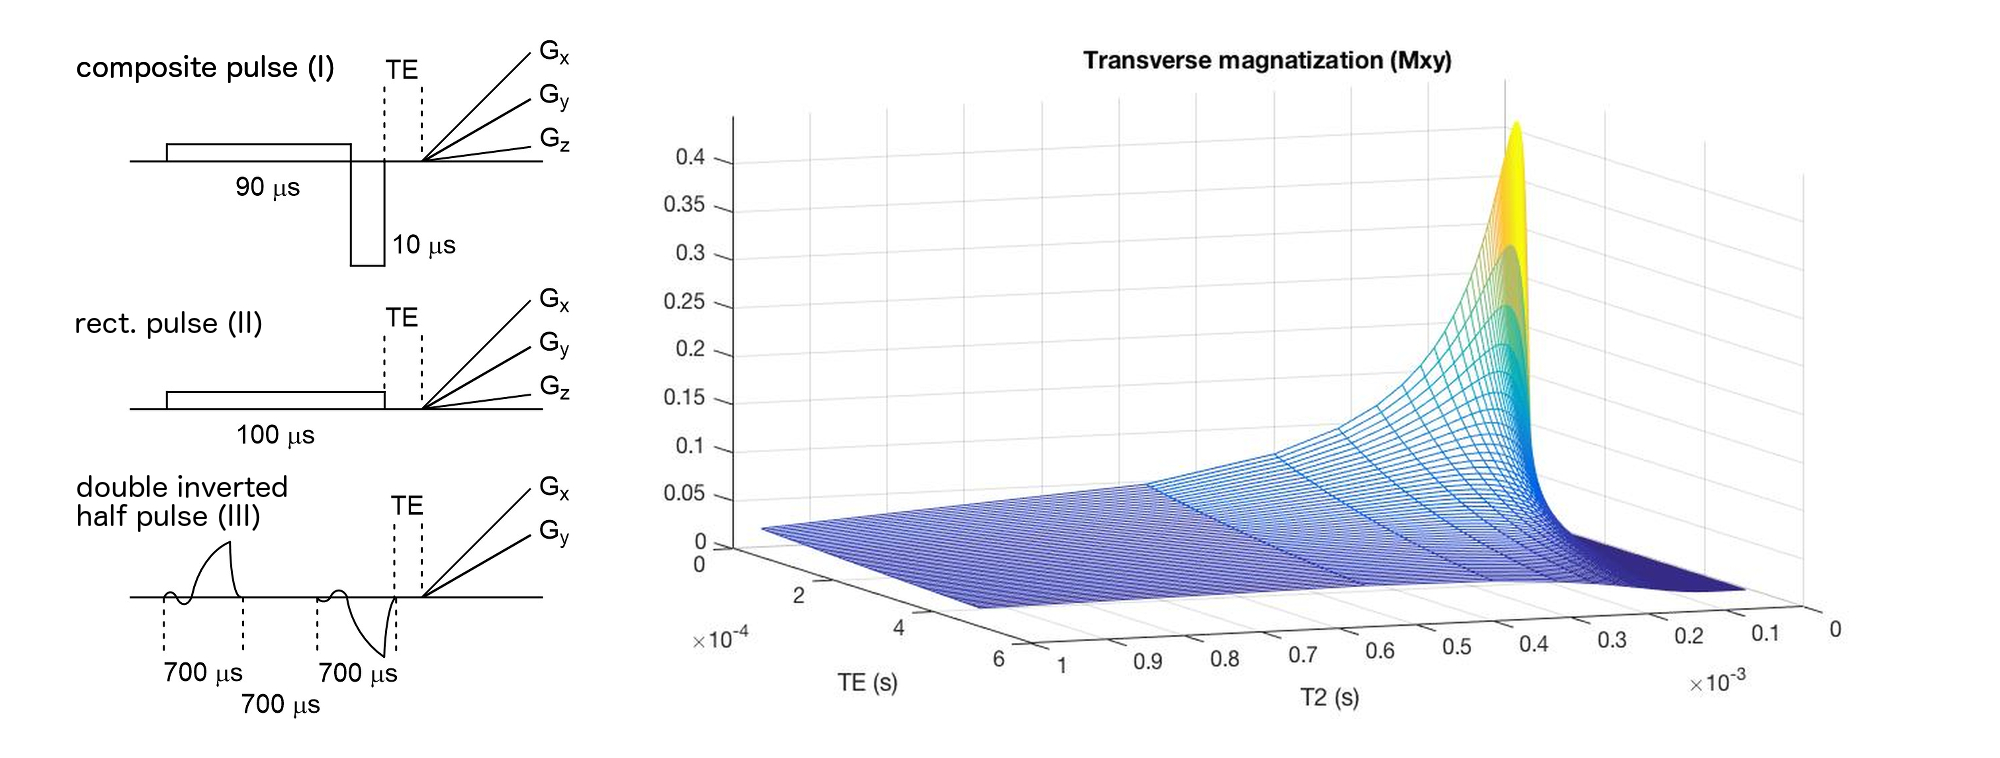
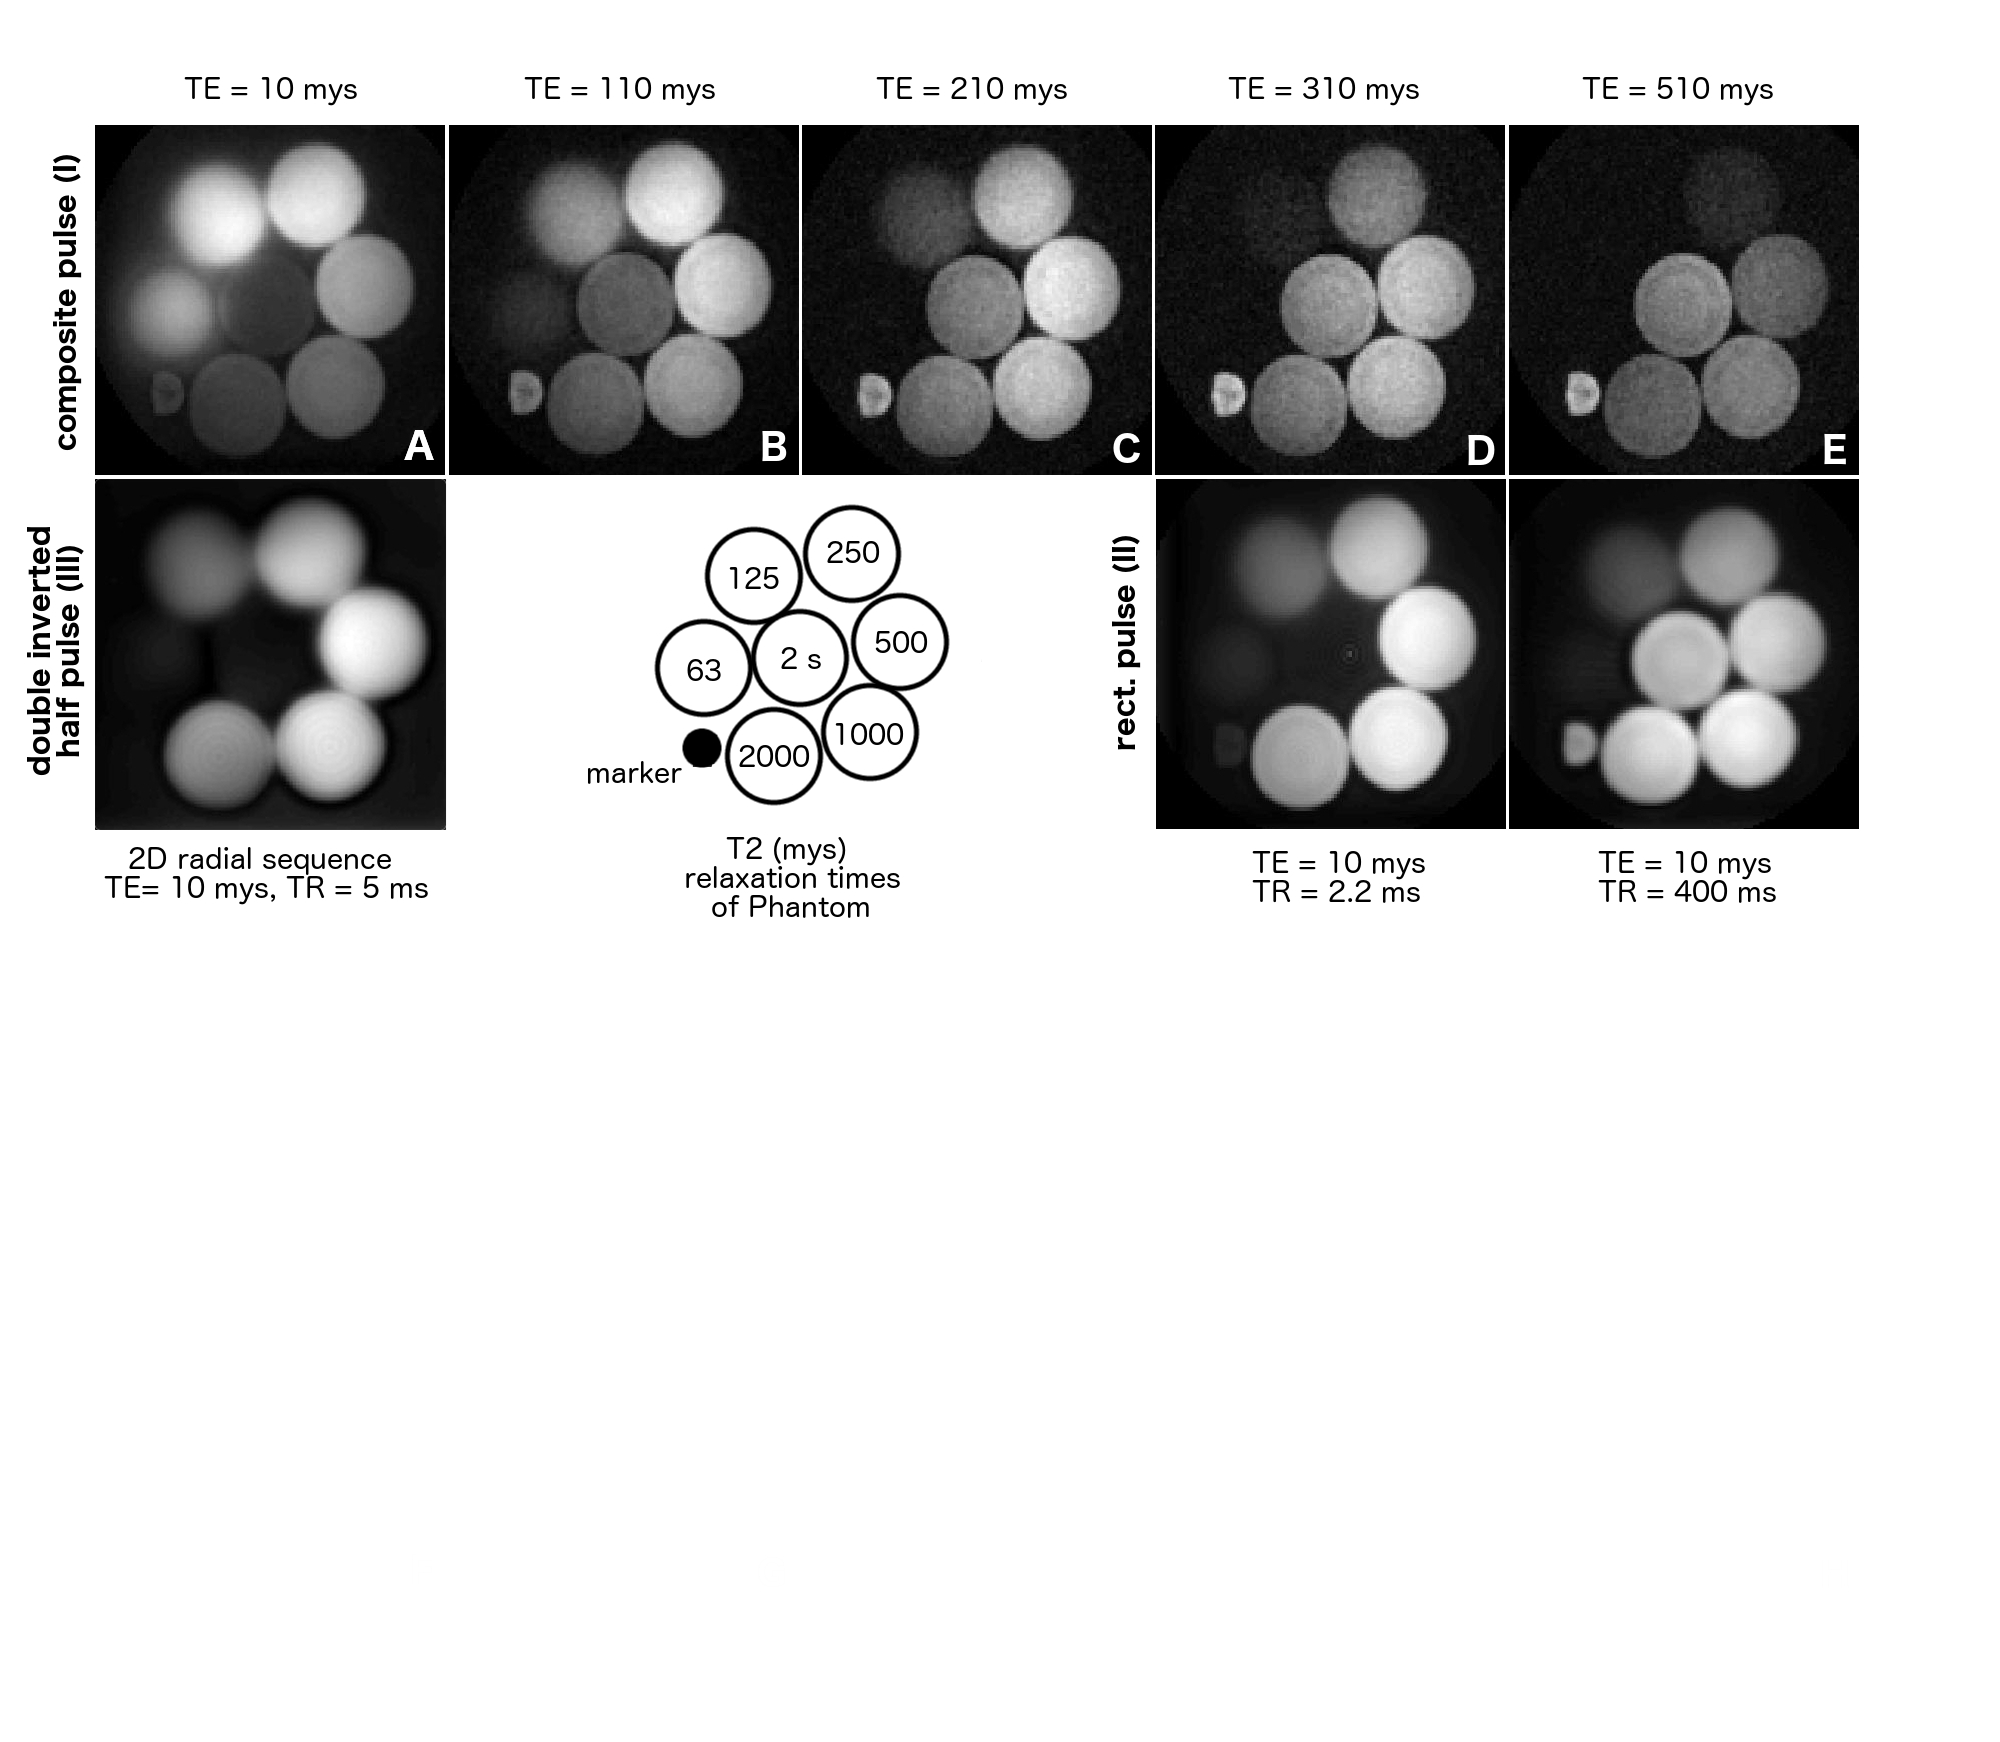
The parameters for the RF pulses were optimized using a Block equation simulation of the excitation profile for different T2 values in Matlab (Mathworks, Natick, MA) and were tested on a phantom containing differently concentrated aqueous MnCl2 solutions (208 mM, 104 mM, 52 mM, 26 mM, 13 mM, 6.5 mM and water). The composite pulse (I) is composed of two rectangular pulses with equivalent areas and opposite phase, a longer 90 μs followed by a short 10 μs section (Figure 1). Measurements were performed on a Siemens Tim Trio 3T (Erlangen, Germany) scanner equipped with a 4-channel head coil. Data was acquired with an under sampling factor of approx. 4 (50 000 interleaves) over 24 cm FOV with a 128x128 matrix size using a 3D radial sequence with TE of 10 μs, TR of 2.2 ms, a readout of 440 μs and gradient spoiling. Image were obtained using a generalized reconstruction method (6,7). The k-space trajectories and data were inserted directly into the signal equation and solved numerically using a non-uniform Fast Fourier Transform within a regularized conjugate gradient algorithm. All reconstructions were performed offline using Matlab.Results and Discussion
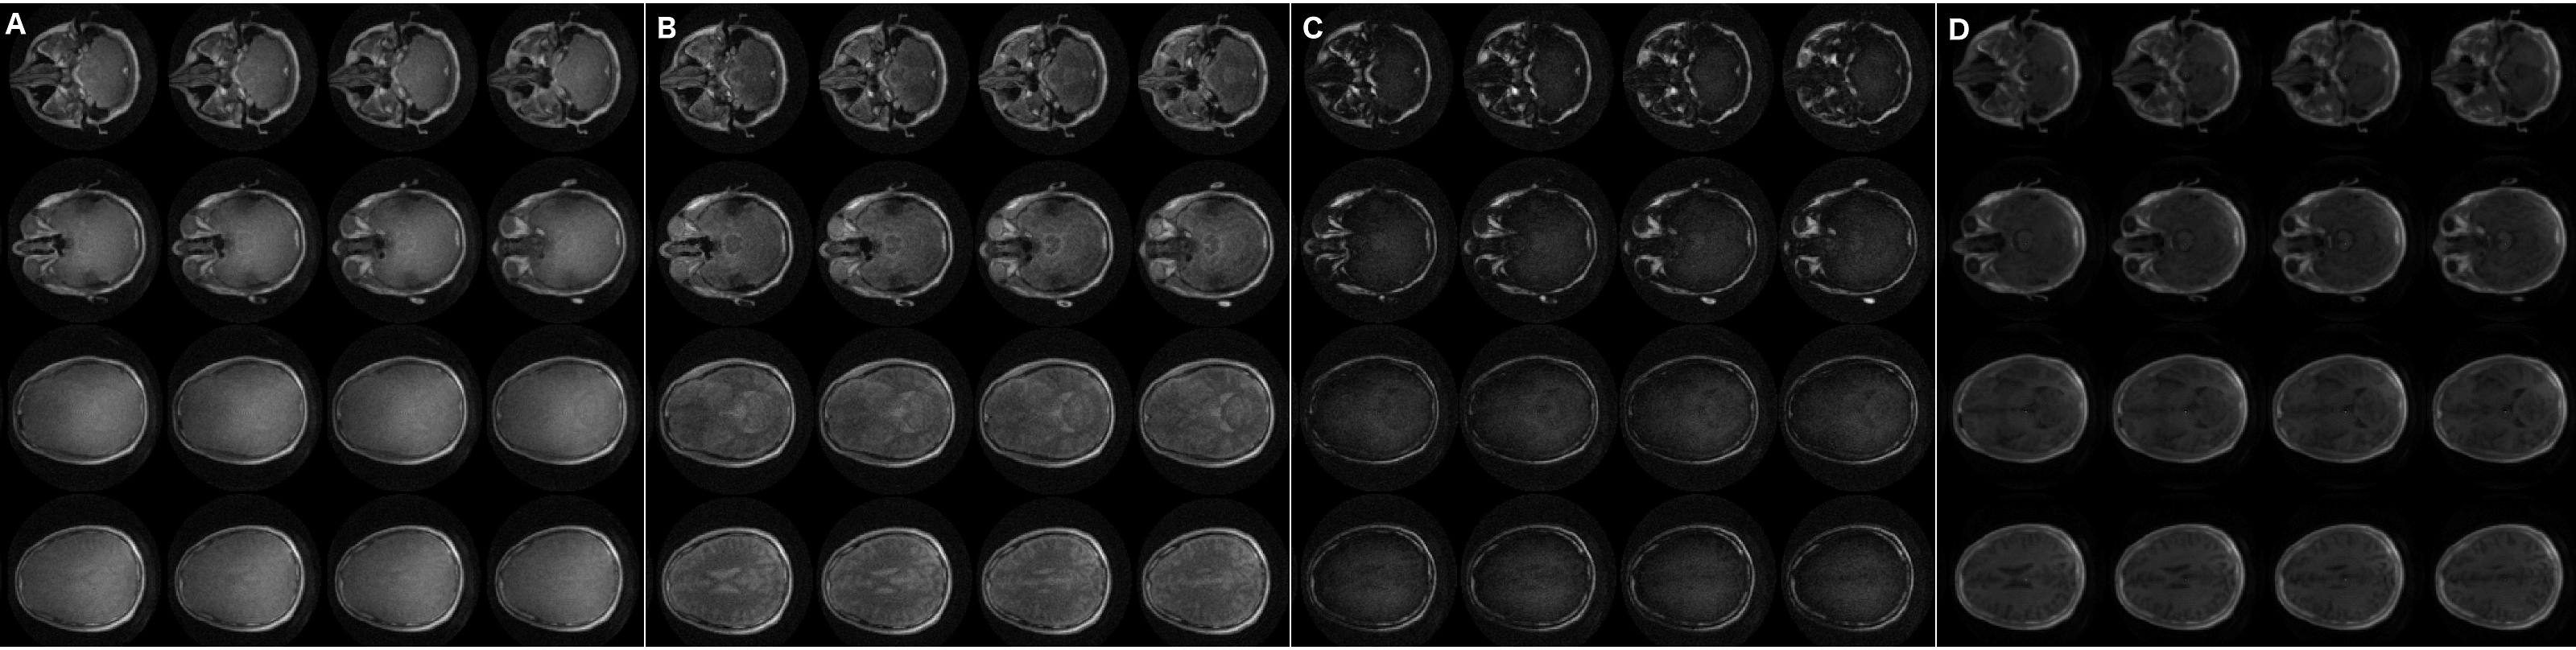
The phantom images obtained using the optimized 3D radial sequence with the composite pulse (I) neatly reflect the results of the Block equation simulation and show that in principle selective imaging of protons with T2 from 250 μs down to 63 μs is possible (Figure 2, A). However, considerable blurring in the image of the phantom with T2 = 63 μs and T2 = 125 μs occurs which is attributed to the fast signal decay during the readout (440 μs) and, therefore, insufficient intensity at the outer edges of k-space. Accordingly, the increase of TE (up to TE = 500 μs) leads to a drastic attenuation of the short T2 intensities (Figure 2, B-E). Notably, a comparable 2D radial sequence using the slice selective double inverted half pulse (III) results in images that are dominated by parts of the phantom with significantly longer T2 values and do not show the section with T2 = 63 μs at all (Figure 2, H). Brain images were acquired with a singular rectangular pulse (A) as reference image and the composite pulse (II) with TE = 10 μs (B) and TE = 510 μs (C) (Figure 3). According to the phantom results described above, the brain image C (TE = 510 μs) is dominated by intermediate and slow T2 relaxing tissue while image B potentially possesses considerable information of tissue with T2 < 125 μs. Indeed, additional blurry signal can be observed in image B compared to C which may be related to myelin components with extreme short T2 values.Conclusion
The results demonstrate that signal excitation and acquisition in the brain with T2 values below 250 μs is principally possible. The use of short non-selective hard excitation pulses as well as minimal TE and readout times in these acquisitions is of fundamental importance and only allow a very basic 3D radial sequence design. As a result relatively short acquisition times are needed for complete 3D scan even with large amounts of interleaves. An interpretation of the blurry signal obtained of the brain images and the cause of its blurriness remains illusive at this point and further studies are required. The well defined area of the signal as well as its short-lived nature, however, are two promising features that make an additional investigation worthwhile.Acknowledgements
This project was supported by the NIH grants R01DA019912, R21EB02076, and K02DA020569.References
1. Wilhelm, M. J., Ong, H. H., Wehrli, S. L., Li, C., Tsai, P.-H., Hackney, D. B., & Wehrli, F. W. (2012). Direct magnetic resonance detection of myelin and prospects for quantitative imaging of myelin density. Proceedings of the National Academy of Sciences of the United States of America, 109(24), 9605–9610.
2. Laule, C., Vavasour, I. M., Kolind, S. H., Li, D. K. B., Traboulsee, T. L., Moore, G. R. W., & MacKay, A. L. (2007). Magnetic resonance imaging of myelin. Neurotherapeutics : the Journal of the American Society for Experimental NeuroTherapeutics, 4(3), 460–484.
3. Sheth, V., Shao, H., Chen, J., Vandenberg, S., Corey-Bloom, J., Bydder, G. M., & Du, J. (2016). Magnetic resonance imaging of myelin using ultrashort Echo time (UTE) pulse sequences: Phantom, specimen, volunteer and multiple sclerosis patient studies. NeuroImage, 136(C), 37–44.
4. Tyler, D. J., Robson, M. D., Henkelman, R. M., Young, I. R., & Bydder, G. M. (2007). Magnetic resonance imaging with ultrashort TE (UTE) PULSE sequences: technical considerations. Journal of Magnetic Resonance Imaging, JMRI, 25(2), 279–289.
5. Johnson, E., Kerr, A., Pauly, K., Pauly, J. (2015). Short-T2 specific excitation by a 'back-and-forth' composite RF pulse. ISMRM 24th Annual Meeting & Exhibition • 07-13 May 2016 • Singapore.
6. Pruessmann, K. P., Weiger, M., Börnert, P., and Boesiger, P. Advances in sensitivity encoding with arbitrary k-space trajectories. Magnetic Resonance in Medicine 4466 pp. 638–651 (2001).
7. Sutton, B. P., Noll, D. C., and Fessler, J. A. Fast, iterative image reconstruction for MRI in the presence of field inhomogeneities. IEEE Transaction in Medical Imaging 2222 (2003), pp. 178–188.
Figures