3725
High-resolution 3D T2 mapping of the Brain Using T2-prepared Cartesian Spiral Phyllotaxis FLASH and Compressed Sensing1Advanced Clinical Imaging Technology, Siemens Healthcare AG, Lausanne, Switzerland, 2Department of Radiology, University Hospital (CHUV), Lausanne, Switzerland, 3LTS5, École Polytechnique Fédérale de Lausanne (EPFL), Lausanne, Switzerland, 4HC DI MR PI TIO CARD, Siemens Healthcare GmbH, Erlangen, Germany
Synopsis
Brain T2 relaxometry can provide sensitive biomarkers for pathological tissue alterations, especially inflammation. But their acquisition is often 2D-based and typically comes with long acquisition times. To improve through-slice resolution while keeping a clinically feasible scan time, we propose a centric T2-prepared variable-density Cartesian spiral phyllotaxis FLASH sequence combined with a compressed sensing reconstruction. Phantom experiments and a preliminary in-vivo scan show that T2 values can be reliably measured in 3D with high resolution. Parameter dependencies are evaluated and an initial protocol optimisation yields an acquisition time of 8.48min for a 1x1x1.2mm3 whole-brain acquisition.
Purpose:
Quantitative MRI (qMRI) measures intrinsic MR parameters, theoretically independent from the used hardware setup. However, qMRI techniques typically come with long acquisition times (TA), especially for T2 relaxometry. Moreover, they are often CPMG 2D-based and exhibit limited through-slice resolution. T2 values are however of special interest since they are sensitive biomarkers for inflammation.1,2 To increase sensitivity to subtle pathological changes and to detect alterations of small structures, high resolution is crucial. We propose a T2-prepared3,4,5 FLASH sequence combined with a sparse centric-reordered k-space trajectory in conjunction with a compressed sensing reconstruction enabling 3D T2 mapping at high resolution in clinically feasible TA. The sequence parameters were optimised in phantom measurements and first in-vivo datasets measured.Methods
The implemented prototype added a T2-preparation module (T2prep) to a FLASH readout (based on a MPRAGE, sequence diagram in Figure 1) using an accelerated sampling scheme. The T2prep module used two adiabatic refocusing pulses (hyperbolic secant pulses) and standard rect pulses for tip-down/up. The undersampling scheme followed a variable-density Cartesian spiral phyllotaxis pattern6 using a centre-out reordering and a random jitter to increase incoherence as shown in Figure 2. The images were reconstructed by minimizing a compressed sensing cost function7 (20 iterations, λ=0.0006) which enforces consistency with the acquired data (L2 norm) and sparsity in the wavelet domain (L1 norm). T2 and M0 maps were computed by voxel-wise non-linear fitting to mono-exponential T2 decay. As the acquisition scheme introduces an additional T1 dependency, the T2 signal model function was adapted according to van Heeswijk8:
$$M(T_{T2prep})=M_{0}\left[e^{\frac{-T_{T2prep}}{T2}}+\delta\right]$$
where M0 is the longitudinal magnetization at t=0ms and δ an empirically optimised offset, modelling the fact that (i) the sampling does not start immediately after the T2prep module and (ii) longitudinal relaxation takes place during the sampling.
Using the above sequence, data was acquired from a multi-compartment phantom (FLASH flip angle 4°, resolution 1x1x1.2mm³, matrix 256x240x176, undersampling factor=4) at 3T (MAGNETOM Skyra, Siemens, Erlangen, Germany) using a 20-channel head/neck coil. To evaluate the timing/signal dependencies, sequence parameters were varied as follows: TR (1240/2500/4000ms), T2prep duration (22ms-100ms in steps of 10ms, and 120ms-200ms in steps of 20ms), and samples/TR (98/121/176/197/308). The acquisitions with TR=2500ms, 176 samples/TR and T2prep durations of 22/80/120ms were acquired twice to evaluate the scan-rescan variability. A single-slice CPMG sequence (TR=4000ms, resolution 5x1.718x1.718mm³, matrix 1x128x116, TEs 8.8/20/40/60/180ms) was acquired to serve as ground truth to evaluate the T2 accuracy.
After obtaining informed consent, one in-vivo dataset was acquired on the same scanner (TR=2500ms, FLASH flip angle 4°, resolution 1x1x1.2mm³, matrix 256x240x176, acceleration 4, 121 samples/TR, T2prep 22/50/80/120ms, TA=11.36min).
Results:
Figure 3 shows the influence of TR and samples/TR on the T2 estimation. It can be seen that the shortest TR (1240ms) leads to a T2 overestimation of 10%. Longer TRs allow longer longitudinal recovery, yielding better SNR and T2 values more similar to the reference. No significant difference in T2 values were found between TR=2500ms and TR=4000ms. Furthermore, the T2 values were highly reproducible between scans (scan-rescan variability <2% in all compartments). The repeated excitation during the FLASH block results in a dependence of the number of samples/TR on the T2-prepared T1 magnetisation and thus the estimated T2 values. This effect can be partially corrected by adapting δ.
For the T2 value range of the phantom, the results show that there is no difference between considering three or four different T2prep times in the examined value range; taking only three yields a total TA=8.48min.
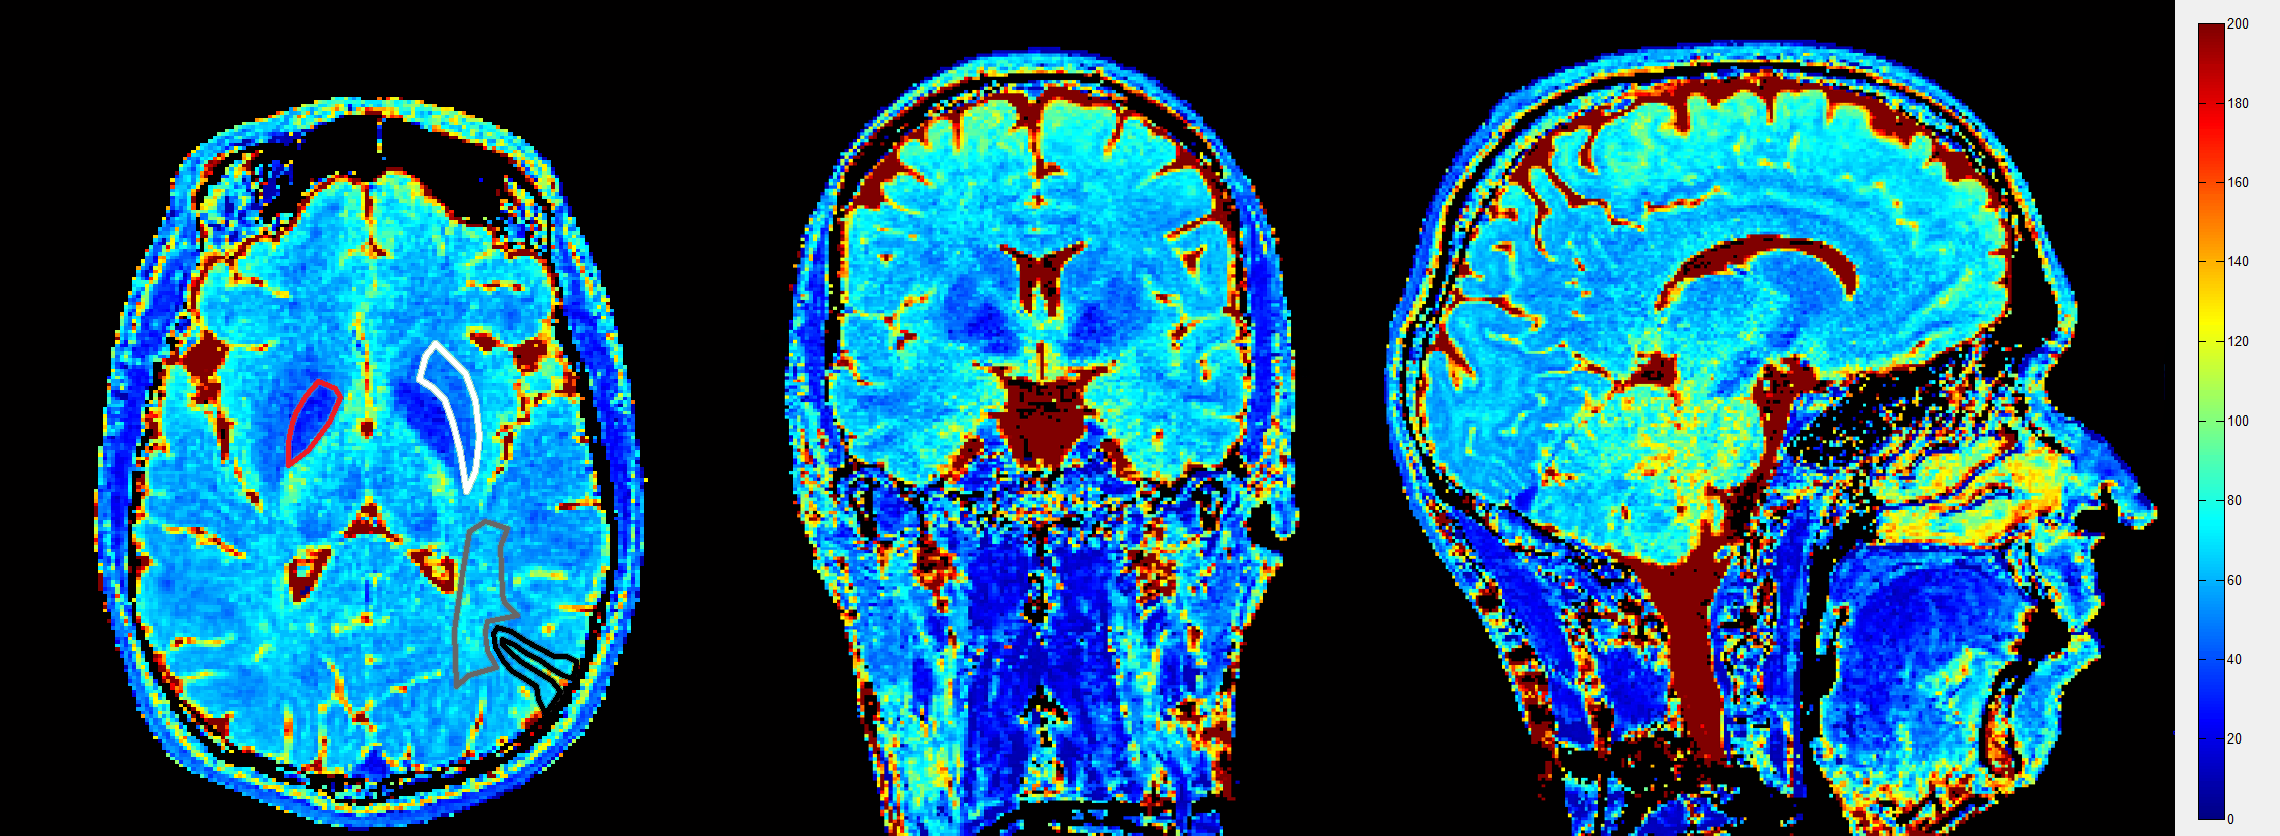
Figure 4 shows three exemplary slices of an in vivo 3D T2 map obtained with the proposed sequence. The observed T2 values correspond to the literature values (some example ROIs are drawn for comparison). It can also be noted that areas with lower T2 values exhibit increased fitting noise due to the faster signal decay in these regions.
Discussion & Conclusion:
We showed that the combination of T2prep pulses with a sparse Cartesian phyllotaxis trajectory and compressed sensing reconstruction allows generating T2 maps at high spatial resolution in clinically feasible TAs. The preliminary results show that T2 values can be reliably measured using the proposed method both in terms of accuracy and scan-rescan variability. Due to the various interdependencies, protocol optimisation is non-trivial; our current protocol acquires 1x1x1.2mm³ 3D whole-brain T2 maps in 8.48min. Future work will focus on optimising the proposed method to further reduce TA.
Acknowledgements
No acknowledgement found.References
[1] Bonnier, Guillaume, et al. Advanced MRI unravels the nature of tissue alterations in early multiple sclerosis. Ann Clin Transl Neurol 2014; 1(6):423-32.
[2] Rugg-Gunn, F.J., et al. Whole-brain T2 mapping demonstrates occult abnormalities in focal epilepsy. Neurology 2005;64:318-325.
[3] Brittain, Jean, et al. Coronary Angiography with Magnetization-Prepared T2 Contrast. Magnetic Resonance in Medicine 1995;33:689-696.
[4] Nezafat, Reza, et al. B1-insensitive T2 Preparation for Improved Coronary Magnetic Resonance Angiography at 3T. Magnetic Resonance in Medicine 2006;55:858-864.
[5] Nguyen, Thanh, et al. T2prep Three-Dimensional Spiral Imaging with Efficient Whole Brain Coverage for Myelin Water Quantification at 1.5 Tesla. Magnetic Resonance in Medicine 2012;67:614-621.
[6] Forman, Christoph, et al. High-resolution 3D whole-heart coronary MRA: a study on the combination of data acquisition in multiple breath-holds and 1D residual respiratory motion compensation. Magn Reson Mater Phy 2014;27:435-443.
[7] Lustig, Michael, et al. Sparse MRI: The Application of Compressed Sensing for Rapid MR Imaging. Magnetic Resonance in Medicine 2007;58:1182-1195.
[8] Van Heeswijk, Ruud, et al. Free-Breathing 3T Magnetic Resonance T2-Mapping of the Heart. JACC:Cardiovascular Imaging 2012;5(12):1231-1239.
Figures
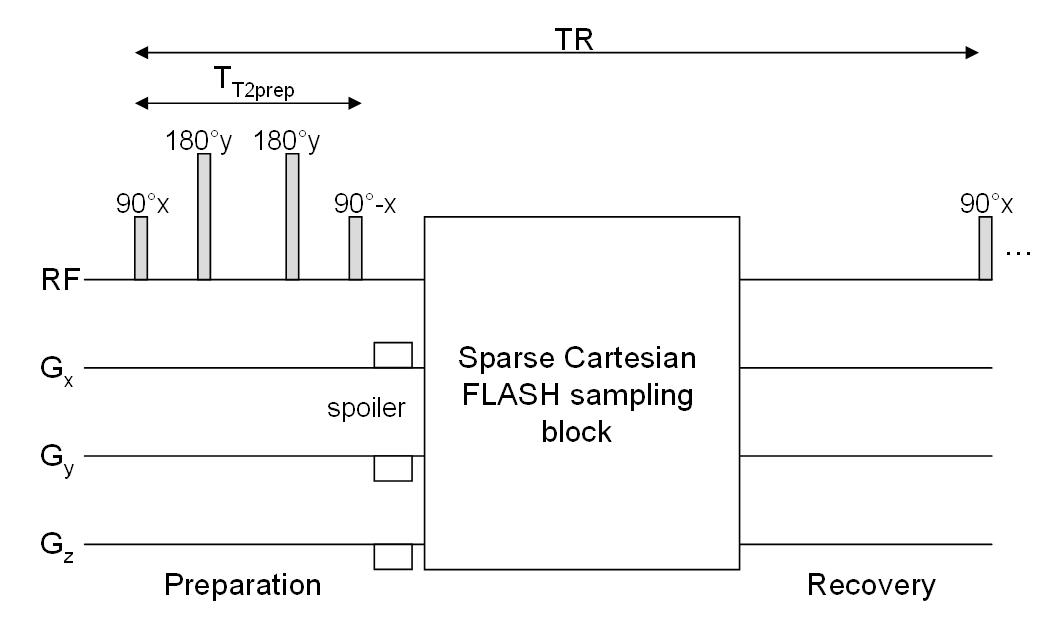
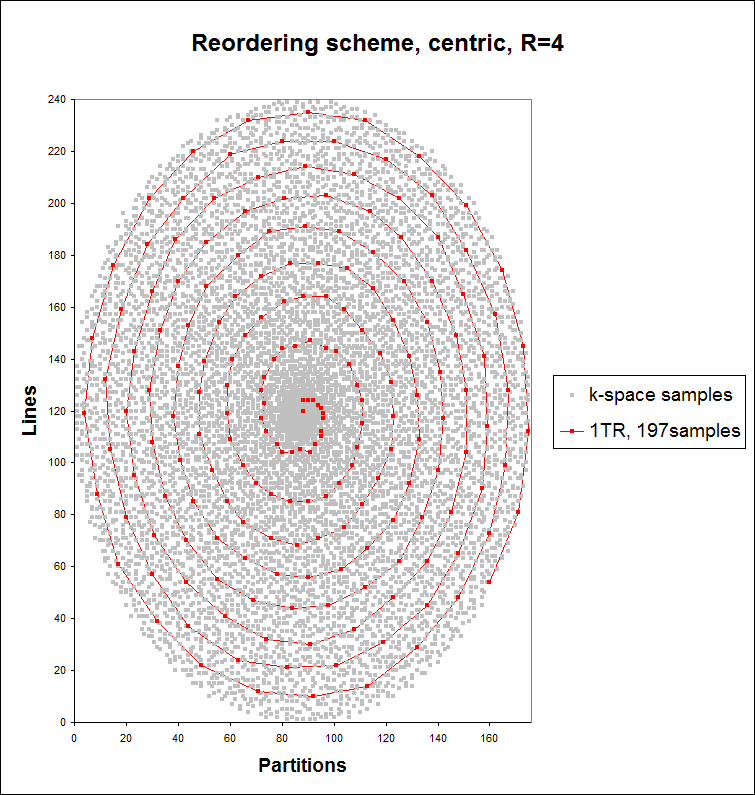
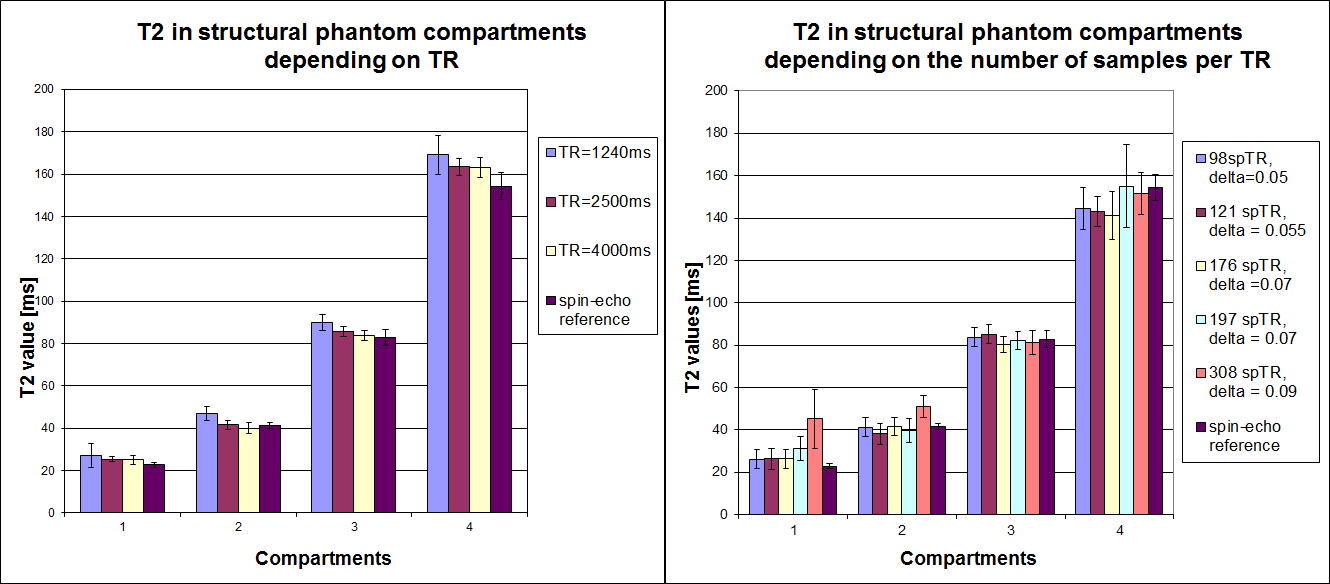
Figure 3: Left: influence of TR on fitted T2 values in the compartments of the phantom. All measurements used 176 samples/TR. Right: influence of samples per TR on the fitted T2 values. Employed TR for all measurements was 2500ms. The correction factor δ was heuristically optimised.
The experiment testing the TR used T2prep times of 22/80/120ms. The experiment testing the number of samples/TR used T2prep times of 22/50/80/120ms. Spin-echo reference values were computed using TEs = 8.8/20/40/60/180ms. Error bars represent the variability for T2 values in the different voxels of each compartment of the phantom.