3724
Assessing the Accuracy of T2 and B1+ Maps Estimated from Multi-echo Spin Echo MRI Sequences Using Extended Phase Graph Signal Predictions1Institute for Systems and Robotics / Department of Bioengineering, Instituto Superior Técnico, Universidade de Lisboa, Lisbon, Portugal, 2Instituto de Biofísica e Engenharia Biomédica, Faculdade de Ciências, Universidade de Lisboa, Lisbon, Portugal, 3Division of Imaging Sciences and Biomedical Engineering, King's College London, London, United Kingdom
Synopsis
Interpretation of T2-weighted images still remains highly reliant on subjective clinical evaluation. Quantitative mapping using the gold standard approach (single spin-echo), although appealing, remains unfeasible in clinical practice. Multi-SE sequences have emerged as viable solutions allowing much shorter scan times at the expense of signal contamination by indirect echoes. A method based on the MR Fingerprinting concept has recently been proposed, estimating T2 and B1+ maps from pre-computed Echo Modulation Curves. This study evaluated the performance of this method performing Monte Carlo simulations followed by an in vivo acquisition. The method provided accurate T2 maps, despite highly biased B1+ estimates.
Purpose
Visual evaluation of T2-weighted images is typically performed in the clinic. To reduce subjectivity1, quantitative T2 mapping has been proposed. The gold standard approach based on single spin-echo (SE) is very time-consuming and thus unfeasible in practice as long repetition times are required to avoid T1-weighting contamination2.
A commonly-accepted alternative for shortening scan times is to use multi-SE sequences. However, these present significant signal contributions from indirect echoes due to B1+ inhomogeneities, hindering the accuracy of exponential decay fitting3.
To account for these contributions, a method inspired in MR Fingerprinting4 has been proposed, matching the measured signal to predicted echo-modulation curves (EMC) estimating T2 and B1+ maps1.
Our goal was to evaluate the bias and precision of these estimates.
Methods
A pattern-matching technique was implemented in Matlab R2013b (Mathworks, USA) assigning to each signal an element from a dictionary of pre-computed EMC considering all relevant sequence parameters1,4. In multi-SE these are: echo-train length (ETL), inter-echo spacing (dTE), radiofrequency (RF) waveforms and flip angles (FA).
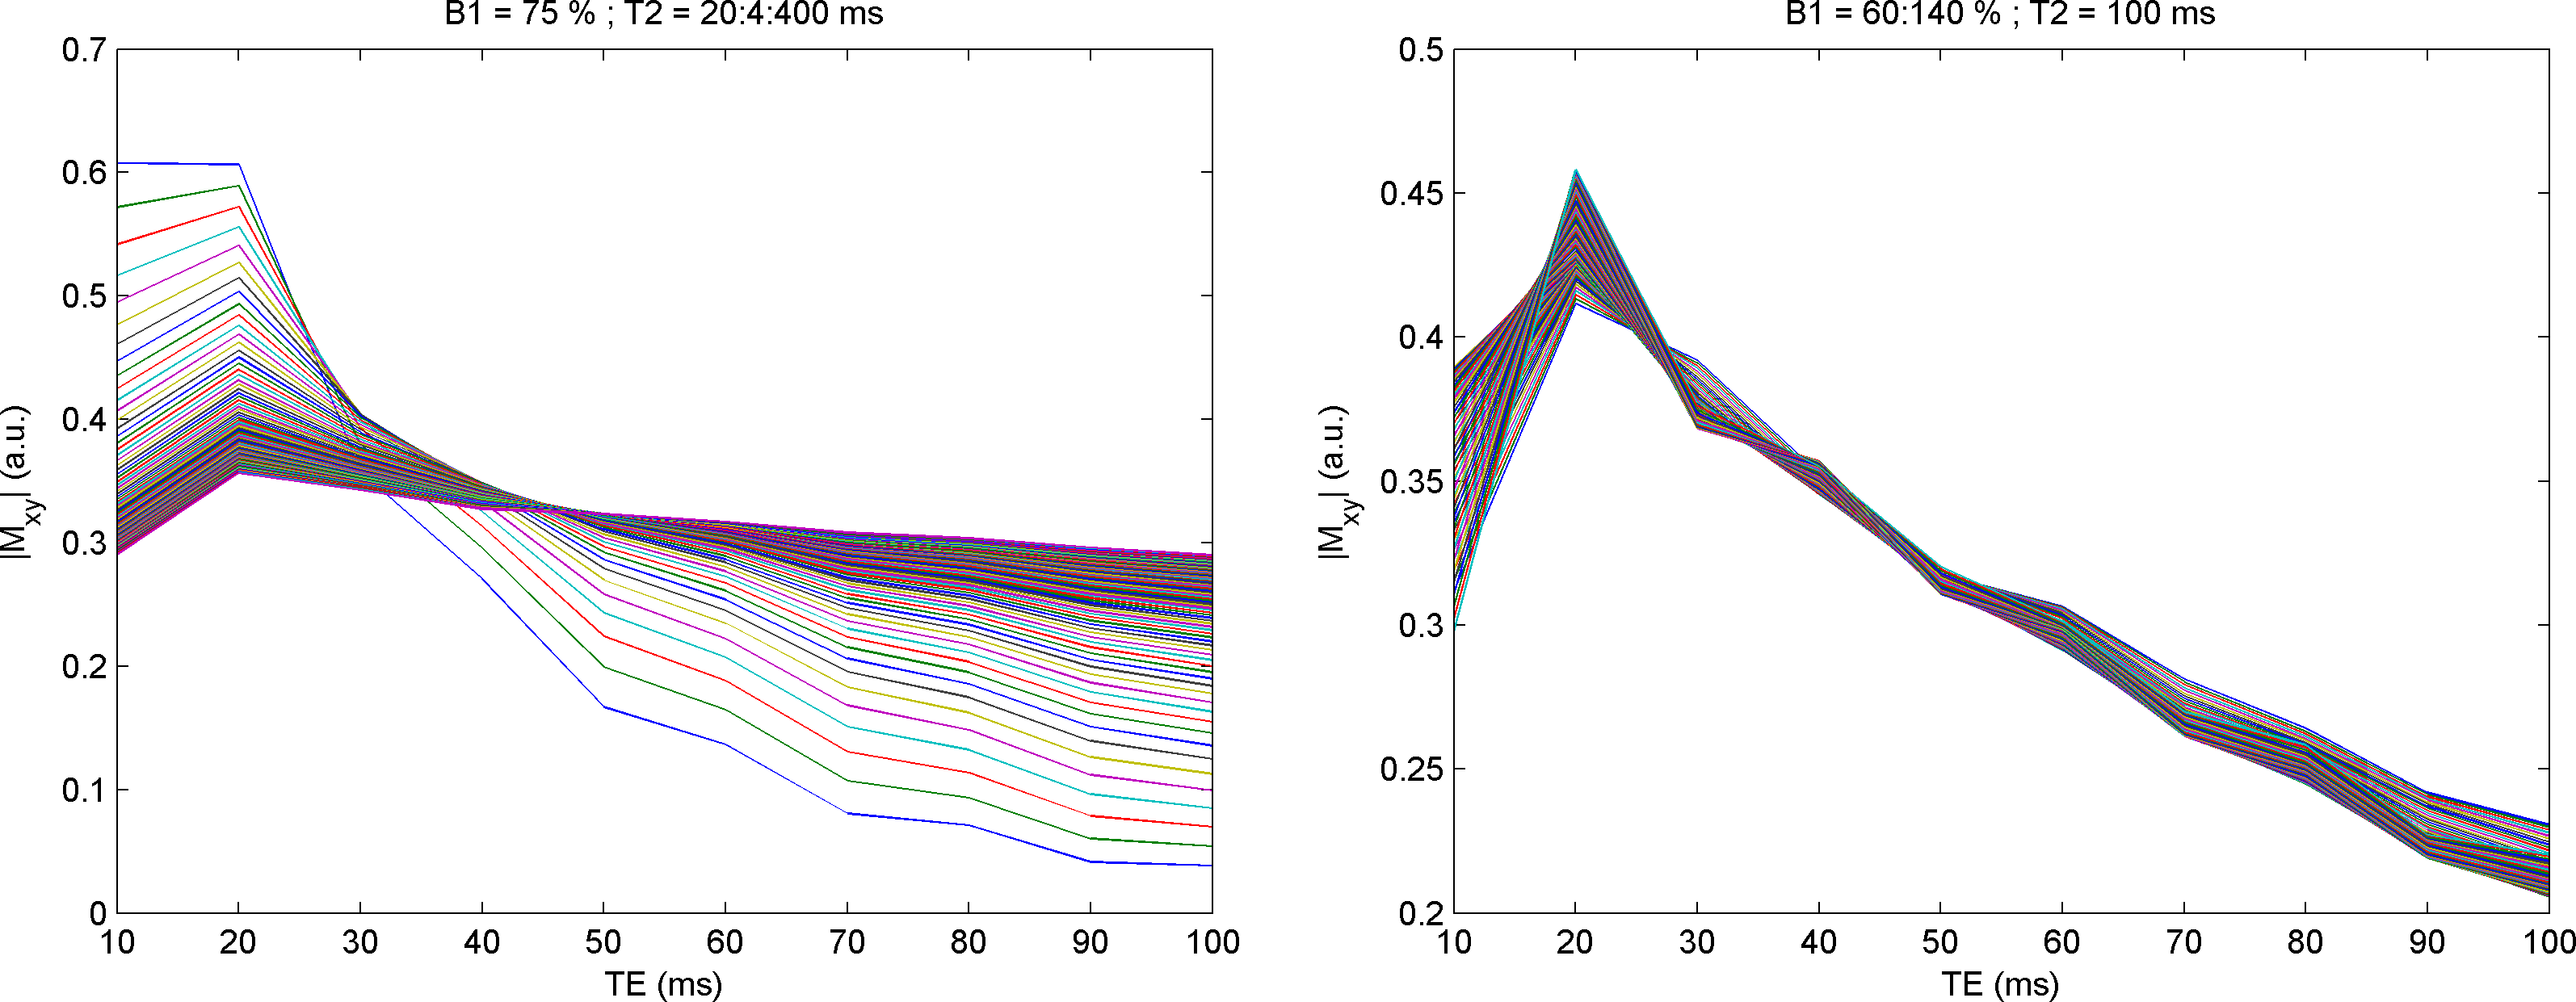
To model magnetization evolution, the Extended Phase Graph (EPG)5 formalism was used6. Slice profile effects were considered using the Shinnar-Le Roux algorithm7 as proposed by Buonincontri8. A Carr-Purcell-Meiboom-Gill selective acquisition protocol was simulated matching the in vivo protocol (ETL=10, dTE=10 ms and FA = [180° 160°… 160°], 4mm slice thickness) for realistic ranges of T2 and B1+ (20-400 ms and 60-140%); T1 was kept fixed to 1000 ms as suggested by Ben-Eliezer1 - Figure 1.
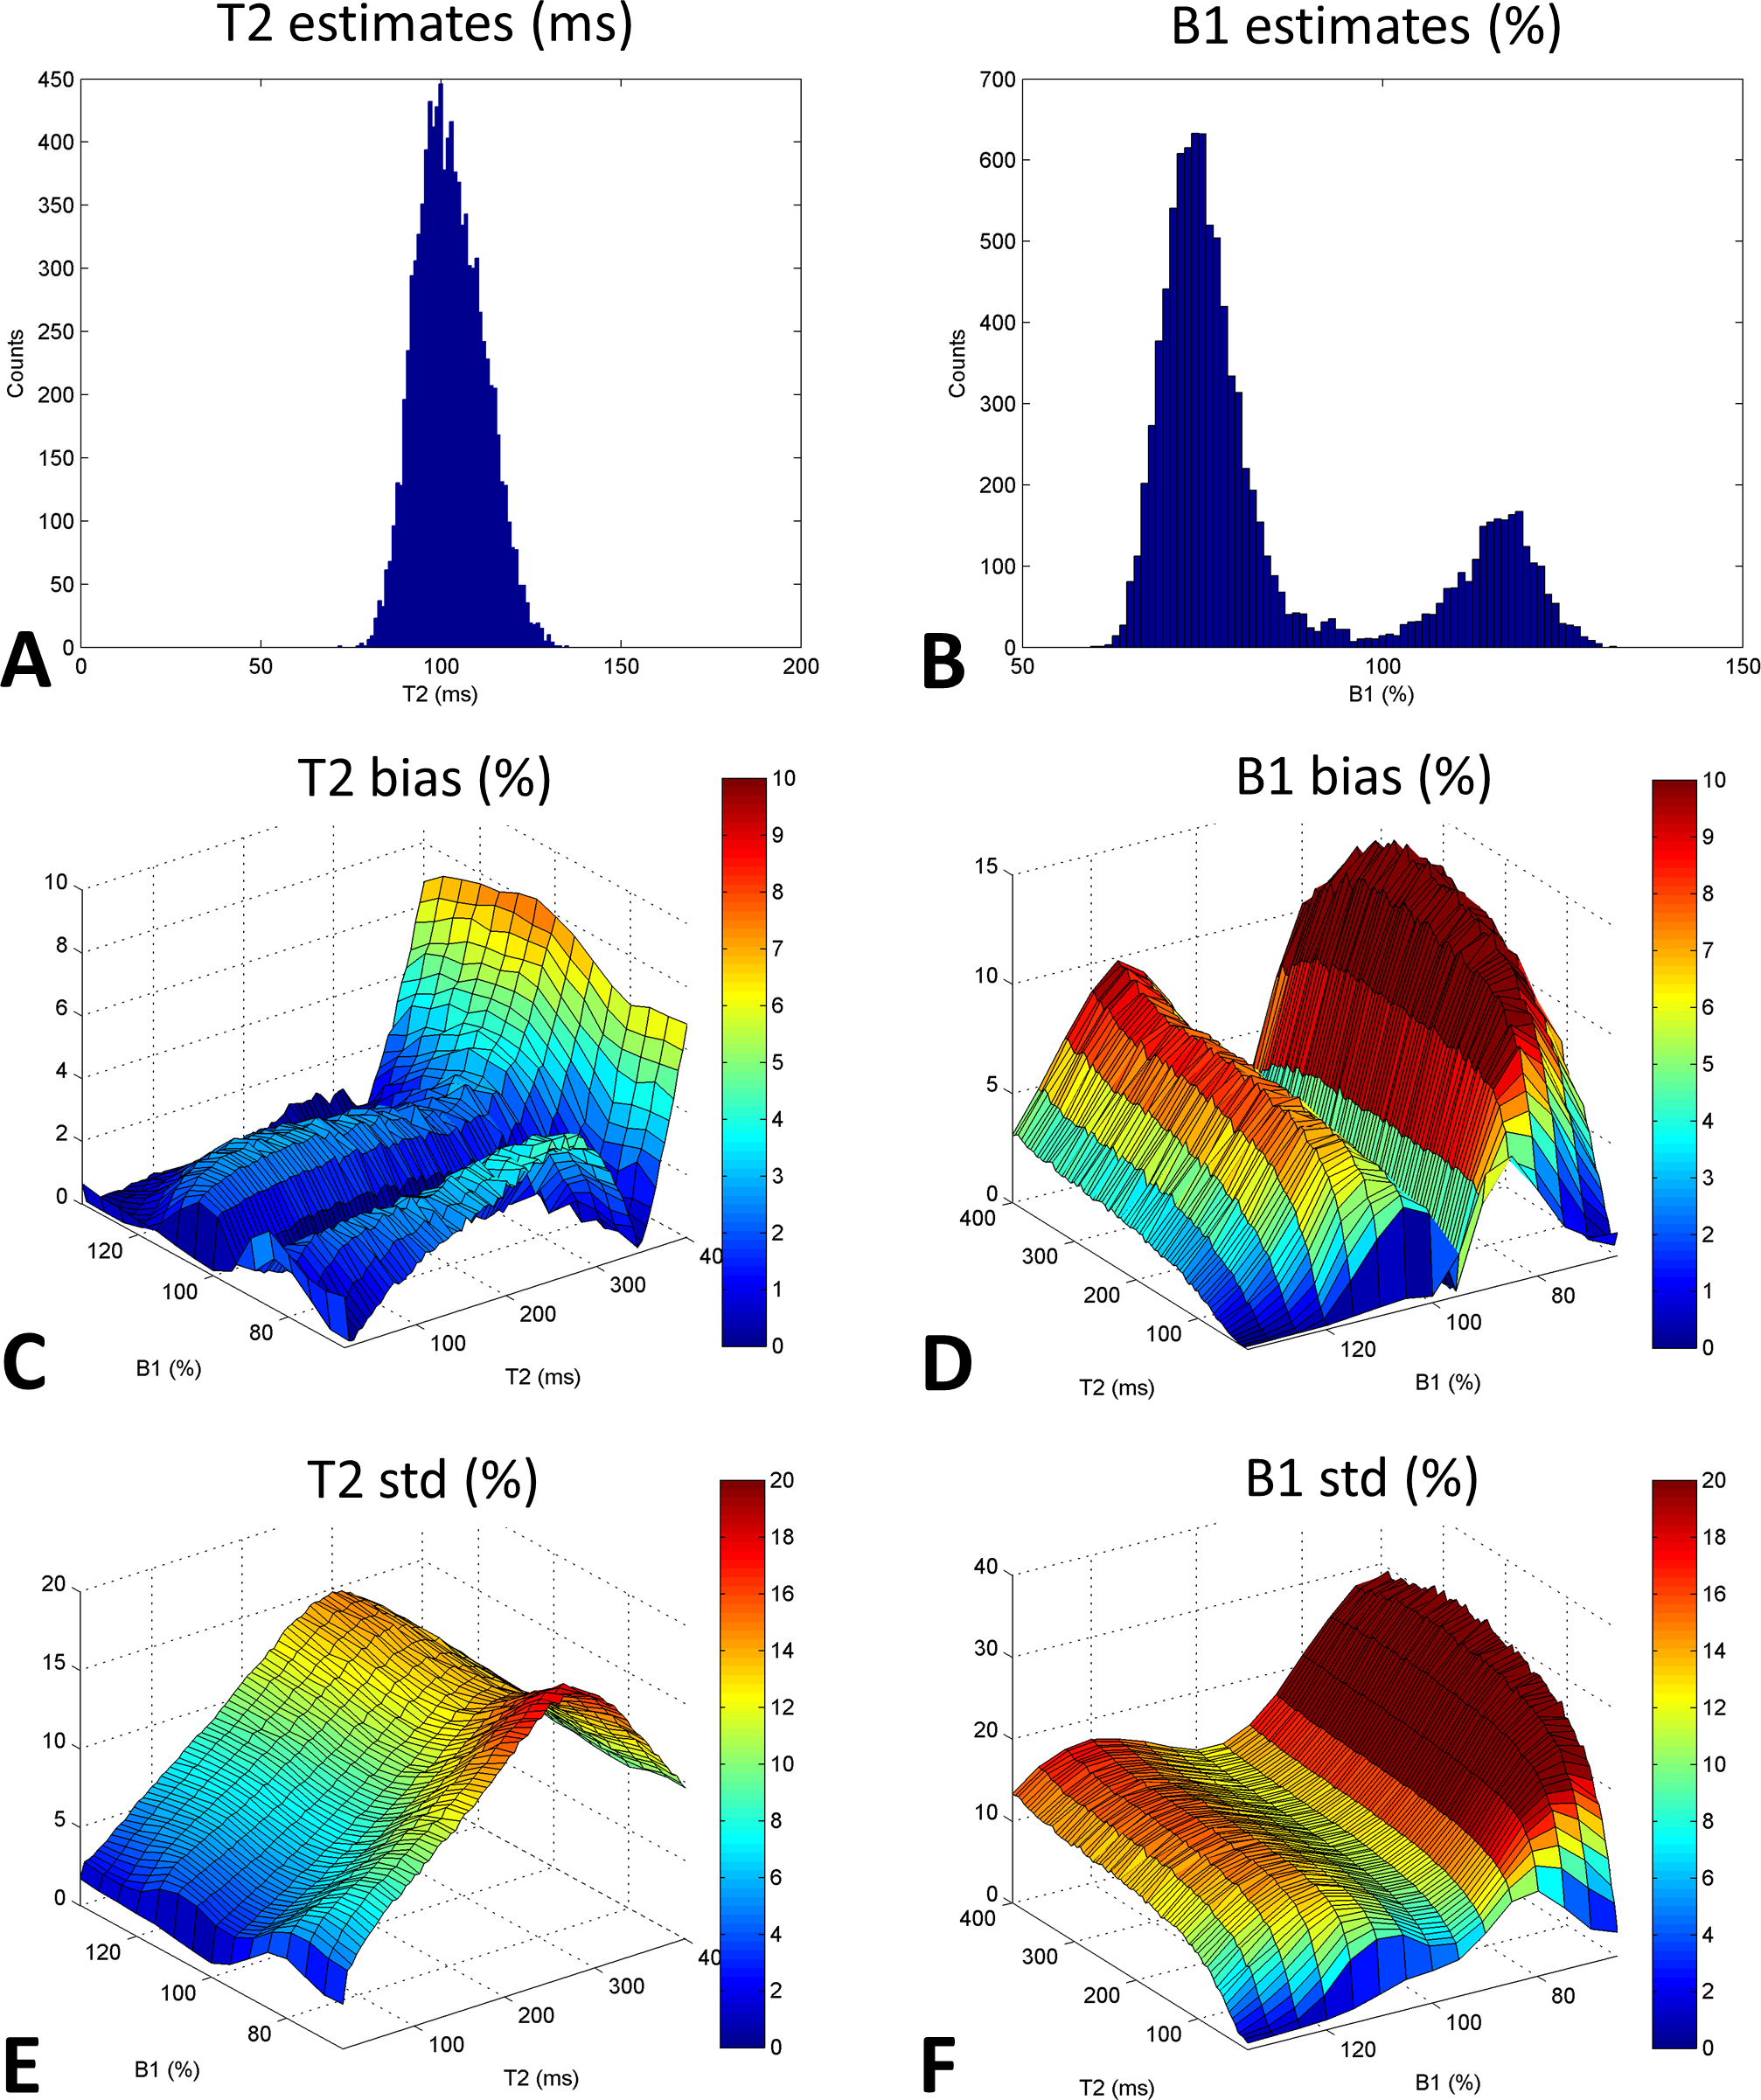
A Monte Carlo (MC) simulation was carried out generating 10,000 instances of noisy signal (with a signal-to-noise ratio of 30) for each possible [T2, B1+] combination (T2/B1+ steps: 5 ms/5%). Both parameters were estimated using template matching and the mean bias relative to the ground truth values and standard deviation were calculated.
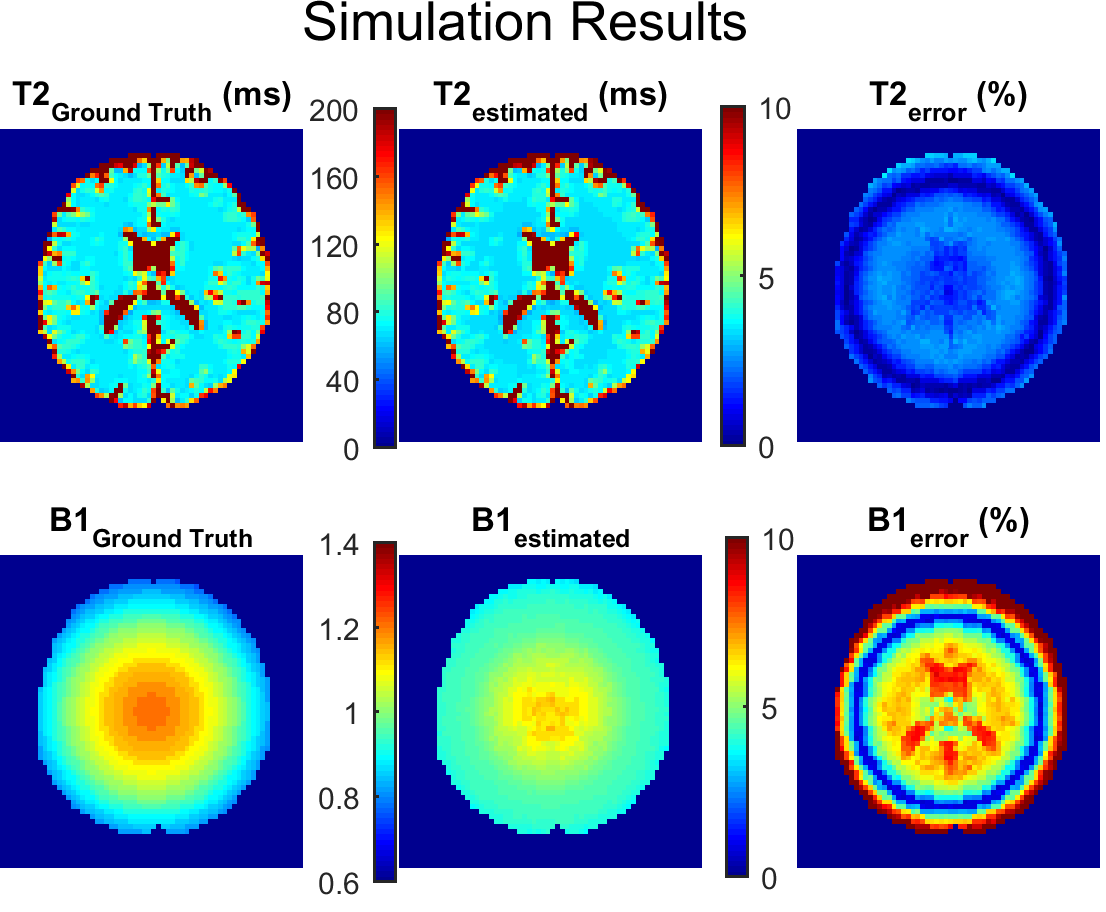
An MC simulation was carried out on a numerical brain phantom (T2 ranging 20-300 ms)9. An inhomogeneous B1+ field was considered (range 60 to 120%) and estimates obtained using the same EMC dictionary.
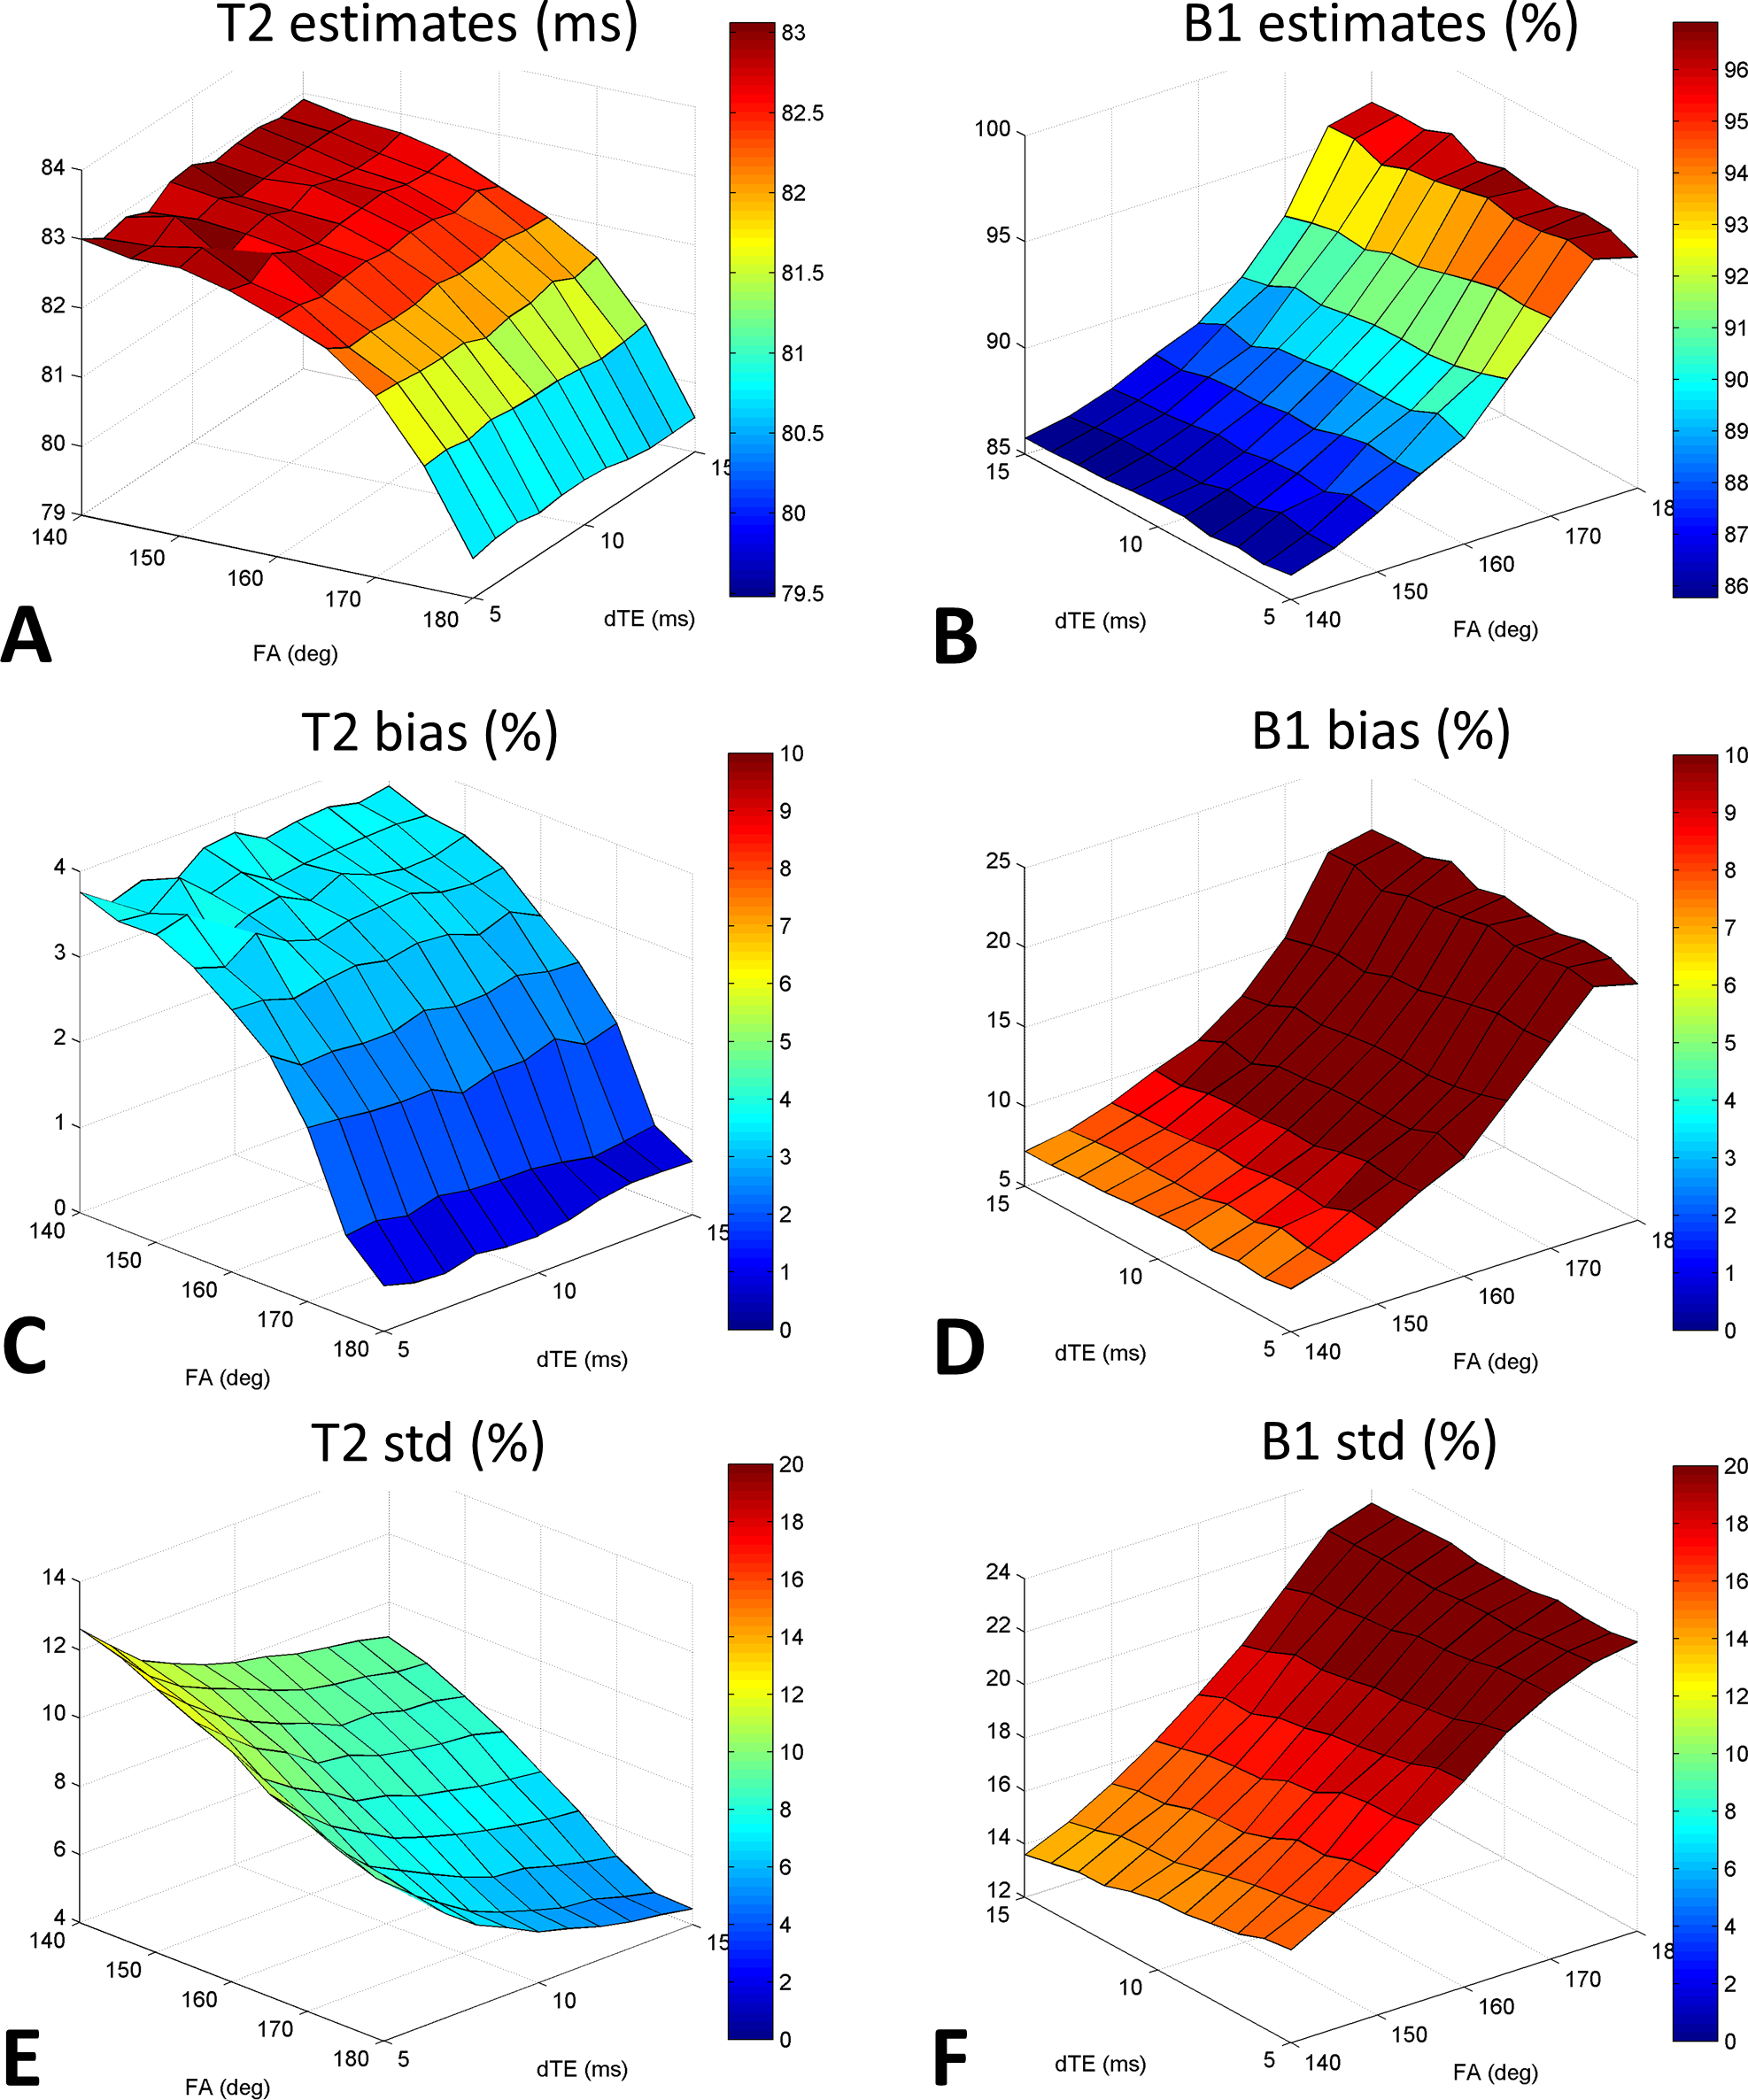
To evaluate sensitivity to the acquisition protocol, the EMC corresponding to a T2 of 80 ms and B1+ of 80% were simulated for a set of Multi-SE pulse sequences with varying dTE (range 5-15ms, step 1ms) and FA (range 140°-180°, step 5°). The first refocusing pulse of the echo train was kept at 180° to provide a smooth signal transition.
In vivo brain data were acquired on a Philips Achieva 3T scanner, using the imaging protocol considered in the simulations, with spatial resolution of 1.6×1.6×4.0mm3, field-of-view 250×250mm2, 6 slices and TR of 4s. For comparison, a T2 map was obtained fitting a mono-exponential model to the even echoes of each EMC10. Reference B1+ maps were obtained using Actual Flip-angle Imaging (AFI)11: 3.9mm isotropic resolution, field-of-view 250×250×250mm3, 6 slices, TE/TR 0.78/25ms, TR extension 100ms.
Results
From Figure 1, the T2 parameter has a stronger impact on signal amplitude than B1+. This observation is consistent with MC results – Figure 2. The histograms (panels A-B) for estimates obtained from noisy EMC, corresponding to a true T2 of 100 ms and a B1+ of 75% show a much wider B1+ distribution, which also appears bi-modal contrarily to the distribution of T2 estimates.
From Figures 2C-D, the B1+ bias increases as the true value deviates from 100% reaching up to 15%, whereas T2 bias stays within 4% for true T2 below 300ms. The biases depend mostly on B1+, with little dependency on T2. The distribution spreads (Figure 2E-F) follow a similar pattern.
Consistent results were obtained for alternative acquisition protocols (Figure 3). T2 estimates were more accurate, presenting biases lower than 4 % whereas B1+ biases were below 10% only for FA under 160°.
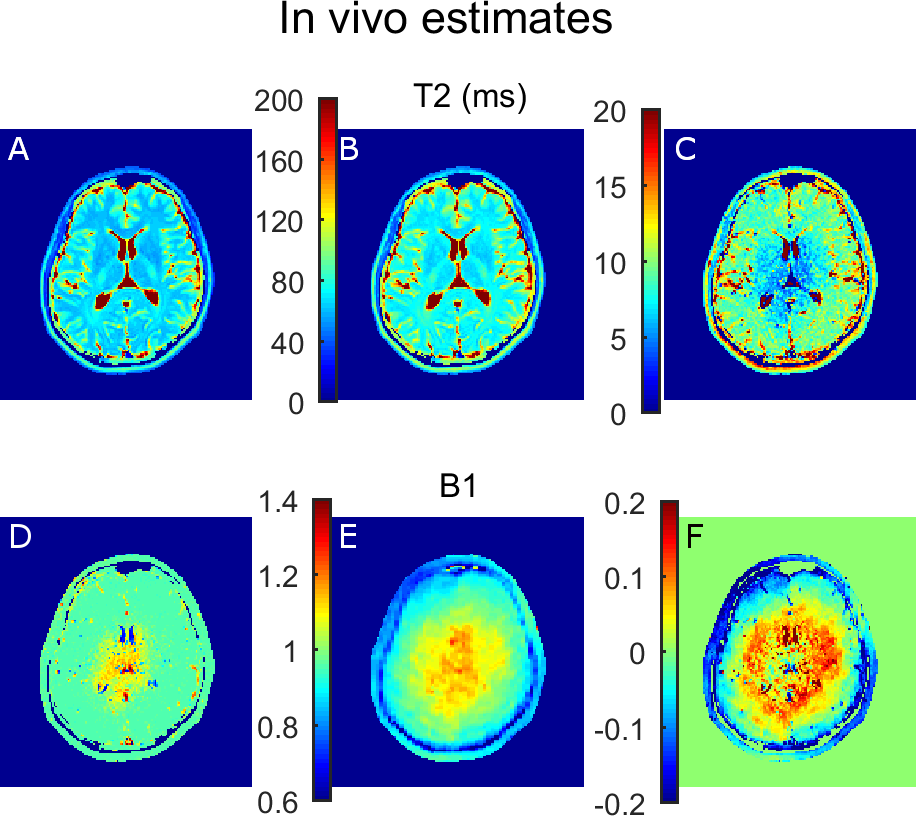
Numerical brain simulations and in vivo results were also consistent as the accuracy of T2 and B1+ estimates decreased sharply when B1+ deviated from 100% (Figures 4 and 5). T2 estimates obtained using the gold standard approach were systematically larger (5 to 10 ms) (Figure 5A-C), while the B1+ estimates differed from AFI in most of the brain (Figure 5D-F). Spatial patterns in T2 error maps (Figures 4-5C) resembled the true B1+ maps, which is consistent with higher estimation errors occurring as B1+ deviates from 100% (Figures 2C-D).
Discussion
The in vivo maps were consistent with previous results with mono-exponential estimates exceeding the T2 values estimated from EMC matching1. Although B1+ estimates appear to alternate between global and local minima, this did not affect the accuracy of T2 estimates.Conclusions
The EMC matching method is promising for clinical applications, providing accurate T2 estimates within feasible acquisition times.Acknowledgements
Portuguese Foundation for Science and Technology (FCT - IF/00364/2013 and UID/EEA/50009/2013).References
1- Ben-Eliezer N, Sodickson DK, Block KT. Rapid and Accurate T2 Mapping from Multi-Spin-Echo Data Using Bloch-Simulation-Based Reconstruction, Magn Reson Med, 2015; 73:809-17.
2- Huang C, Altbach MI, El Fakhri G. Pattern recognition for rapid T2 mapping with stimulated echo compensation, Magn Reson Imaging, 2014; 32:969-74.
3- Petrovic A, Scheurer E, Stollberger R. Closed-Form Solution for T2 Mapping with Nonideal Refocusing of Slice Selective CPMG Sequences, Magn Reson Med, 2015; 73:818-27.
4- Ma D, Gulani V, Seiberlich N, et al. Magnetic Resonance Fingerprinting, Nature, 2013; 495(7440):187-92.
5- Weigel M. Extended phase graphs: dephasing, RF pulses, and echoes - pure and simple, J Magn Reson Imaging. 2015; 41(2):266-95.
6- http://web.stanford.edu/~bah/software/epg/
7- Pauly J, Le Roux P, Nishimura D, et al. Parameter relations for the Shinnar-Le Roux selective excitation pulse design algorithm. IEEE Trans Med Imaging, 1991;10:53–65.
8- Buonincontri G, Sawiak SJ. MR fingerprinting with simultaneous B1 estimation. Magn Reson Med. 2016;76(4):1127-35.
9- Stöcker T, Vahedipour K, Pflugfelder D, et al. High-performance computing MRI simulations. Magn Reson Med. 2010; 64(1):186-93.
10- Kim D, Jensen JH, Wu EX, et al. Breathhold multiecho fast spin-echo pulse sequence for accurate R2 measurement in the heart and liver. Magn Reson Med, 2009; 62(2):300-6.
11- Yarnykh VL. Actual flip-angle imaging in the pulsed steady state: a method for rapid three-dimensional mapping of the transmitted radiofrequency field. Magn Reson Med, 2007; 57(1):192-200.
Figures