3722
Model-Based Super-Resolution Reconstruction of T2 Maps1Advanced Clinical Imaging Technology, Siemens Healthcare AG, Lausanne, Switzerland, 2Department of Radiology, University Hospital (CHUV), Lausanne, Switzerland, 3LTS5, École Polytechnique Fédérale de Lausanne, Lausanne, Switzerland, 4Donders Institute, Radboud University, Nijmegen, Netherlands, 5Siemens Medical Solutions USA, Inc., Boston, MA, United States
Synopsis
We propose an algorithm that can reconstruct 0.9mm3 isotropic T2 maps based on multiple 2D multi-echo spin-echo acquisitions that were highly undersampled. The data is reconstructed by combining a classical super-resolution approach with an iterative model-based reconstruction. Thereby, the reconstruction problem is split into multiple sub-problems to improve the convergence of the algorithm. Resulting T2 values within structures of the midbrain and the hippocampus from four healthy volunteers showed good reproducibility. This kind of high-resolution relaxometry may enable additional insight in pathologies of small brain structures and increased sensitivity to disease-induced changes.
Purpose
Quantitative MRI (qMRI) has the potential to provide comparable biomarkers for various brain diseases, e.g. multiple sclerosis or epilepsy1,2,3,4. However, the typically long acquisition times of qMRI methods have hindered its wide routine clinical use. In recent years, research has focused on accelerating the acquisition by using techniques such as compressed sensing, model-based reconstruction5,6 or fingerprinting7,8,9, among others. Since acceleration usually comes with a loss of signal-to-noise ratio (SNR), most of the proposed techniques use comparably low spatial resolution. Inspired by recent work of Setsompop et al.10 on diffusion tensor imaging, we propose to combine a model-based reconstruction with a super-resolution technique to obtain high-resolution T2 maps based on an undersampled multi-echo spin-echo (MESE) acquisition. The technique is demonstrated in-vivo on the clinically relevant use case of high-resolution hippocampus and midbrain T2-mapping.Methods
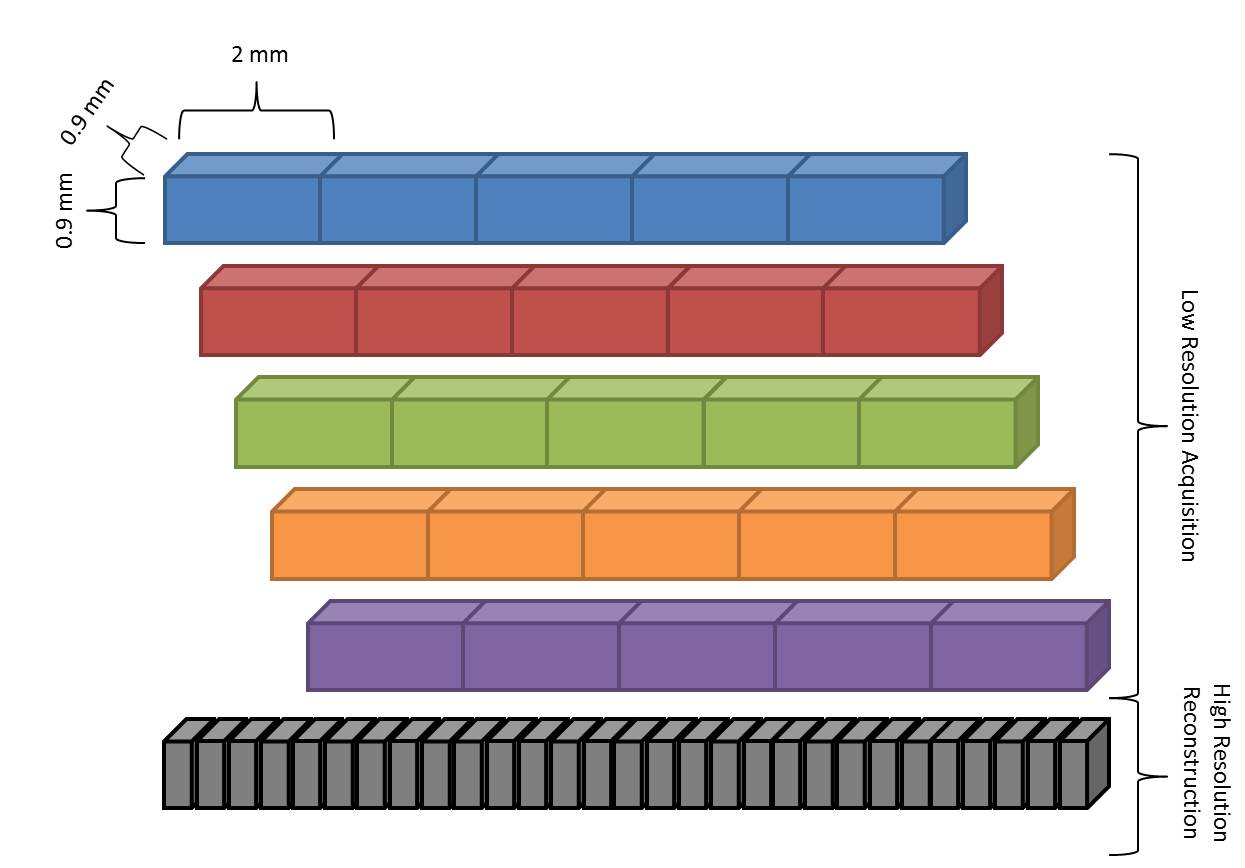
Datasets of four healthy volunteers were acquired after obtaining written consent using a 10-fold undersampled MESE prototype sequence on a 3T scanner (Magnetom Skyra, Siemens, Erlangen, Germany) equipped with a standard 20-channel head/neck coil. For each subject, 20 coronal slices with 2 mm thickness and 0.9x0.9mm2 in-plane resolution were scanned five times; between scans, the FOV was moved by 0.4mm in slice-encoding direction as illustrated in Figure 1 (relevant sequence parameters: TR=3560ms, 16 echoes, ΔTE=10.7ms, TA 5 x 2:17min=11:25min).
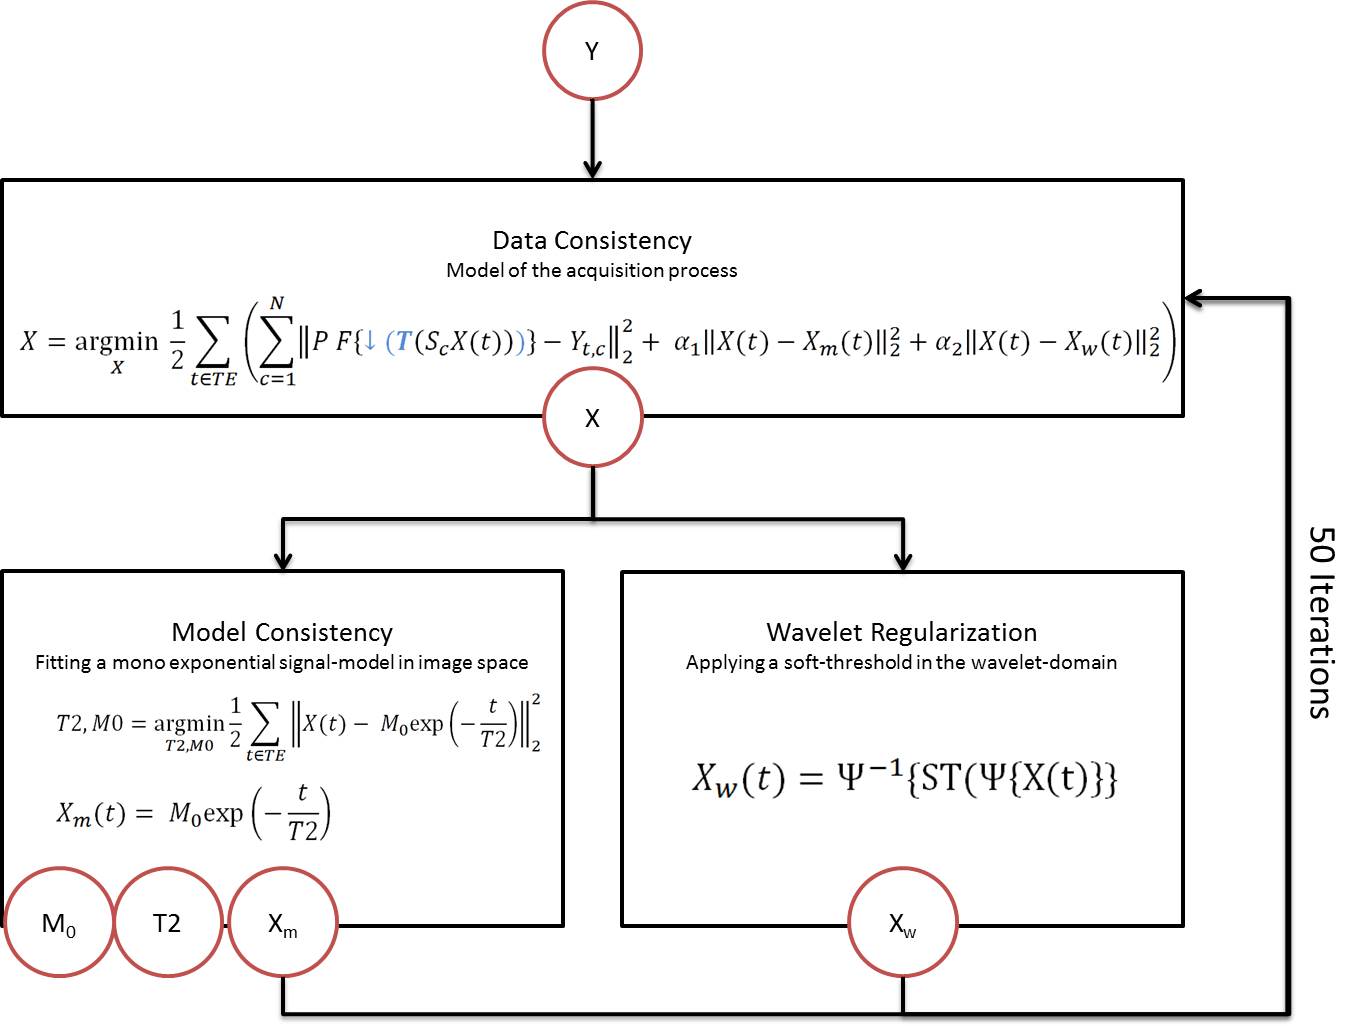
Data was reconstructed using a split algorithm that estimates quantitative T2 by minimizing data-, model- and image-consistency cost functions alternately as illustrated in Figure 2. These three terms could be solved in a single cost function; however splitting the problem into multiple sub-problems (cost terms) results in a better conditioned optimization and faster convergence11.
The data consistency cost term models the imaging process including undersampling, Fourier transformation and coil combination. In addition to this, we propose to also incorporate a super-resolution model into this term, describing the shift between the different low-resolution scans as well as the image down-sampling from the high target resolution (super-resolution) to the lower acquisition resolution12 (c.f. blue operations in Figure 2). The model consistency cost term uses the current high-resolution image estimates of the different echo times to obtain the current best fit (i.e. T2 and M0) which is subsequently used to enforce a mono-exponential decay on the data estimate. The additional image cost term enforces sparsity in the Wavelet domain.
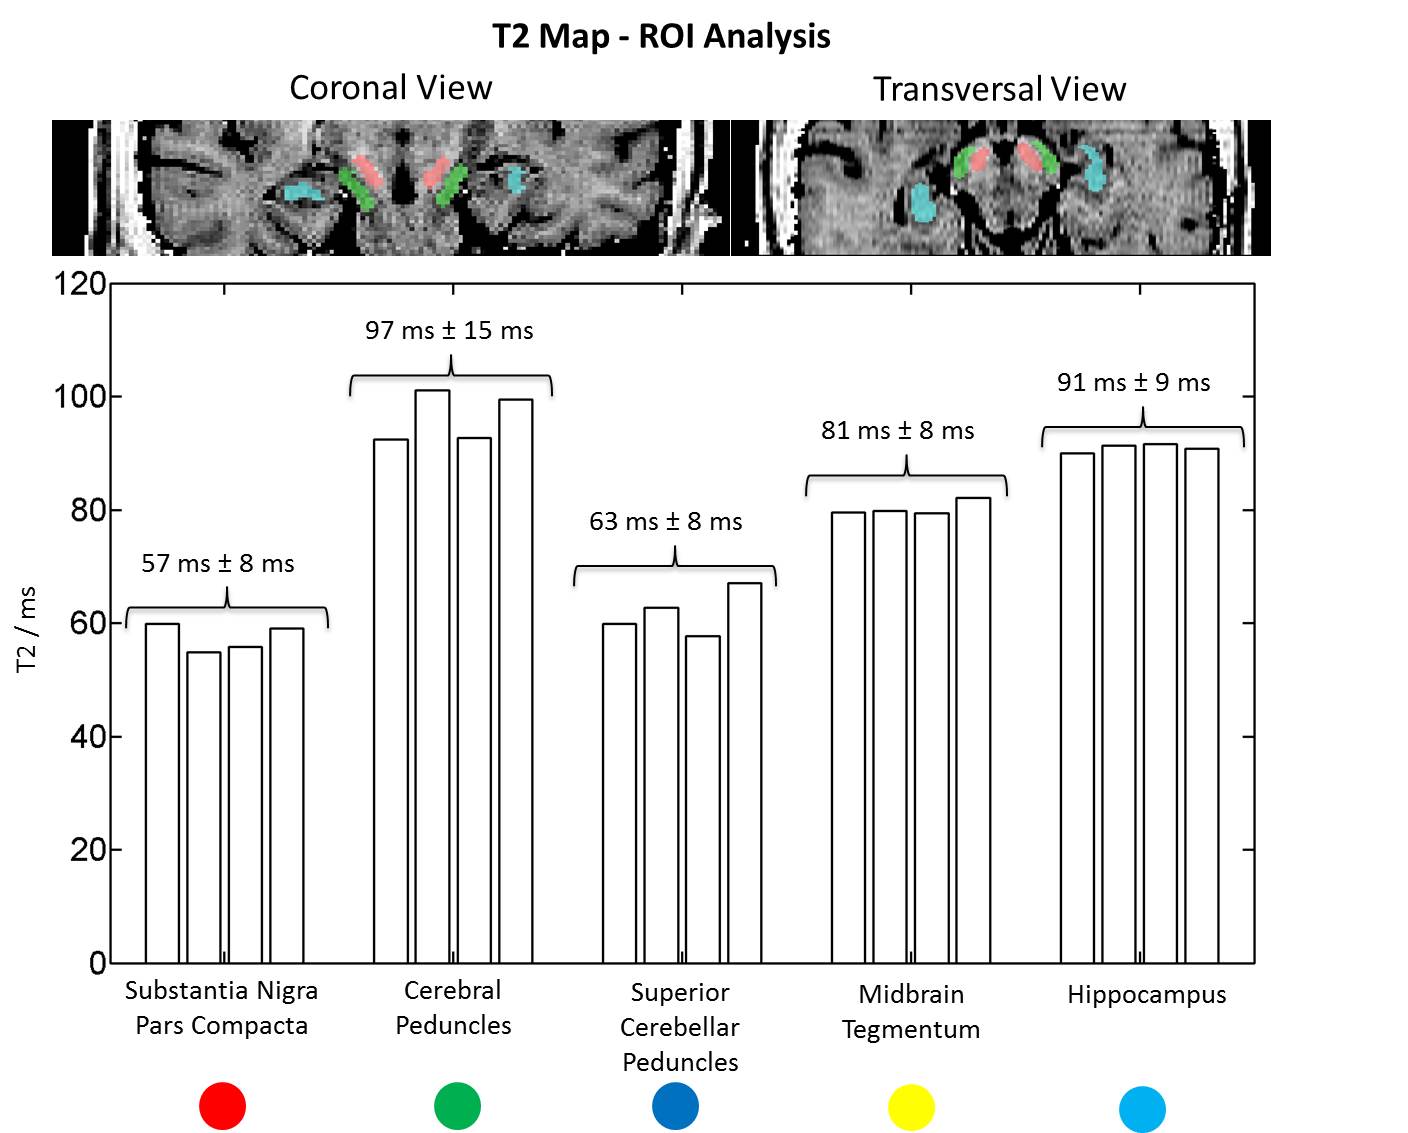
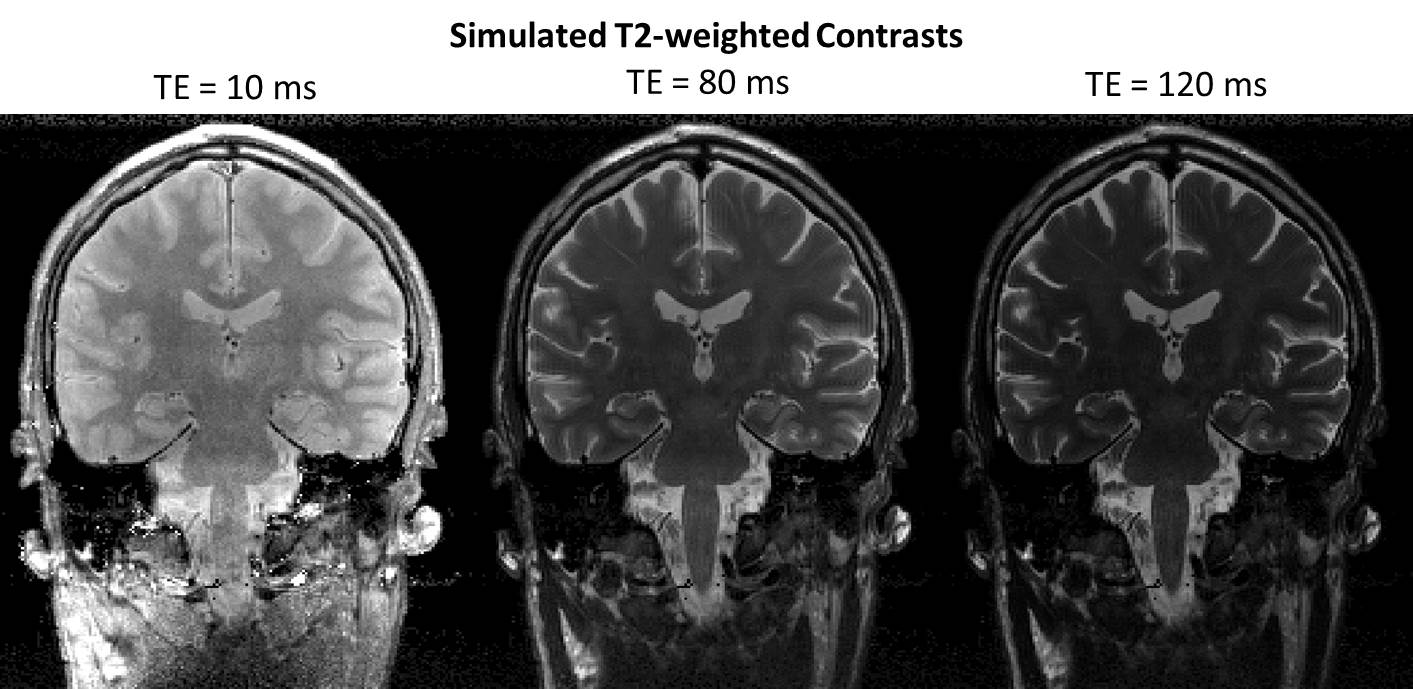
Multiple regions of interest (ROI) were manually drawn in different midbrain structures (substantia nigra, pars compacta, cerebral peduncles, superior cerebellar peduncles, midbrain tegmentum) and the hippocampus to assess the T2 values of these small structures and compare them across subjects. Additionally, synthetic T2-weighted images with different TE values (10/80/120ms) were simulated by applying the forward signal model.
Results
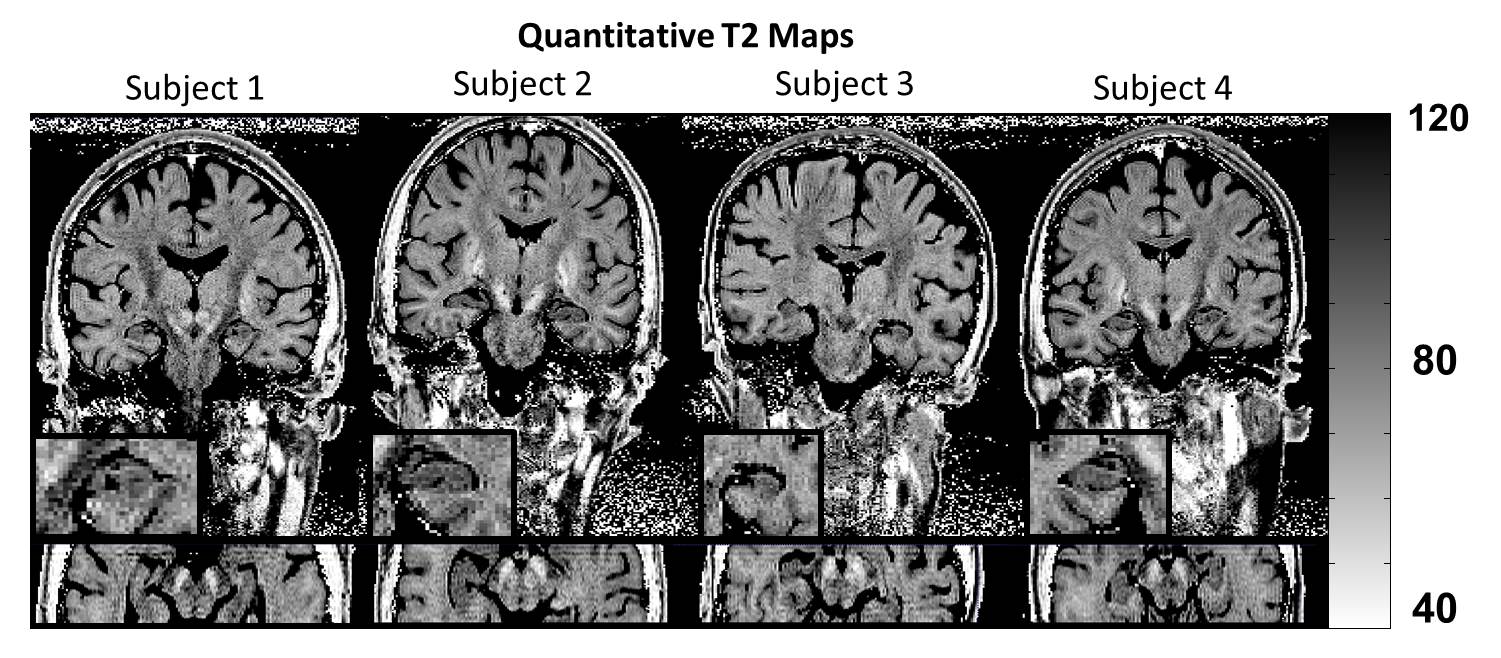
The proposed algorithm succeeded to reconstruct super-resolution data from all subjects. The obtained T2 maps of all subjects are shown in Figure 3. It can be seen that the T2 values exhibit only subtle noise despite the small voxel size. Small structures in the midbrain and the hippocampus demonstrated good conspicuity.
Midbrain and hippocampus mean T2 values across all subjects are reported in Figure 4 along with an example of the manually drawn ROI positions. The values found in the midbrain structures and hippocampi were consistent across subjects and showed low variability.
Synthetic T2-weighted contrasts with different simulated TE values (10,80,120ms) from one subject are shown in Figure 5 for visual assessment of the underlying T2 maps.
Discussion & Conclusion
We propose a technique that uses multiple 10-fold undersampled 2D acquisitions to iteratively reconstruct high-resolution T2 maps by combining model-based reconstruction with a super-resolution approach. While the reconstructed voxel-size is 0.9x0.9x0.4mm3, the resulting T2 maps can be assumed to actually have an approximated 0.9 mm isotropic resolution following a heuristic used in super-resolution imaging.
The total acquisition time with the proposed protocol is 11:25min despite the 10-fold acceleration, which may not be acceptable in clinical routine. Protocol optimizations and future work that includes simultaneous multi-slice sampling may however allow reducing the scan times considerably. While the reconstruction time of the algorithm is already improved due to the splitting of the cost function, current calculation times are around ~6h. Future work should focus on performance improvements such as parallelization, coil-compression and a GPU implementation.
The proposed technique allows the assessment of T2 values in multiple small brain structures from a single acquisition at high isotropic resolution. This can provide additional insight in pathological changes especially in the central brain structures, which play an important role in many pathological processes in the brain. Since smaller anatomy can be probed, it may also enable more sensitive imaging biomarkers in the future.
Acknowledgements
No acknowledgement found.References
1. Damadian R. Tumor detection by nuclear magnetic resonance. Science 1971; 171.3976:1151-1153.
2. Margaret Cheng HL, Hai-Ling, Stikov N, Ghugre NR, Wright GA. Practical medical applications of quantitative MR relaxometry. J Magn Reson Im 2012;36:805-824.
3. Bonnier G, Roche A, Romascano D, Simioni S, Meskaldji D, Rotzinger D, Lin YC, Menegaz G, Schluep M, Du Pasquier R, Sumpf TJ, Frahm J, Thiran JP, Krueger G, Granziera C. Advanced MRI unravels the nature of tissue alterations in early multiple sclerosis. Ann Clin T Neurol 2014;1:423-432.
4. Deoni, S. C. (2010). Quantitative relaxometry of the brain. Topics in magnetic resonance imaging: TMRI, 21(2), 101.
5. Sumpf TJ, Uecker M, Boretius S, Frahm J. Model-based nonlinear inverse reconstruction for T2 mapping using highly undersampled spin-echo MRI. J Magn Reson Imag 2011:34:420-428.
6. Block, K. T., Uecker, M., & Frahm, J. (2009). Model-based iterative reconstruction for radial fast spin-echo MRI. IEEE transactions on medical imaging, 28(11), 1759-1769.
7. Ma, D., Gulani, V., Seiberlich, N., Liu, K., Sunshine, J. L., Duerk, J. L., & Griswold, M. A. (2013). Magnetic resonance fingerprinting. Nature, 495(7440), 187-192.
8. Jiang, Y., Ma, D., Seiberlich, N., Gulani, V., & Griswold, M. A. (2015). MR fingerprinting using fast imaging with steady state precession (FISP) with spiral readout. Magn Reson Med, 74(6), 1621-1631.
9. Cloos, M. A., Knoll, F., Zhao, T., Block, K. T., Bruno, M., Wiggins, G. C., & Sodickson, D. K. (2016). Multiparametric imaging with heterogeneous radiofrequency fields. Nature Communications, 7.
10. Setsompop K, Stockmann J, Fan Q, Witzel T, Wald LL, Generalized SLIce Dithered Enhanced Resolution Simultaneous MultiSlice (gSlider-SMS) to increase volume encoding, SNR and partition profile fidelity in high-resolution diffusion imaging. Proc. Intl. Soc. Mag. Reson. Med. 24 (2016) #0607
11. Hilbert, T., Thiran, J. P., Meuli, R., Krueger, G., & Kober, T. SAFT: Split-Algorithm for Fast T2 Mapping. Proc. Intl. Soc. Mag. Reson. Med. 24 (2016)
12. Greenspan H, Oz G, Kiryati N, Peled S. MRI inter-slice reconstruction using super-resolution. Magn. Reson. Imaging [Internet] 2002;20:437–446.
Figures