3721
Quantitative 3D T1 mapping technique in rat brain using VFA-FLASH at 9.4THedok Lee1, Simon Sanggaard2, Kristian Mortensen2, Palle Koch2, Maiken Nedergaard2,3, and Helene Benveniste1
1Anesthesiology, Yale University, New Haven, CT, United States, 2Center for Basic and Translational Neuroscience, University of Copenhagen, Copenhagen, Denmark, 3Neurosurgery, University of Rochester, NY, United States
Synopsis
3D whole brain T1 mapping technique at 9.4T is studied because of a lack of methodological consideration in spite of its utility in pre-clinical paramagnetic and manganese contrast enhanced imaging studies. We report a simple and accurate 3D T1 mapping technique using variable flip angles spoiled gradient echo sequence with B1+ correction. Accuracy of the technique was validated using phantoms and a population averaged 3D rat T1 map was constructed.
Introduction
3D whole brain T1 mapping technique at high magnetic field (B0) poses technical challenges such as inhomogeneous RF transmit (B1+) profile causing inaccurate flip angles in gradient echo sequences. Previous studies focused on low field applications in human brain[1,2] and there is a lack of methodological consideration for high field MRI (9.4T) in spite of its routine use in pre-clinical paramagnetic and manganese contrast enhanced imaging studies. Here we report a simple and accurate 3D T1 mapping technique using a variable flip angles spoiled gradient echo (VFA-FLASH) sequence with B1+ correction implemented at 9.4T. Accuracy of the technique was validated using phantoms and its utility was evaluated in rat brains.Method
All imaging acquisitions were performed on a Bruker 9.4T/30 MRI instrument equipped with a volume transmit and surface receive coils interfaced with Paravision 5. Phantoms containing various Gd-DOTA (0.02mM~0.27mM) mixed with water were scanned at 37°C. Twelve Wistar rats (body weight: 343±54g; 8~10 weeks old males) were anesthetized with Dexmedetomidine (0.015-0.020 mg/kg/hr) supplemented with 0.5~0.8% isoflurane in a 1:1 Air:O2 mixture and the rats were breathing spontaneously. Animals were positioned supine and normal physiology was assured using a non-invasive vital sign monitoring system. VFA-FLASH technique comprises spoiled gradient echo (3D FLASH TR/TE/FA/TA=15ms/4ms/2,5,10,15,20,30°/4min) taken at multiple flip angles along with double angle B1+ mapping (2D RARE TR/TE/FA/TA=10000ms/22ms/70,140°/10min). Images were reconstructed at 0.24x0.24x0.26mm (128x128x128). In addition, in the phantom study a single slice inversion recovery (IR RARE TR/TE/TI/TA=18000ms/22ms/100~9000ms/8min) sequence was also acquired. T1 maps derived from the VFA-FLASH were calculated using a least square method [3] with B1+ correction, and a three parameters fit was used to derive T1 maps from the IR images. All T1 maps were spatially normalized and population averaged using SPM12 [4] and segmented into grey matter (GM), white matter (WM), and cerebral spinal fluid (CSF) using the Wistar rat brain probability map [5].Result
In the phantom study, T1s were extracted from region of interests (ROI) in both B1+ corrected and uncorrected VFA-FLASH images, and were plotted against ROIs derived from the IR sequence as shown in Figure. 1. B1+ correction substantially improves the accuracy of the T1 map as evidenced by the fact that discrepancies to the gold standard IR sequence are reduced from ~25% (B1+ uncorrected) to ~6% (B1+ corrected). In regards to the animal studies, representative B1+ and T1 maps are shown in Figure. 2. As expected, spatially dependent B1+ map progressively deviates from a nominal flip angle when the voxel position is further away from the center of the transmit coil, affecting the T1 proportionally. With B1+ correction, as expected a more homogeneous T1 profile is achieved. Spatially normalized and population averaged T1 maps is shown Figure. 2 and T1s were extracted from each tissue compartment as follows: 2121±94ms(GM), 1948±74ms(WM), and 2864±495ms(CSF).Conclusion
VFA-FLASH with B1+ correction is an accurate and simple 3D T1 mapping technique that can readily be implemented in brain as well as other body organs. The phantom study demonstrated that a wide range of T1s (1000~3300ms) were consistent with the gold standard IR sequence; further, whole brain GM, WM, and CSF T1s were also comparable to T1s reported in previous studies [6]. Despite the use of a whole body volume coil, substantial B1+ inhomogeneity within the brain was still observed and must be corrected for at 9.4T in order to achieve accurate T1 measurements.Acknowledgements
This study is supported by NIH-R01AG048769 and NIH-RF1AG053991.References
1] Deoni et al. MRM (2003) [2] Marques et al. Neuroimage (2010) [3] Wang et al. MRM (1987) [4] Ashburner et al. Neuroimage (2005) [5] Valdes PA et al. Front in Neuroinfo (2011) [6] de Graaf et al. MRM (2006)Figures
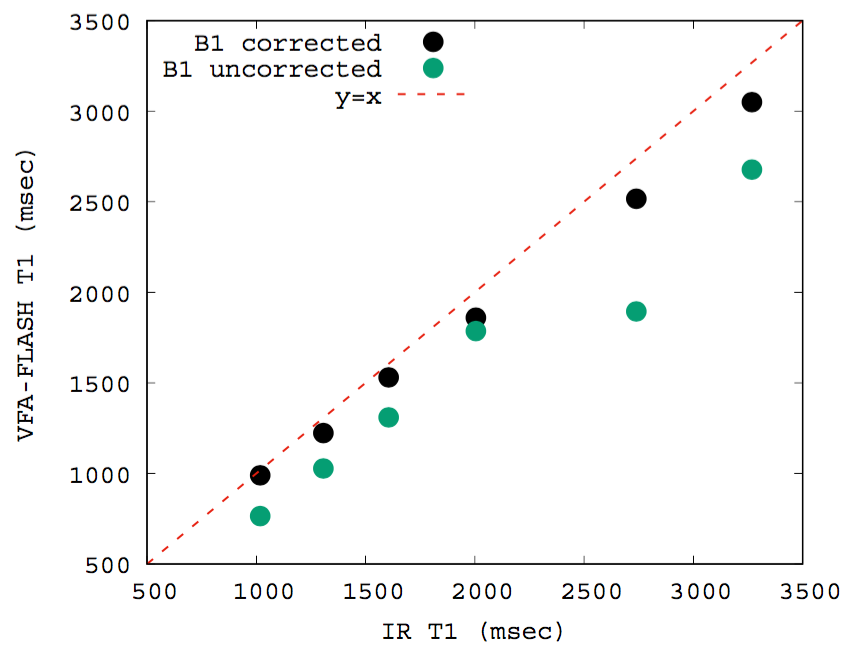
Figure. 1
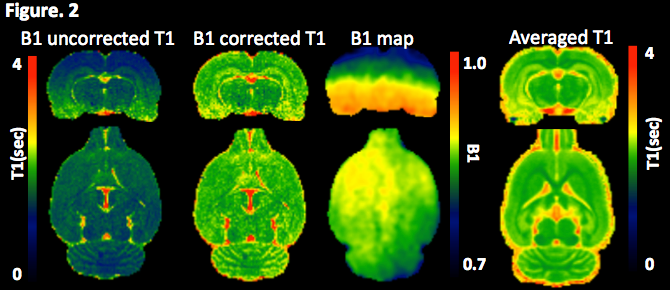
Figure. 2