3719
A rapid, whole-brain look-locker method for T1 mapping using inversion recovery EPIK1Institute of Neuroscience and Medicine, Medical Imaging Physics (INM-4), Forschungszentrum Juelich, Juelich, Germany, 2Faculty of Medicine, Department of Neurology, JARA, RWTH Aachen University, Aachen, Germany
Synopsis
Quantitative measurement of the T1 relaxation time is of great importance for the clinical diagnosis or optimisation of image contrast. Numerous Look-Locker method have been proposed for T1 mapping. One of them demonstrated by the community is TAPIR which has been shown to be fast and robust. However, TAPIR still demands substantial acquisition time for whole-brain coverage. This work aims to develop a fast Look-Locker method with whole-brain coverage on a basis of EPIK. It was shown that the proposed method acquired whole-brain T1 data (2.1 mm2 resolution × 50 slices × 30 time-points) within 3.5 minutes.
Purpose
Quantitative measurement of T1 relaxation time is of great importance in many applications. Its knowledge can be used for the diagnosis of human brain diseases or optimisation of image contrast.1-4 Numerous T1 mapping methods have been proposed based on the Look-Locker approach as it is less sensitive to B1 inhomogeneity.5 One of the presented methods is TAPIR (T1-mApping-with-Partial-Inversion-Recovery) which has been verified with clinical applications and shown to be robust and fast.3,6 However, the method still demands a substantial acquisition time for whole-brain coverage. In this work, for faster T1 mapping with whole-brain coverage, a Look-Locker method is proposed based on the EPIK (EPI with keyhole) acquisition;7 EPIK has been previously shown to have a higher temporal resolution than EPI while maintaining comparable performance in tracking dynamic MR signal changes.8 Here, the EPIK is verified with in a healthy in vivo subject and its performance is evaluated in comparison to TAPIR.Methods
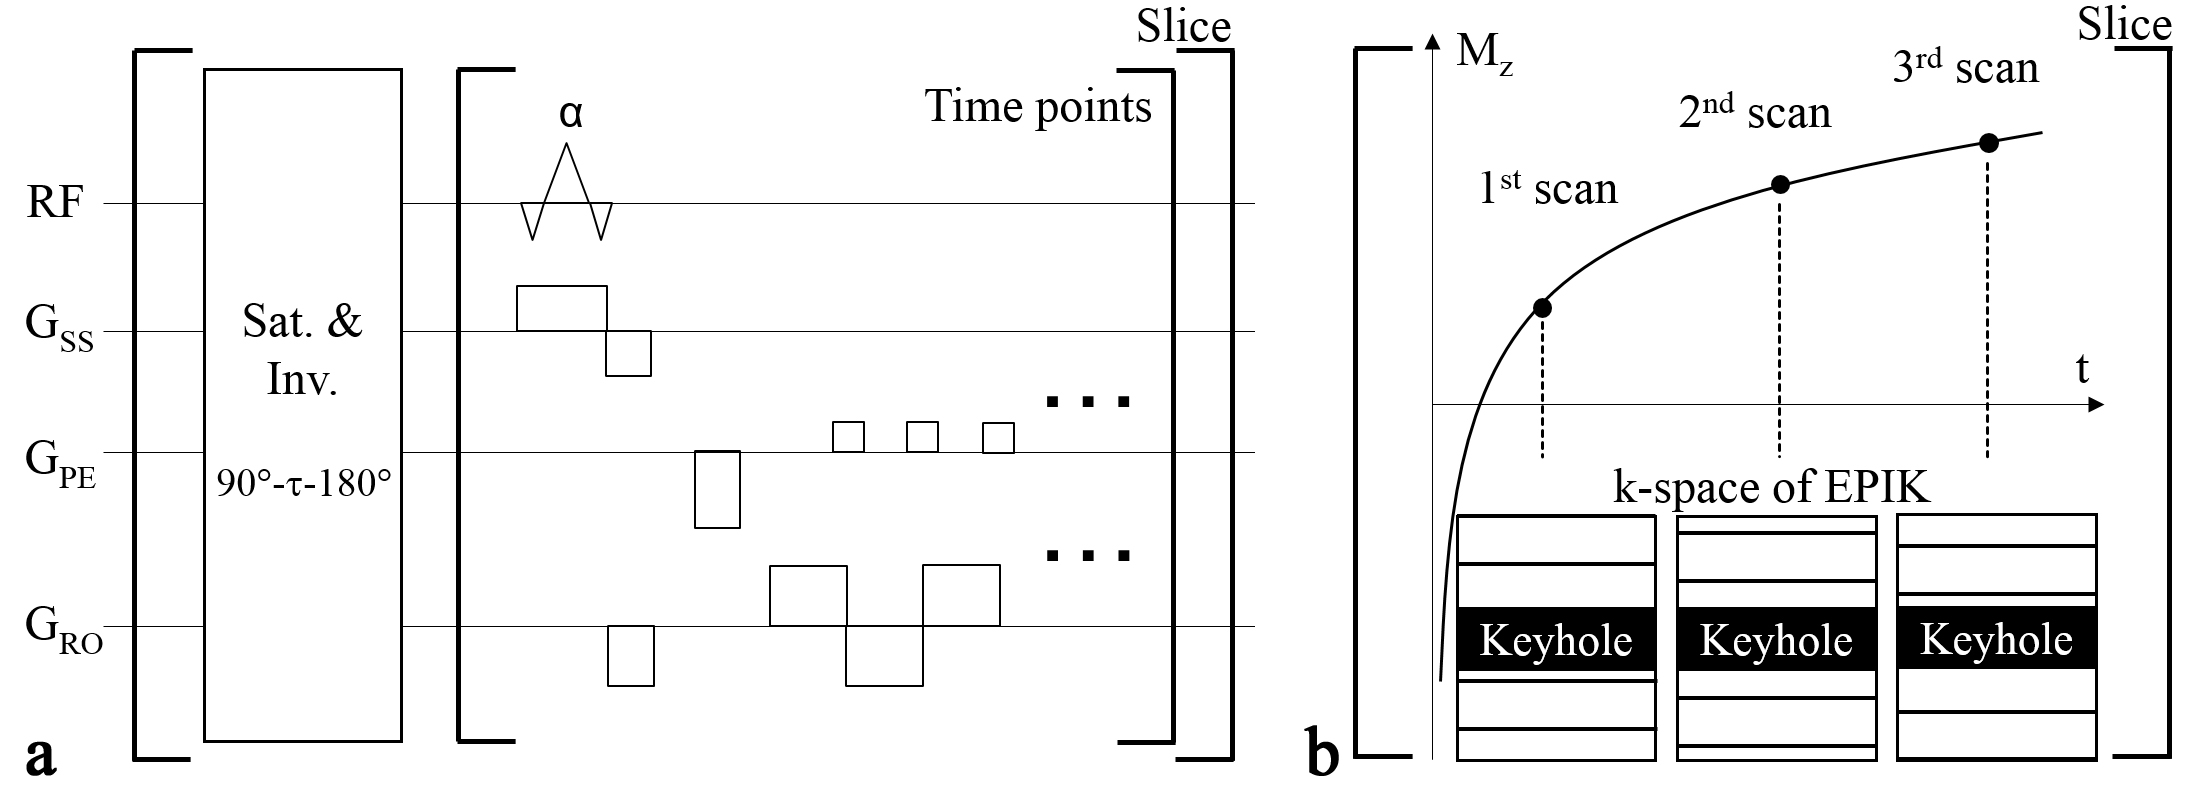
Figure 1 shows the proposed imaging sequence diagram and a schematic plot of the T1 recovery curve. The sequence begins with combined saturation and inversion preparation pulses, which is the non-selective 90°-t-180° magnetization preparation where tau was 2.4 s. The multiple time points on the curve are acquired only for a single slice and a new signal recovery starts again for other slices. The data at each time point are an individual EPIK scan. The EPIK acquisition resembles multi-shot imaging in terms of adopting segmented acquisition, but differs from it in that the segmented acquisition is applied only to peripheral k-space; full Nyquist rate sampling is instead applied to the central k-space which plays the role of the “keyhole” for every single time frame (see Fig. 1b). In this study, the keyhole region was configured as one-fourth of k-space and the peripheral region was sampled with a sparse factor of 3 (Δky' = 3/FOV). By sharing peripheral data from three consecutive scans, the entire periphery of k-space can be completely constructed; crucially, a sliding window technique was used to ensure that the keyhole and the periphery of k-space are continually updated. For a healthy subject, in vivo TAPIR data were acquired with the imaging parameters commonly used by the community: FOV = 198 × 200 mm2 (matrix: 198 × 200), TR/TE/TI = 88/9.74/20 ms, FA = 25°, slices = 4 (2 mm thickness), 2-fold acceleration and time-points = 20. Another data set using the EPIK method was acquired with the following imaging parameters: FOV = 200 × 200 mm2 (matrix: 96 × 96), TR/TE/TI = 59/25/20 ms, FA = 25°, slices = 50 (2 mm thickness) and time-points = 30. Experiments were performed on a Siemens Trio 3T MRI scanner with a 32-channel phased array coil.Results
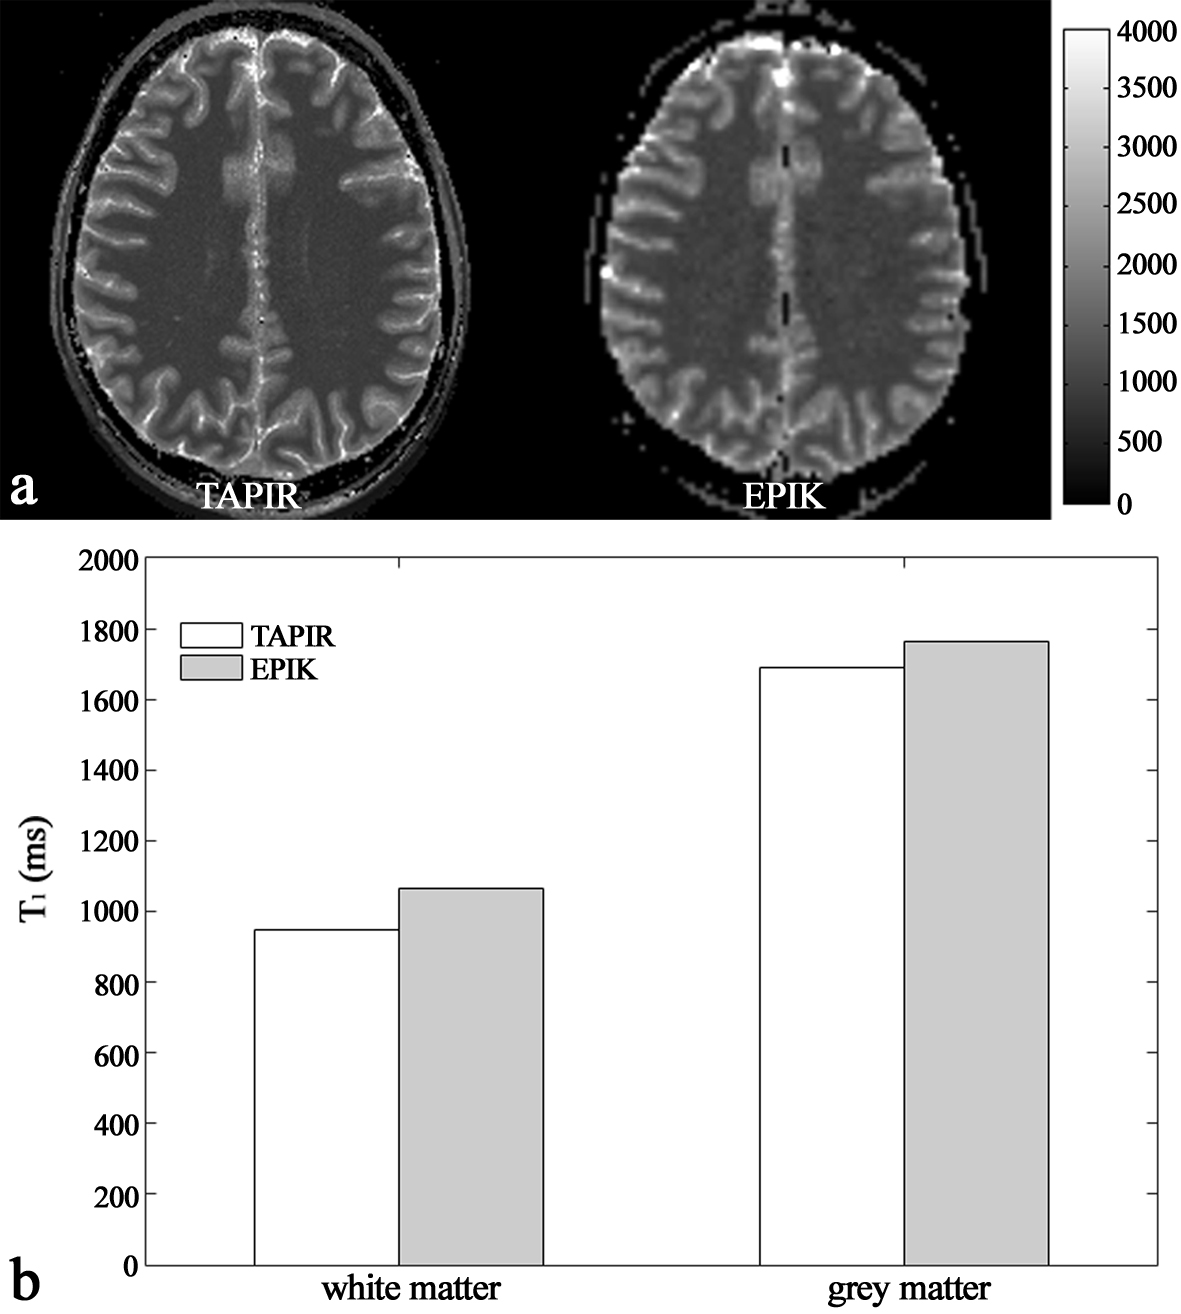
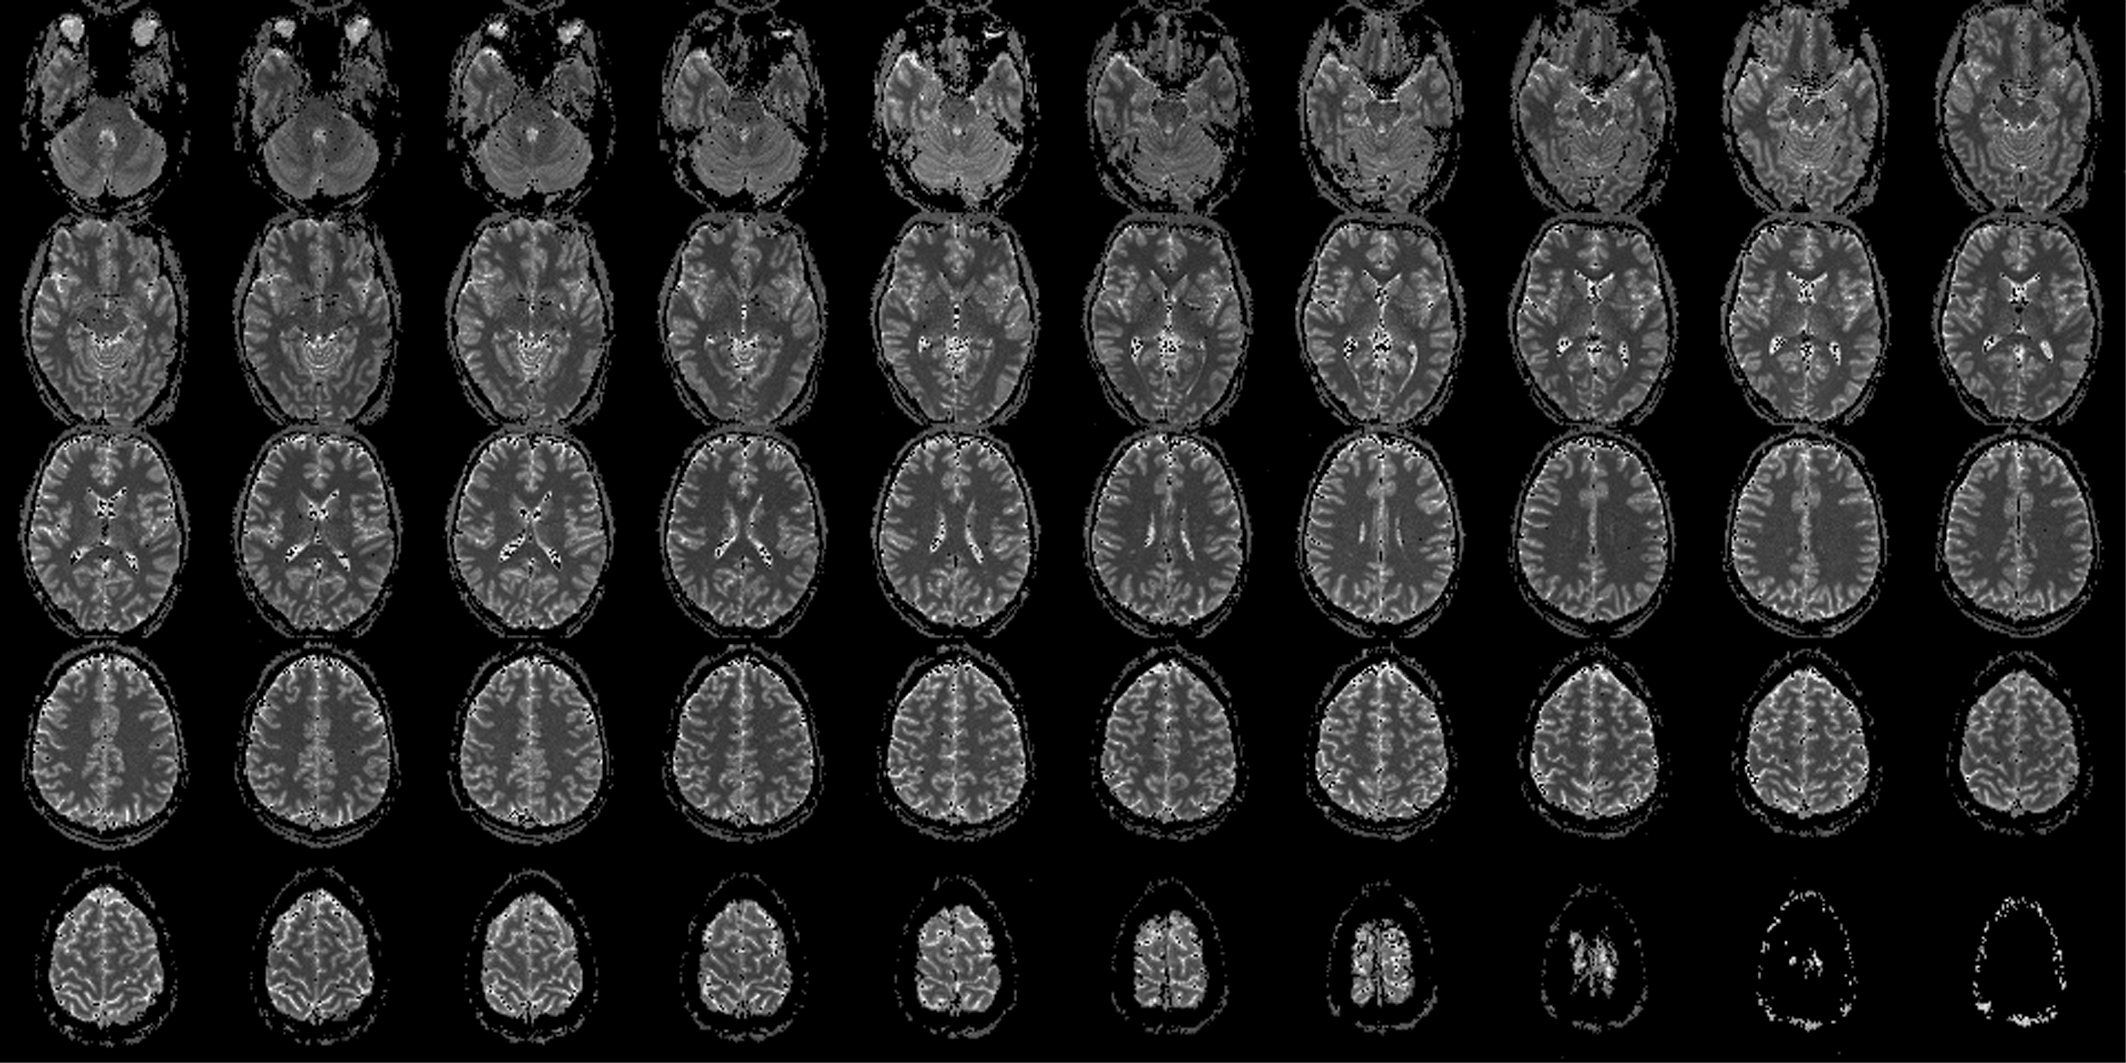
Figure 2a shows a representative slice from T1 maps obtained from each imaging method (TAPIR, EPIK). Visual inspection of the figure suggests that the T1 values from EPIK are well estimated and show quite similar patterns with those from TAPIR. For more quantitative comparison, T1 values for the grey and white matters were inspected for the slices with same locations between TAPIR and EPIK. For this purpose, the mask for the GM and WM were first obtained using the segmentation routine in the SPM12 and then, the averaged T1 value on each mask was computed. As shown in Fig. 2b, the estimated T1 values from EPIK were slightly higher than those from TAPIR; they were around 12% and 4% higher for the WM and GM regions, respectively. However, for both methods, the estimated T1 values are all in good agreement with the literature.4 Figure 3 exhibits T1 maps of entire slices (50 slices) obtained from EPIK, which reveals that the T1 values are well estimated without any severe artefacts for all slices.Conclusion and Discussion
For fast T1 mapping with whole-brain coverage, a Look-Locker method based on EPIK is demonstrated. The proposed method was able to acquire the entire T1 recovery data (2.1 mm2 resolution × 50 slices × 30 time-points) within 3.5 minutes. The estimated T1 values from EPIK were comparable to those from TAPIR, but found to be slightly higher. A previous study has reported that the T1 estimation results can be different depending on the employed imaging sequences.4 Additionally, we have previously documented the dependence of the T1 values on the echo time employed;9 T1 increases by nearly 100 ms between TE = 9.5 and TE = 25 ms. For more quantitative analysis on TAPIR and EPIK, a comparison study with more number of subjects will be performed in the future work.Acknowledgements
No acknowledgement found.References
1. Lüdemann L, Warmuth C, Plotkin M, et al. Brain tumor perfusion: comparison of dynamic contrast enhanced magnetic resonance imaging using T1, T2, and T2* contrast, pulsed arterial spin labeling, and H2(15)O positron emission tomography. Eur J Radiol. 2009;70(3):465-474.
2. Gideon P, Rosenbaum S, Sperling B, et al. MR-visible brain water content in human acute stroke. Magn Reson Imaging. 1999;17(2):301-304.
3. Shah NJ, Neeb H, Kircheis G, et al. Quantitative cerebral water content mapping in hepatic encephalopathy. Neuroimage. 2008;41(3):706-717.
4. Wright PJ, Mougin OE, Totman JJ, et al. Water proton T1 measurements in brain tissue at 7, 3, and 1.5 T using IR-EPI, IR-TSE, and MPRAGE: results and optimization. MAGMA. 2008;21(1-2):121-130.
5. Li W, Griswold M, Yu X. Rapid T1 mapping of mouse myocardium with saturation recovery Look-Locker method. Magn Reson Med. 2010;64(5):1296-1303.
6. Taheri S, Gasparovic C, Shah NJ, et al. Quantitative measurement of blood-brain barrier permeability in human using dynamic contrast-enhanced MRI with fast T1 mapping. Magn Reson Med. 2011;65(4):1036-1042.
7. Zaitsev M, Zilles K, Shah NJ. Shared k-space echo planar imaging with keyhole. Magn Reson Med. 2001;45(1):109-117.
8. Yun S, Reske M, Vahedipour K, et al. Parallel imaging acceleration of EPIK for reduced image distortions in fMRI. NeuroImage. 2013;73:135-143.
9. Oros-Peusquens AM, Keil F, Shah NJ. Fast two-dimensional relaxometric characterisation of brain tissue in vivo: is T1 relaxation multi-component? In: Proc. Intl. Soc. Mag. Reson. Med. 18 (2010) 4988.
Figures