3714
SNR Efficiency in Multi-Parameter Mapping (PD, T1 & T2*) at 3T: Comparison of MP2RAGE and VFA-FLASH1Oncology, University of Alberta, Edmonton, AB, Canada, 2Medical Physics, Cross Cancer Institute, Edmonton, AB, Canada, 3MR Clinical Science, Philips Healthcare Canada, Markham, ON, Canada
Synopsis
Quantitative parametric mapping is becoming increasingly promising for improving the diagnostic quality and reproducibility of structural brain MR images. The variable flip angle technique with FLASH (VFA-FLASH) is a popular technique for mapping the proton-density, T1 and T2*. Recently, the MP2RAGE pulse sequence was developed to map T1 with robustness to RF inhomogeneity. If a multi-echo (bipolar) MP2RAGE is employed, proton-density and T2* can also be mapped simultaneously. In this study we compare the SNR efficiency and accuracy of VFA-FLASH and MP2RAGE for multi-parameter mapping at 3T. Both methods yield comparable T1-to-noise ratios, but VFA-FLASH is superior for PD and T2* mapping.
Purpose
Multi-parameter mapping (MPM) is becoming increasingly promising for improving the diagnostic quality and reproducibility of structural brain MR images. The variable flip angle technique with FLASH (VFA-FLASH) is a popular technique for mapping the proton-density (PD), T1 and T2* [1–2]. Recently, the MP2RAGE pulse sequence was developed to map T1 with an intrinsic robustness to RF inhomogeneity [3]. If a multi-echo (bipolar) MP2RAGE is employed, proton-density and T2* can also be mapped simultaneously [4]. In this study we have optimized both VFA-FLASH and MP2RAGE for MPM at 3T and compare their SNR efficiency and accuracy via phantom measurements and in the brain of volunteers.Methods
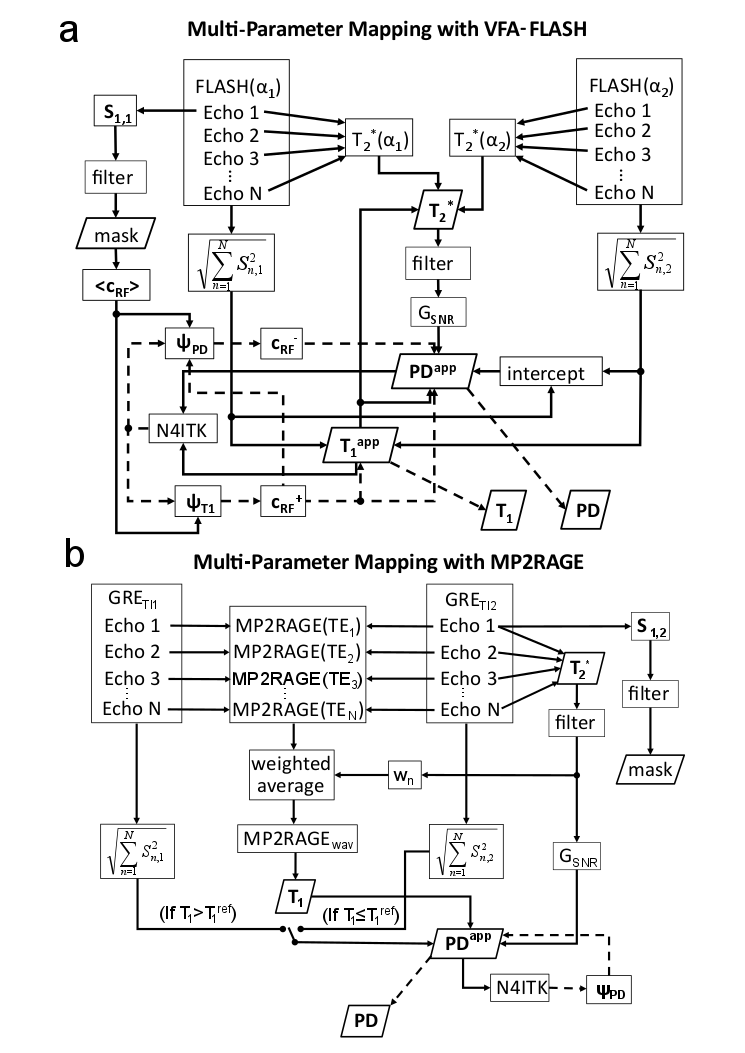
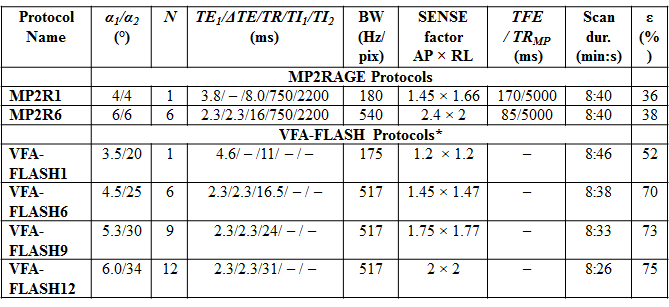
Both single-echo and multi-echo (bipolar) VFA-FLASH and MP2RAGE protocols were optimized with total scan durations of <9 minutes and a 1-mm isotropic resolution on a Philips 3T Achieva scanner equipped with an 8-channel receiver head array (see Table 1). Image post-processing pipelines were designed and optimized to curve-fit PD, T1 and T2* with optimal SNR efficiency (see Fig. 1). For VFA-FLASH, both B1+/B1- inhomogeneity in PD and T1 were corrected using the UNICORT technique [5] and the N4ITK bias-field correction algorithm [6]. UNICORT was also required to correct the B1- inhomogeneity in the MP2RAGE PD maps (see Fig. 1b).
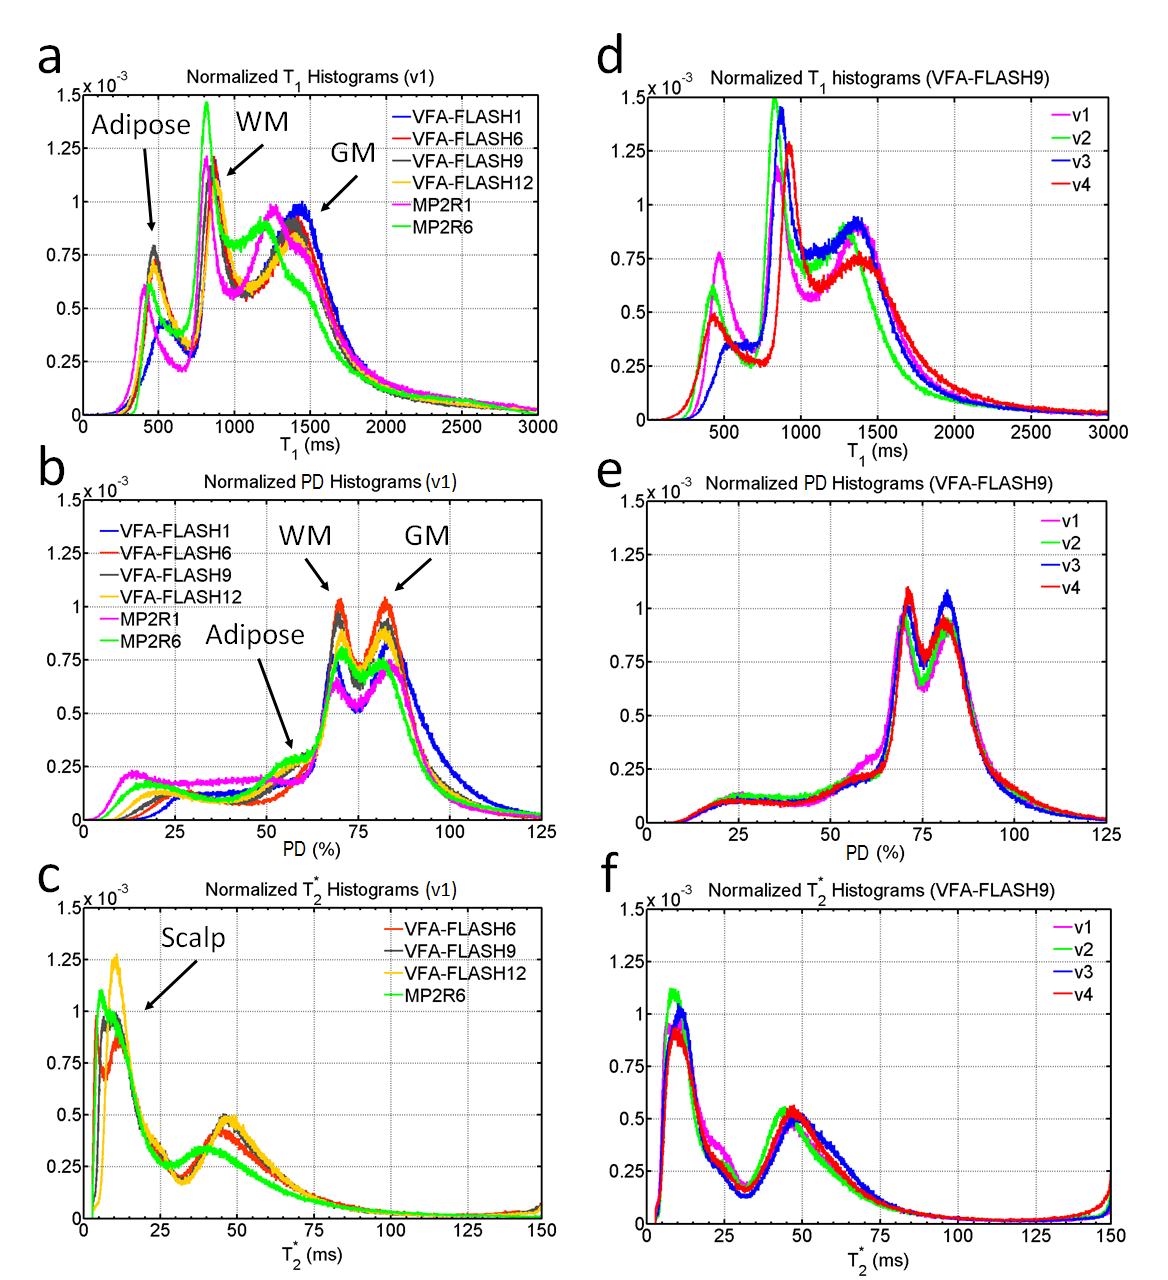
The VFA-FLASH and MP2RAGE T1 values were compared in a 5-layered agar phantom (differentially doped with MnCl2) to a gold-standard inversion recovery sequence (TI=50, 250, 500, 800, 1200, 1700, 2300, and 3200). SNR measurements were also made in the T1, PD and T2* maps (5 ROIs per layer), using the method of Preibisch and Deichmann [7]. One volunteer was scanned with all 6 protocols (listed in the table of Figure 2), while the other three volunteers were scanned with only the VFA-FLASH9, the MP2R1 and MP2R6 protocols. Image histograms of the T1, PD and T2* and measurements in brain ROIs were compared across the different protocols and volunteers.
Results
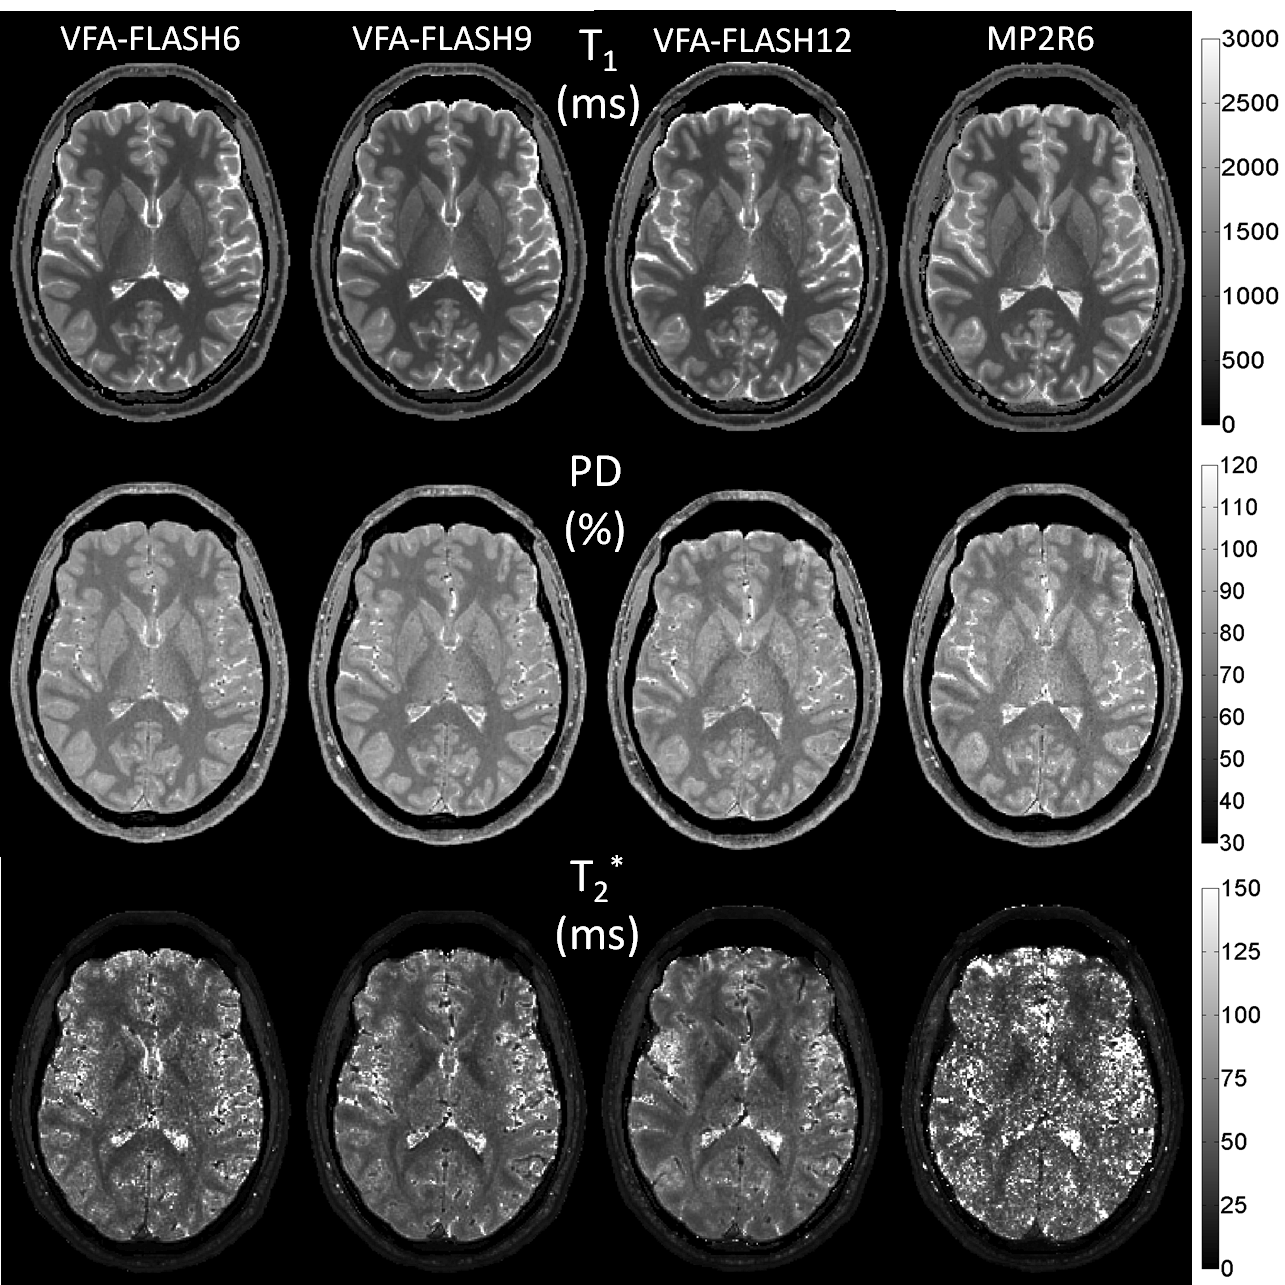
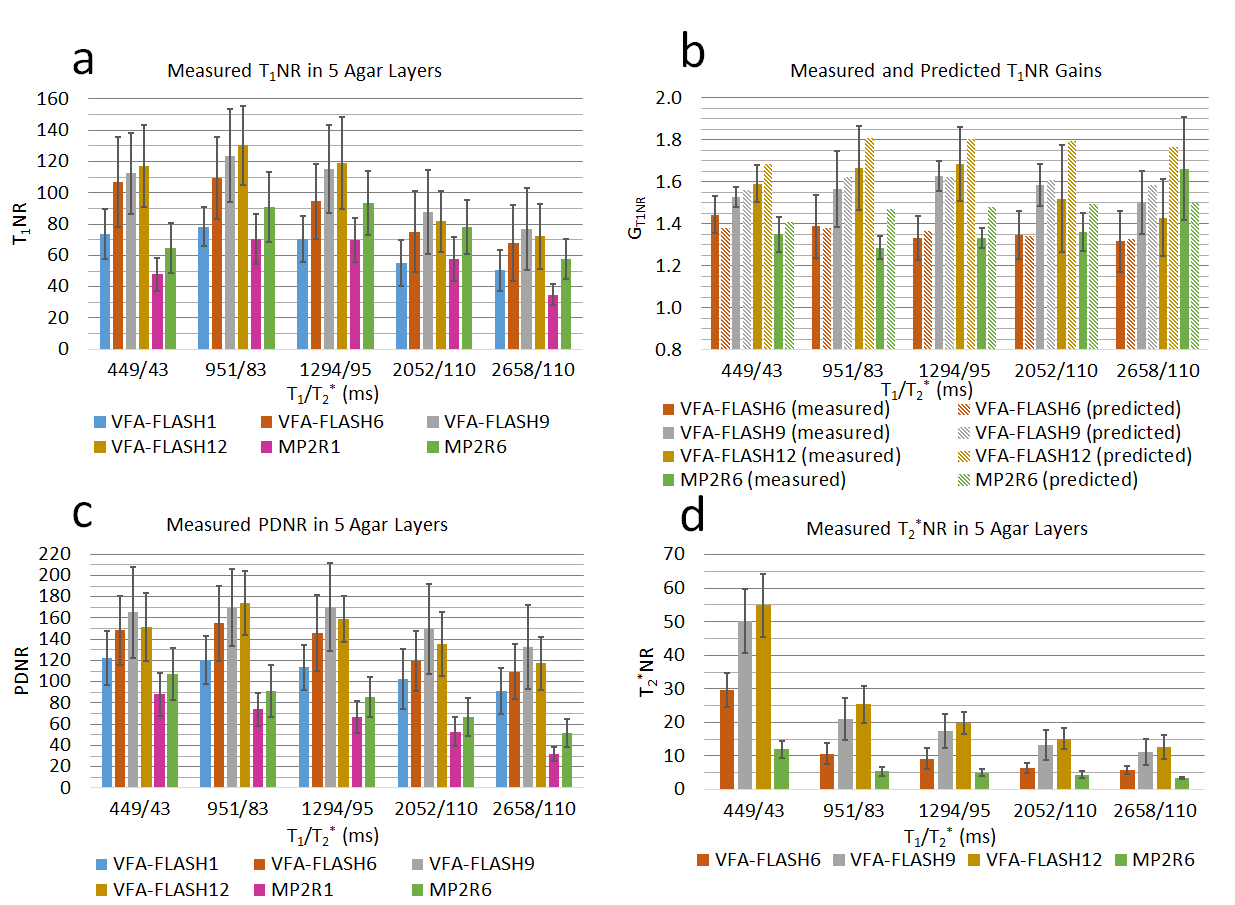
A comparison of the in vivo parametric maps derived from the different MPM protocols is shown in Figure 3. MP2RAGE could not yield a T2* map of acceptable quality (see Fig. 3), therefore the T2* map from VFAFLASH9 was used to curve-fit for PD in MP2RAGE. Bar charts of the SNR measured in the phantom is shown in Figure 4, revealing that VFA-FLASH yields comparable T1NR efficiency as MP2RAGE but considerably superior PDNR and T2*NR. For moderate parallel imaging acceleration factors (R≤1.75×1.75), multi-echo bipolar MPM protocols also yield T1NR gains (over a single-echo protocol) in agreement with the theoretical predictions (Fig. 4b). Histograms of PD, T1 and T2* are compared for the different protocols and volunteers in Figure 5.Discussion and Conclusions
Because of its superior sampling efficiency, the VFA-FLASH technique outperforms MP2RAGE in MPM, although MP2RAGE has the advantage of yielding lower intra- and inter-subject coefficients of variations in T1 (~3%) compared to VFA-FLASH (~7%). This is most likely because the intrinsic robustness of MP2RAGE to RF inhomogeneity, as opposed to VFA-FLASH which requires a retrospective correction. The MP2RAGE T1 measured in vivo was ~4% lower (on average) than the VFA-FLASH values, most plausibly because of magnetization-transfer effects [8]. The VFA-FLASH9 protocol yields the best overall SNR efficiency. Using multi-echo (high-bandwidth) bipolar sequences enables T1NR gains of ~1.35-/1.66-fold for VFA-FLASH or ~1.4-fold for MP2RAGE, over a single-echo (low-bandwidth) protocol of the same scan duration.Acknowledgements
Funding from the Alberta Cancer Foundation, Alberta Cancer Research Institute, and Natural Sciences and Engineering Research Council (Canada) is gratefully acknowledged. We also thank Philips Healthcare for technical support and Dr. Roger Luechinger for the PATI program used for data transfer.References
1. Weiskopf N, Suckling J, Williams G, Correia MM, Inkster B, Tait R, Ooi C, Bullmore ET, Lutti A. Quantitative multi-parameter mapping of R1, PD*, MT, and R2* at 3T: A multi-center validation. Front. Neurosci. 2013;7:1–11.
2. Volz S, Nöth U, Jurcoane A, Ziemann U, Hattingen E, Deichmann R. Quantitative proton density mapping: correcting the receiver sensitivity bias via pseudo proton densities. Neuroimage 2012;63:540–52.
3. Marques JP, Kober T, Krueger G, Van der Zwaag W, Van de Moortele P-F, Gruetter R. MP2RAGE, a self bias-field corrected sequence for improved segmentation and T1-mapping at high field. Neuroimage 2010;49:1271–81.
4. Jutras J-D, Wachowicz K, Gilbert G and De Zanche N. SNR efficiency of combined bipolar gradient echoes: comparison of 3D FLASH, MPRAGE and multiparameter mapping with VFA-FLASH and MP2RAGE. Magn Reson Med 2016; (early view). DOI 10.1002/mrm.26306
5. Weiskopf N, Lutti A, Helms G, Novak M, Ashburner J, Hutton C. Unified segmentation based correction of R1 brain maps for RF transmit field inhomogeneities (UNICORT). Neuroimage 2011;54:2116–24.
6. Tustison NJ, Avants BB, Cook PA, Zheng Y, Egan A, Yushkevich PA, Gee JC. N4ITK: improved N3 bias correction. IEEE Trans. Med. Imaging 2010;29:1310–20.
7. Preibisch C and Deichmann R. T1 mapping using spoiled FLASH-EPI hybrid sequences and varying flip angles. Magn Reson Med 2009; 62: 240-246.
8. Rioux JA, Levesque IR, Rutt BK. Biexponential longitudinal relaxation in white matter: Characterization and impact on T1 mapping with IR-FSE and MP2RAGE. Magn. Reson. Med. 2016;75:2265-2277.
Figures