3713
Whole Body Rapid T2 Quantification using Dual Echo Fast Spin Echo1Physics, University of Alberta, Edmonton, AB, Canada, 2Biomedical Engineering, University of Alberta, Edmonton, AB, Canada
Synopsis
We examine RF field variation on a modern 3T and illustrate T2 quantification using only PD and T2w fast spin echo images and a rapid flip angle map in the abdomen, spine, head, neck, and leg. Across the whole body at 3T or higher fields, RF field variation yields a wide variation in flip angles, requiring direct sequence modelling to achieve accurate T2.
Introduction
Proton density (PD) and T2-weighted (T2w) images are frequently acquired in MRI protocols. Recently, means have been developed for directly deriving T2 from this pair of fast spin echo (FSE) images from the human brain, when flip angle maps are known1. At 3 T, or higher fields, the RF field can vary substantially across the field of view, yielding a wide range of flip angles within an imaging slice. Exponential fitting of T2 decay will not be accurate in such cases due to non-ideal refocusing. This arises from RF interference, slice profile effects, and nominal-flip angle choices. In this work, we examine RF field variation across the body and perform rapid T2 measurements by fitting PD and T2w fast spin echo images using indirect and stimulated echo compensation (ISEC). We demonstrate its utility in the abdomen, spine, head, neck and leg.Methods
MRI images were acquired in three volunteers (mean age 43±12, 2 male) on a 3 T Siemens Prisma MRI system. Flip angle maps and dual echo fast spin echo images were acquired in different regions of the body from head to foot including head, neck, abdomen, spine, and leg. Typical dual echo fast spin echo scan parameters were: TE 10.1, 90.9 ms; echo train length 8; echo spacing 10.1 ms; TR 5300; nominal refocusing 165º, acquisition time 5:00. Respiratory triggering was used in the abdomen.
Rapid Flip angle maps were acquired either using single shot EPI for the double angle method2 with a correction for slice profile (acquisition time 20 s) or a Bloch-Seigert3 approach (acquisition time 30 s). Normalized flip angle maps (B1) are expressed as a ratio of the flip angle achieved at the centre of the slice relative to the requested angle.
T2 fitting was performed by fully simulating the fast spin echo sequences to compensate for both spin echo and stimulated echo pathways, as previously described1. Gradient and RF pulse shapes, amplitudes and timing were used to create a look-up table of T2 decay curves for a range of T2 and B1 values. Simulation code makes use of Shinnar-Le Roux4 algorithm for simulating RF pulses, and Bloch solutions for simulating decay between RF pulses. Relative PD/T2 signal intensities and known B1 are then used to find the nearest point in the table (T2 is measured to the nearest 0.1 ms).
Results
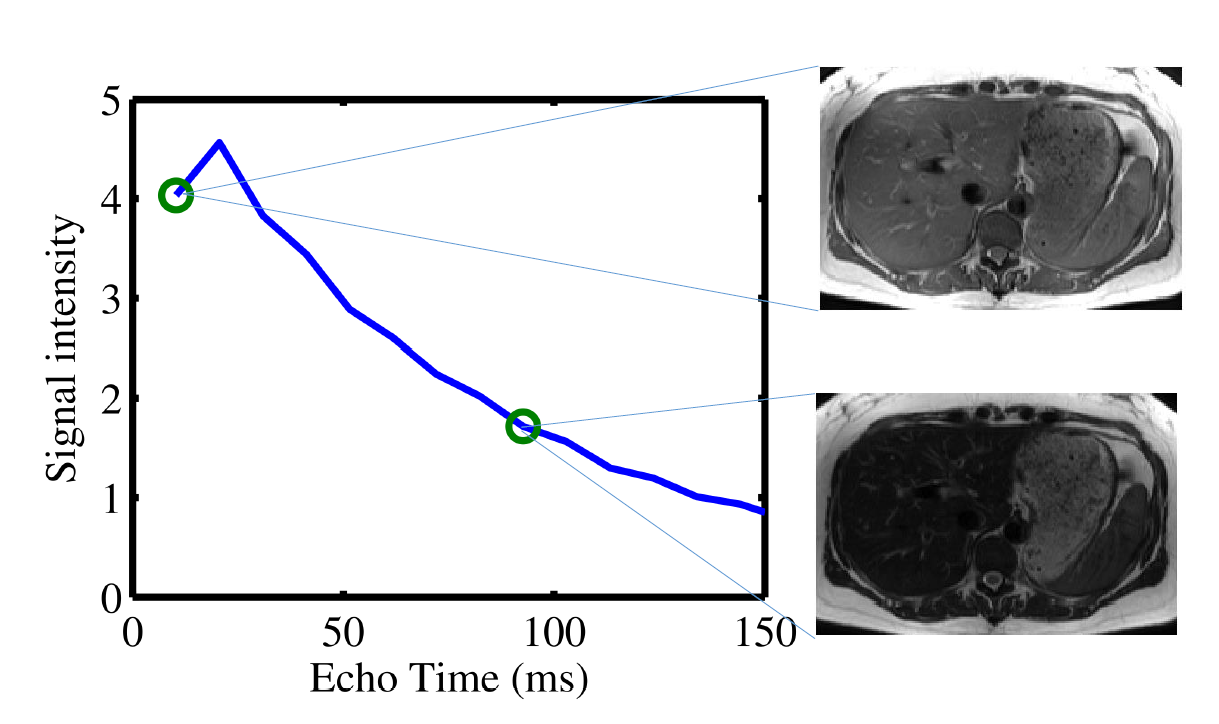
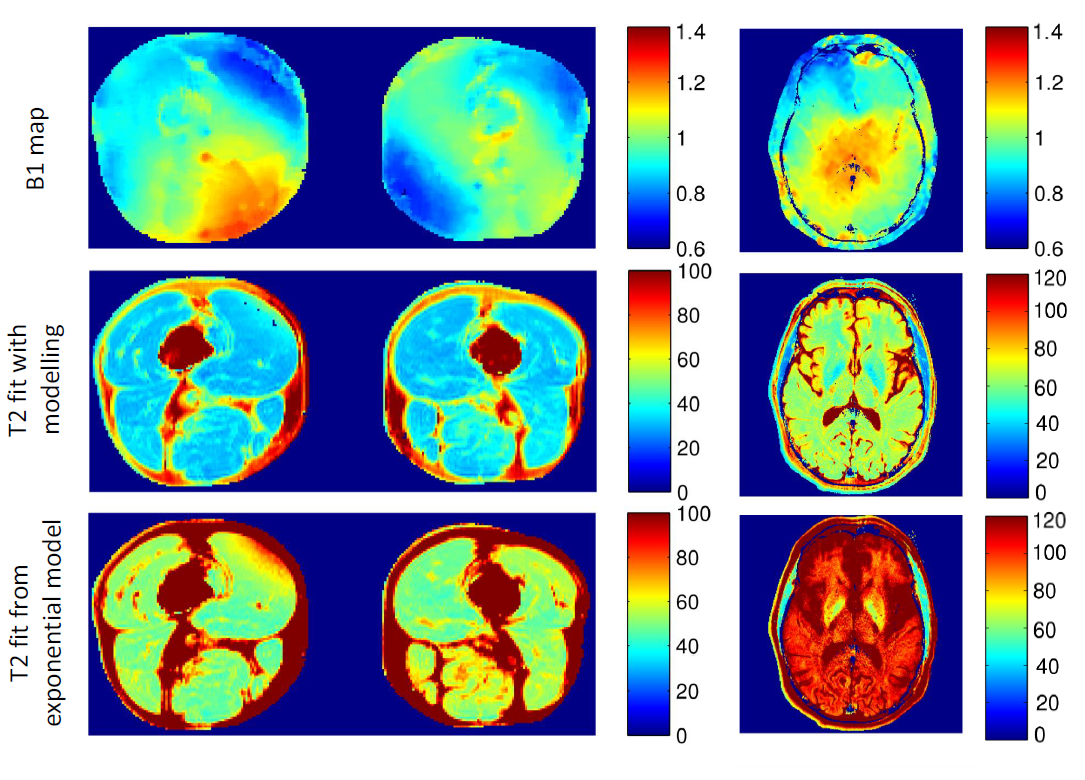
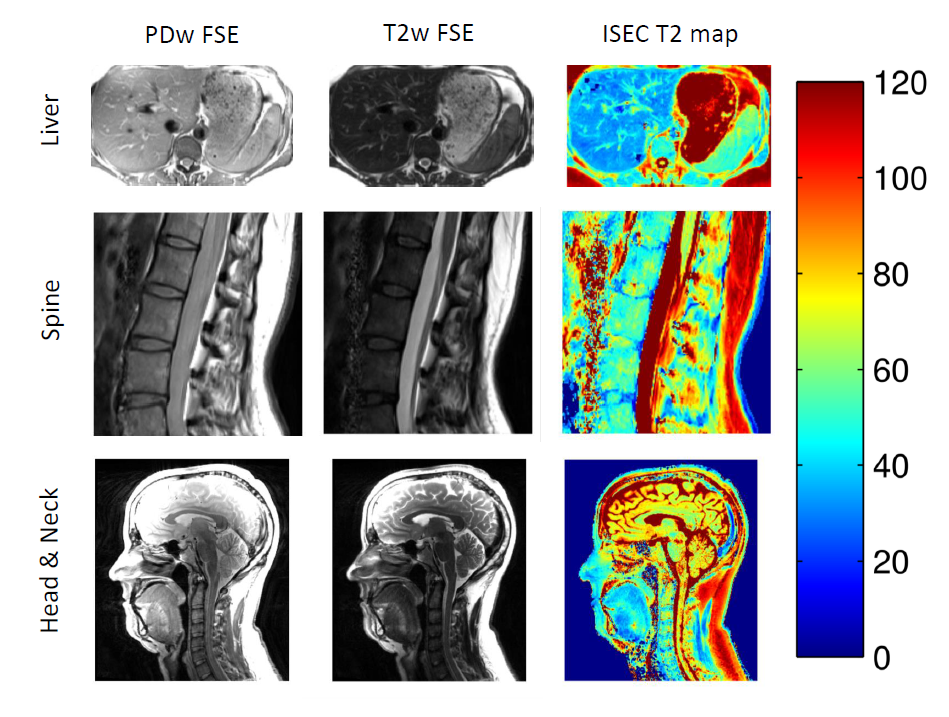
Non-exponential decay occurs due to indirect and stimulated echo pathways, as shown in Figure 1. However, this is not evident when only a dual-echo experiment is acquired. B1 maps show substantial variation in flip angle within imaged regions (Figure 2). B1 varies approximately ±30% in the abdomen, ±10% across the neck, ±25% across the head, and ±25% across the thighs. T2 maps obtained from ISEC modelling are compared to T2 found from exponential fitting (Figure 2) in the thigh and the brain. Exponential fitting results in over-estimation of T2 values. T2 maps from ISEC fitting of PD and T2w images from the liver, spine and neck are also shown (Figure 3).Discussion and Conclusions
The
substantial RF variation at 3T across the body, even on a modern MRI system,
illustrates the imprecision in nominal flip angle assignment. By using a flip
angle map, precise spin pathways may be modeled. We have shown that using a rapid PD and
T2-weighted image, T2 measurement may be performed across body regions. Flip
angles show substantial variation in all body regions, leading to non-ideal RF
flip angles which produce stimulated and indirect echoes that require careful
modeling. Two point ISEC modelling allows for accurate T2 quantification
without specialized imaging sequences, or the long acquisition times required
for multi-echo spin echo experiments. Especially
when PD and T2 weighting are already part of clinical protocols, this method
enables rapid T2 quantification across the body.
Acknowledgements
Grant support was provided by Natural Sciences and Engineering Council of Canada (NSERC) and the Canadian Institutes of Health Research. Salary support for KCM was provided by scholarships from Natural Sciences and Engineering Council of Canada, and Alberta Innovates Health Solutions.References
1. McPhee KC, Wilman AH. T2 quantification from only proton density and T2-weighted MRI by modelling actual refocusing angles. Neuroimage 2015;118:642-50.
2. Stollberger R, Wach P. Imaging of the active B1 field in vivo. Magn Reson Med. 1996;35:246-51.
3. Sacolick LI, Wiesinger F, I, MW. B1 Mapping by Bloch-Siegert Shift. Magn Reson Med. 2010 May; 63(5): 1315–1322.
4. Pauly J, Le Roux, P, Nishimura, D, Macovski, A. Parameter relations for the Shinnar-Le Roux selective excitation pulse design algorithm. IEEE Trans Med Imag, 10(1):53–65, 1991.
Figures