3712
Direct Relaxation Measurement from Clinical Sequences1Physics, University of Alberta, Edmonton, AB, Canada, 2Biomedical Engineering, University of Alberta, Edmonton, AB, Canada
Synopsis
Through exact sequence response modeling using the Bloch equations, we propose direct extraction of quantitative T1 and T2 relaxation maps from standard clinical MRI sequences. This approach eliminates the need for excess specialized and complex sequences by measuring relaxation directly from clinical sequences. We demonstrate this method to determine T2 and T1 using a standard brain protocol of fast spin echo images weighted by proton-density, T2 and FLAIR at 3 T. Our approach opens the door to wider use of quantitative MRI.
Introduction
Through exact sequence response modeling using the Bloch equations, we propose direct extraction of quantitative T1 and T2 relaxation maps from standard clinical MRI sequences. Recently, methods for accurately quantifying T2 from only a Proton Density (PD) and a T2 weighted FSE image, and a B1 map has been reported1. Here, with the addition of a T2-weighted FLAIR image, we demonstrate that a T1 map may also be estimated. This approach eliminates the need for excess specialized and complex sequences by measuring relaxation directly from clinical sequences. Central to this work is the idea that every clinical MRI sequence may be precisely modeled and used to build up a library of information to determine relaxation parameters. We demonstrate this method to determine T2 and T1 using a standard brain protocol at 3 T of Fast Spin Echo (FSE) images weighted by PD, T2 and FLAIR.Methods
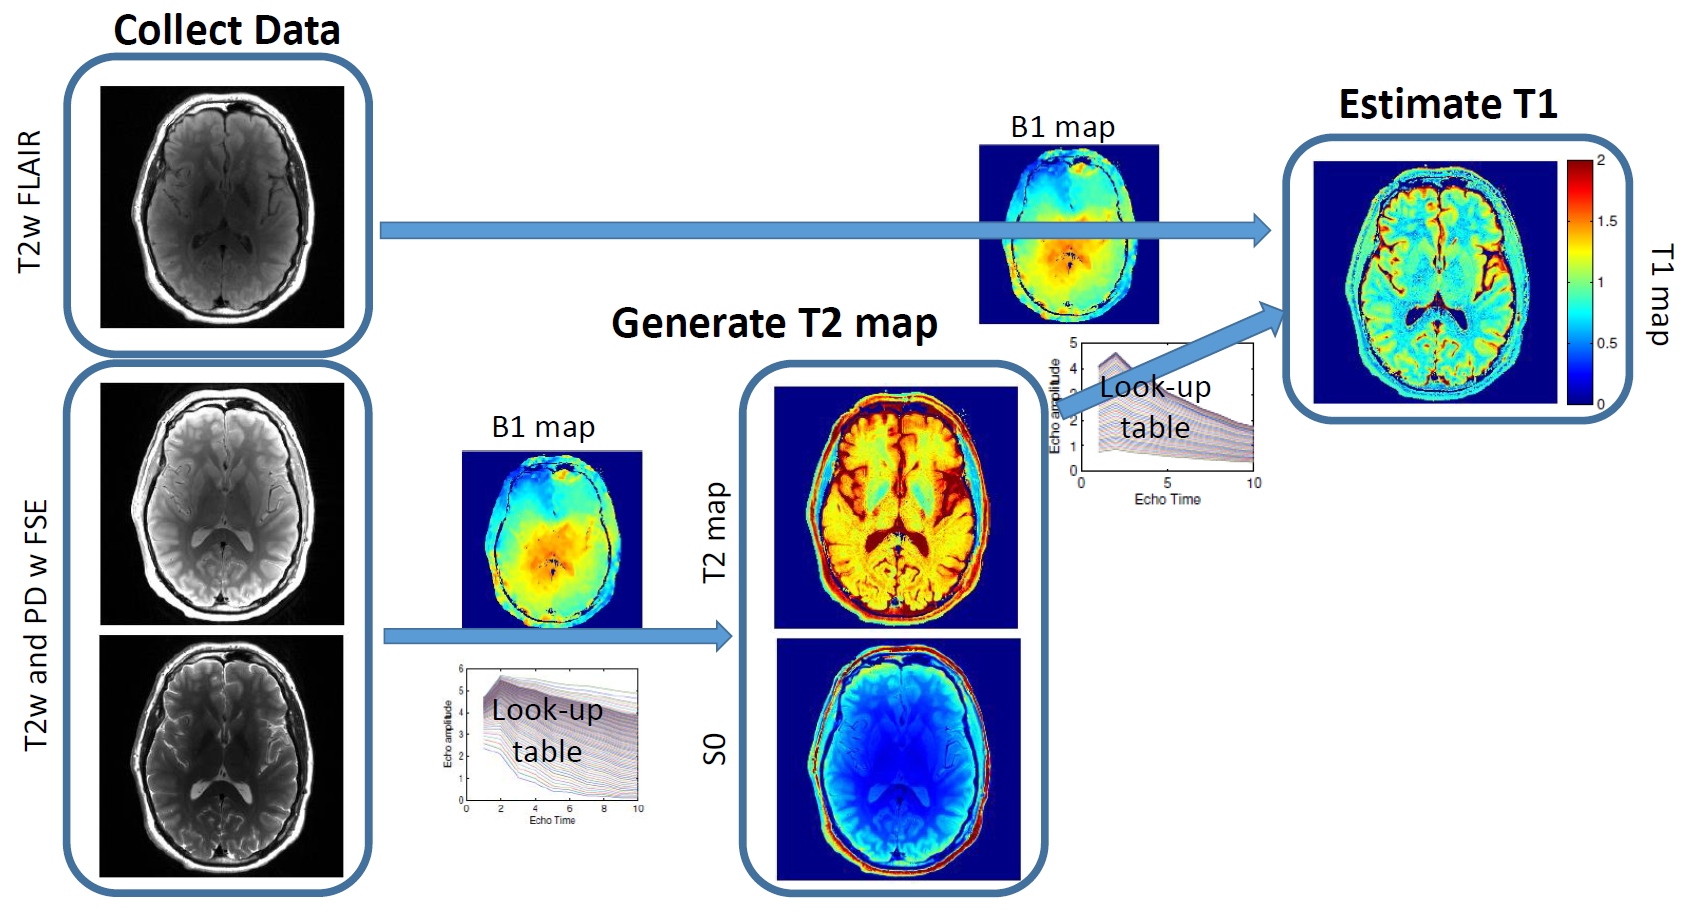
A flow chart of the image processing steps is shown in Figure 1.
MRI acquisition: Two volunteers (mean age 30.5±0.6, 1 male) were imaged on a 3 T Siemens Prisma MRI system. A dual echo FSE (TE =10.1, 90.9ms; Turbo factor=8; TR=6000ms; nominal refocussing=165º; resolution=0.86×0.8×3mm3, matrix=256×256×30; acquisition time=~2 min), FLAIR (TI=2200ms; dual echo TE=10.1, 90.9ms; Turbo factor=8; TR=6000ms; nominal refocusing=165º; resolution=0.86×0.8×3mm3; matrix=256×256×30, acquisition time=4 min). For T1 validation, five additional inversion-prepared FSE images (TI=50, 100, 200, 500, 2200, 3000ms) were acquired. B1 maps used single shot EPI (nominal excitation 60° and 120°; TE=23ms; acquisition time 28s).
T2 fitting was performed using fully simulated FSE sequences to compensate for both spin echo and stimulated echo pathways, as previously described1 using the PD and T2-weighted images and the B1 map.
Flip angle maps were acquired using the double angle method2 with a correction for slice profile, as previously described1. Normalized flip angle maps (B1) are expressed as a ratio of the flip angle achieved at the centre of the slice relative to the requested angle.
Inversion Recovery (IR) T1 mapping: The six inversion prepared PD-weighted FSE images were fit pixel by pixel for T1 via S = S0(1-f exp(-TI/T1)), where f is inversion efficiency and TI is inversion time. This provided a reference T1 map for validation.
T1 Estimation from T2w FLAIR: With knowledge of sequence parameters (gradient and RF pulse shapes and timing), a look-up table of inversion prepared signal intensities for TI=2200ms was created for a range of T1 (500-2500ms), T2 (20-200ms), B1 (0.5-1.4), at each echo time in the FSE readout train. Signal intensities were simulated by adding an inversion prep pulse to previously described FSE simulations1. Using the S0 fit parameter from the T2 fitting (note that the FSE readout for the FLAIR image was matched to the dual echo FSE) to remove the scaling parameter from the FLAIR image intensity, the un-scaled T2w FLAIR signal, known T2 and B1 can then be compared pixel by pixel to the lookup table to estimate a T1 map.
Results
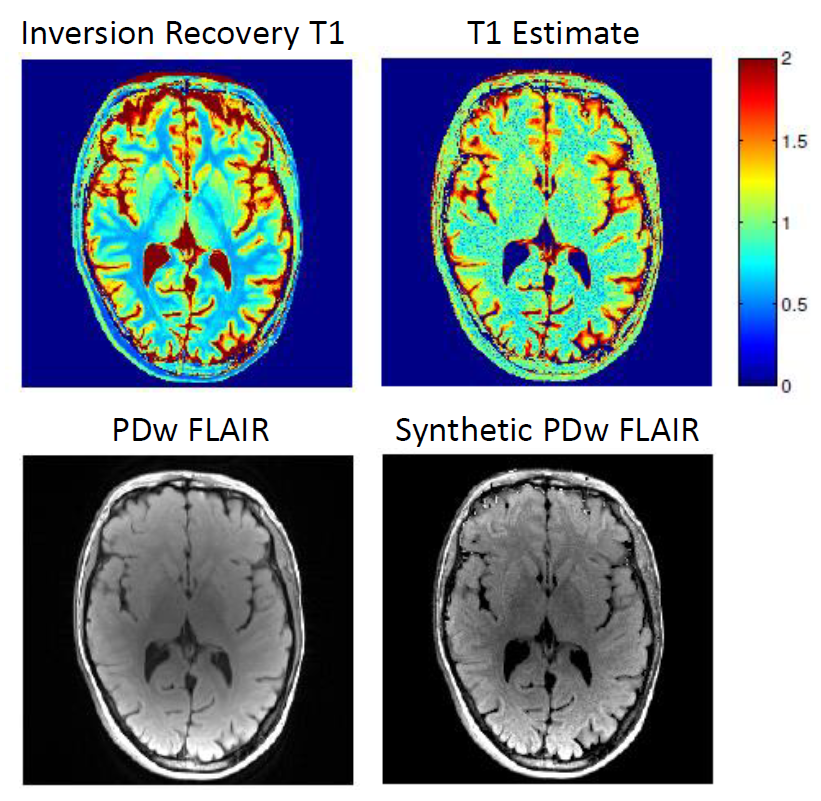
The estimated T1 map is compared to the T1 map acquired from the IR experiment in Figure 2 (top row). A synthetic PDw FLAIR image may also be obtained from this algorithm by extrapolating back to the first echo time. Also in Figure 2, the synthetic PDw FLAIR is compared to the acquired PDw FLAIR (bottom row). The estimated T1 map is noisier than the multiple inversion T1 map. Inversion recovery T1 values in the white matter are shorter than reported in literature3. The synthetic FLAIR image is similar to the acquired image, though with increased relative noise.
Discussion
The proposed protocol currently requires the repetition time and receiver gain to remain constant between the dual-echo FSE and the FLAIR images. Because the T1 estimate comes from a single image it is susceptible to noise, and is affected by a combination of noise in the T2w FLAIR image, the PD and T2w FSE images, and uncertainty in the B1 map. The sensitivity to noise could potentially be reduced by further post-processing steps or the addition of additional T1-weighted FSE sequences that may already be part of the clinical protocol. The general approach of using only available clinical sequences in existing protocols, opens the door to wider use of quantitative relaxation measurement.Conclusion
We determined T1 and T2 from only T2w, PDw, and T2w FLAIR images and a B1 map. Except for the B1 map, versions of all sequences are part of a standard brain protocol, therefore not requiring additional sequences to derive relaxation parameters.Acknowledgements
Grant support was provided by Natural Sciences and Engineering Council of Canada (NSERC) and the Canadian Institutes of Health Research. Salary support for KCM was provided by scholarships from Natural Sciences and Engineering Council of Canada, and Alberta Innovates Health Solutions.References
1. McPhee KC, Wilman AH. T2 quantification from only proton density and T2-weighted MRI by modelling actual refocusing angles. Neuroimage 2015;118:642-50.
2. Stollberger R, Wach P. Imaging of the active B1 field in vivo. Magn Reson Med. 1996;35:246-51.
3. Wansapura JP, Holland SK, Dunn RS, Ball WS Jr. NMR relaxation times in the human brain at 3.0 tesla. J Magn Reson Imaging. 1999 9(4):531-538.
Figures