3709
Measuring cerebral glucose metabolism in vivo using hyperpolarized 13C labelled glucose1Laboratory for Functional and Metabolic Imaging, Ecole Polytechnique Federale de Lausanne (EPFL), Lausanne, Switzerland, 2Institute of Physics of Biological Systems, Ecole Polytechnique Federale de Lausanne (EPFL), Lausanne, Switzerland, 3Advanced Imaging Research Center, University of Texas Southwestern Medical Center, Dallas, TX, United States, 4Albeda Research, ApS, Copenhagen, Denmark, 5Department of Radiology, Universite de Lausanne, Lausanne, Switzerland, 6Department of Radiology, Geneva University Hospital and Faculty of Medicine, Geneva, Switzerland, 7General Electric Healthcare, Buckinghamshire HP8 4SP, United Kingdom
Synopsis
Real-time glucose metabolism was observed in healthy mice brain following infusion of hyperpolarized [U-2H, U-13C]glucose and [U-2H, 3,4-13C]glucose. The evolution of lactate formation was readily observed. In addition, two glycolysis metabolites, namely 3-phosphoglycerate and pyruvate, were identified. Abnormalities in cerebral glucose metabolism is associated with large number of diseases so implementation of this method may prove useful in imaging brain metabolism in various animal models.
Introduction
Methods
[U-2H,
U-13C]glucose and [U-2H, 3,4-13C]glucose
samples were dynamically polarized at 7 T polarizer (196 GHz / 1.00±0.05 K) using
trityl radical as polarizing agent and were dissolved with superheated D2O.
All MR measurements were performed on a 9.4T/31cm actively shielded animal
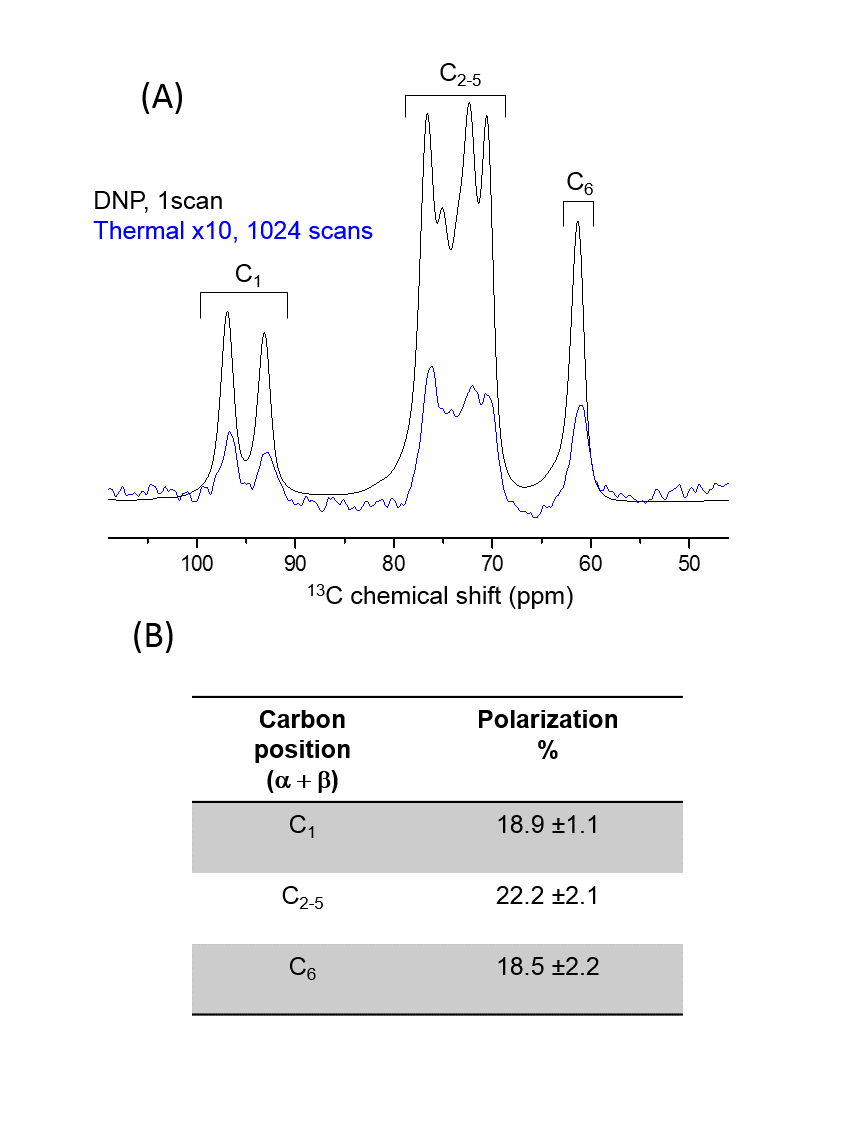
scanner (Varian/Magnex). The liquid polarization of hyperpolarized [U-2H, U-13C]glucose was measured
inside an injection pump placed at the bore of the MR scanner, by comparing the
hyperpolarized signal to its thermal counterpart (Figure 1). In vivo measurements were performed on C57BL/6J
female mice. Animals were anesthetized using 1.5% isoflurane, a catheter was
placed at their femoral vein and connected to a separator/infusion pump for
automatic infusion of hyperpolarized solutions14. Field
inhomogeneity was corrected using the FASTMAP protocol. In vivo data was
collected using a home-built quadrature-1H single loop 13C
surface coil. Acquisition was triggered
5.5s after bolus injection of hyperpolarized [U-2H, U-13C]glucose
solution (n = 4) and hyperpolarized [U-2H, 3,4-13C]glucose (n = 2) using frequency selective RF pulses of 20°
flip angle in the carboxyl area and 1.4° flip angle in the glucose resonances
every 500 ms. Glucose levels were quantified from blood collected from the tail
vein before and just after i.v. infusion. Animal physiology was measured during
the entire length of the experiments. Lactate-to-pyruvate ratio was calculated
from the area under the curve in the summed spectra. Results
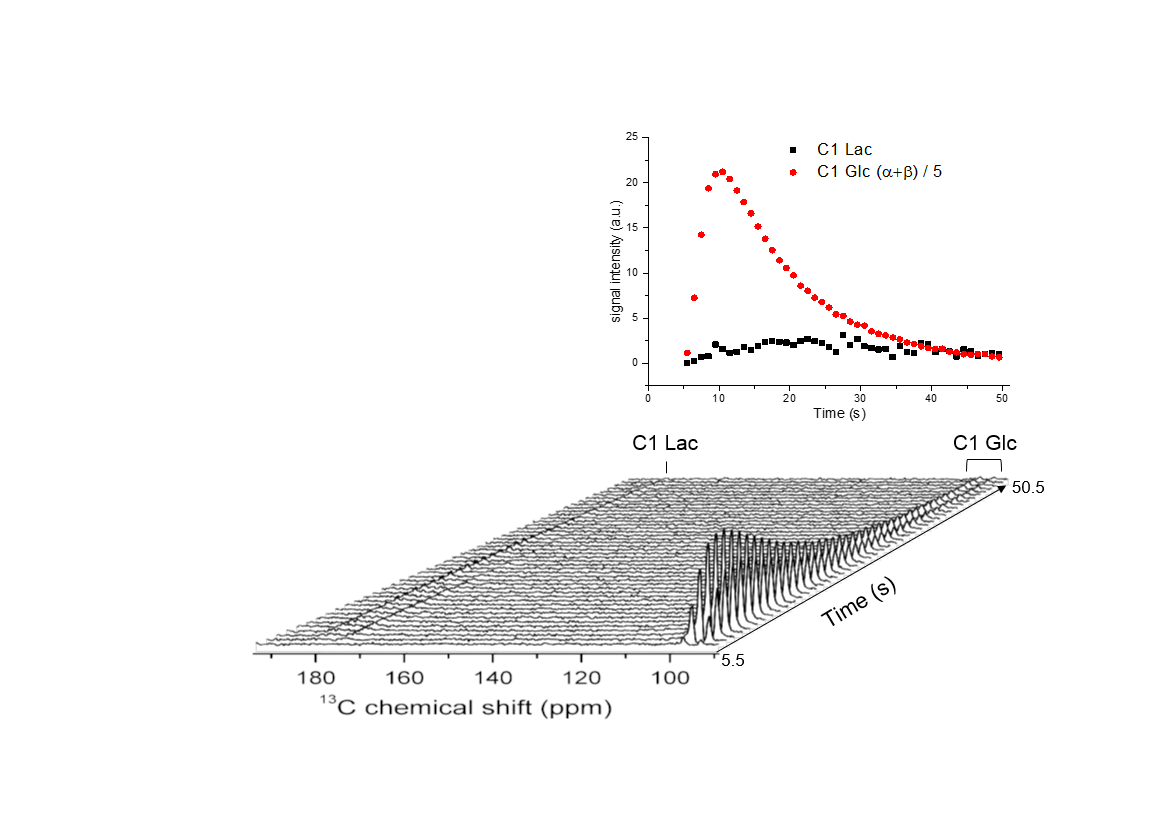
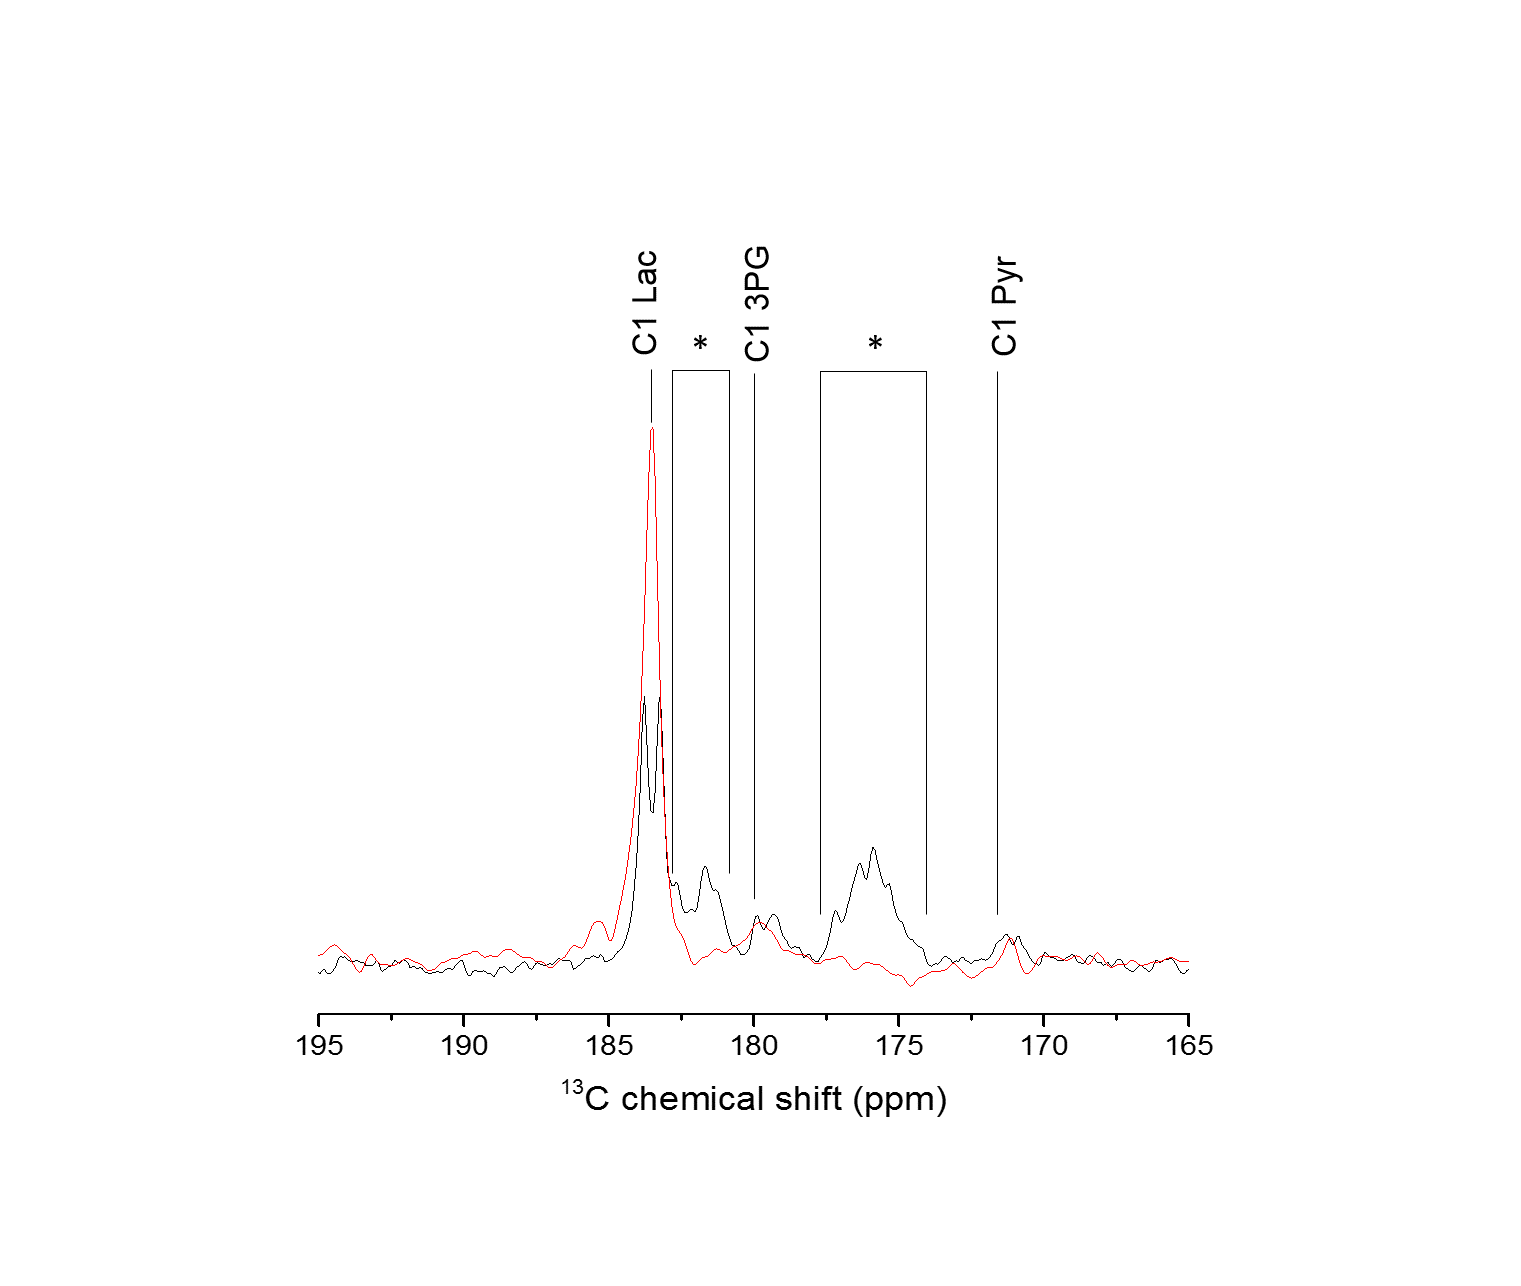
An average 13C glucose polarization of about 20% was measured in the liquid state at the time of injection (Figure 1). A typical time course of 13C spectra detected in the mice brain following hyperpolarized [U-2H, U-13C]glucose infusion is presented in Figure 2 (lower panel). The formation of [1-13C]lactate was readily detected at 183.5 ppm with good SNR for quantification (Figure 2 upper panel). Upon infusing of [U-2H, 3,4-13C]glucose, the lactate doublet is reduced to a single peak (Figure 3). Two additional metabolites could be identified in the summed spectra (Figure 3). The resonance at 171.1 ppm corresponds to the C1 of pyruvate with lactate-to-pyruvate ratio of 17.6 ± 2 (n = 5). The peak at 179.8 ppm was assigned to C1 of 3-phosphoglycerate (3PG). The blood glucose concentration did not exceed the typical values as in glucose tolerance test (GTT) with a peak at 16.8±2.8 mM post injection.Discussion
We demonstrate the feasibility of using hyperpolarized 13C-glucose to measure in vivo cerebral metabolism in healthy mice using a dose of glucose similar to that used in a GTT. Replacing [U-2H, U-13C]glucose with [U-2H, 3,4-13C]glucose improves the sensitivity of the measurement due to lack of 13C-13C coupling. The glycolytic intermediate 3PG and glycolytic end product pyruvate were identified in vivo even though those metabolites cannot be detected using thermally polarized 13C MRS due to their low concentration. The observed lactate-to-pyruvate ratio is in agreement with its expected value15,16. Lactate signal was identified 10.5 s after glucose infusion, and the time course of lactate formation could be quantified. This dynamic data could provide a tool study the kinetics of cerebral glycolysis with sub-second time resolution, and is complementary to information obtained by thermally polarized 13C MRS where lactate can be identified only after 20 min post infusion even when using the an optimized setup4. Abnormalities in cerebral glucose metabolism are associated with large number of diseases so this method may prove useful for imaging brain metabolism in various animal models.Conclusion
13C glucose can be polarized to high levels that enable its application to study real-time cerebral metabolism in healthy mice.Acknowledgements
This work was supported by the Swiss National Science Foundation (grant PP00P2_133562 to A.C), the Centre d’Imagerie BioMédicale (CIBM) of the UNIL, UNIGE, HUG, CHUV, EPFL, the Leenards and Jeantet Foundations, and the National Institutes of Health (P41-EB015908 and R37-HL034557 to ADS).References
1. Mergenthaler, P., Lindauer, U., Dienel, G. A. & Meisel, A. Sugar for the brain: the role of glucose in physiological and pathological brain function. Trends in neurosciences 36, 587-597, doi:10.1016/j.tins.2013.07.001 (2013).
2. de Graaf, R. A., Mason, G. F., Patel, A. B., Behar, K. L. & Rothman, D. L. In vivo 1H-[13C]-NMR spectroscopy of cerebral metabolism. NMR Biomed 16, 339-357, doi:10.1002/nbm.847 (2003).
3. Gruetter, R. et al. Localized in vivo 13C NMR spectroscopy of the brain. NMR Biomed 16, 313-338, doi:10.1002/nbm.841 (2003).
4. Duarte, J. M., Lanz, B. & Gruetter, R. Compartmentalized Cerebral Metabolism of [1,6-(13)C]Glucose Determined by in vivo (13)C NMR Spectroscopy at 14.1 T. Frontiers in neuroenergetics 3, 3, doi:10.3389/fnene.2011.00003 (2011).
5. Ardenkjaer-Larsen, J. H. et al. Increase in signal-to-noise ratio of > 10,000 times in liquid-state NMR. Proceedings of the National Academy of Sciences of the United States of America 100, 10158-10163 (2003).
6. Comment, A. & Merritt, M. E. Hyperpolarized magnetic resonance as a sensitive detector of metabolic function. Biochemistry 53, 7333-7357, doi:10.1021/bi501225t (2014).
7. Meier, S., Karlsson, M., Jensen, P. R., Lerche, M. H. & Duus, J. O. Metabolic pathway visualization in living yeast by DNP-NMR. Molecular bioSystems 7, 2834-2836, doi:10.1039/c1mb05202k (2011).
8. Meier, S., Jensen, P. R. & Duus, J. O. Real-time detection of central carbon metabolism in living Escherichia coli and its response to perturbations. FEBS letters 585, 3133-3138, doi:10.1016/j.febslet.2011.08.049 (2011).
9. Harris, T., Degani, H. & Frydman, L. Hyperpolarized 13C NMR studies of glucose metabolism in living breast cancer cell cultures. NMR Biomed 26, 1831-1843, doi:10.1002/nbm.3024 (2013).
10. Christensen, C. E., Karlsson, M., Winther, J. R., Jensen, P. R. & Lerche, M. H. Non-invasive in-cell determination of free cytosolic [NAD+]/[NADH] ratios using hyperpolarized glucose show large variations in metabolic phenotypes. The Journal of biological chemistry 289, 2344-2352, doi:10.1074/jbc.M113.498626 (2014).
11. Timm, K. N. et al. Hyperpolarized [U-(2) H, U-(13) C]Glucose reports on glycolytic and pentose phosphate pathway activity in EL4 tumors and glycolytic activity in yeast cells. Magn Reson Med 74, 1543-1547, doi:10.1002/mrm.25561 (2015).
12. Allouche-Arnon, H. et al. In vivo magnetic resonance imaging of glucose - initial experience. Contrast media & molecular imaging 8, 72-82, doi:10.1002/cmmi.1497 (2013).
13. Rodrigues, T. B. et al. Magnetic resonance imaging of tumor glycolysis using hyperpolarized 13C-labeled glucose. Nat Med 20, 93-97, doi:10.1038/nm.3416 http://www.nature.com/nm/journal/v20/n1/abs/nm.3416.html#supplementary-information (2014).
14. Cheng, T. et al. Automated transfer and injection of hyperpolarized molecules with polarization measurement prior to in vivo NMR. NMR Biomed 26, 1582-1588, doi:10.1002/nbm.2993 (2013).
15. Ponten, U., Ratcheson, R. A. & Siesjo, B. K. Metabolic changes in the brains of mice frozen in liquid nitrogen. Journal of neurochemistry 21, 1211-1216 (1973).
16. DeVivo, D. C., Leckie, M. P., Ferrendelli, J. S. & McDougal, D. B., Jr. Chronic ketosis and cerebral metabolism. Annals of neurology 3, 331-337, doi:10.1002/ana.410030410 (1978).
Figures