3708
Combined Hyperpolarized Pyruvate and Lactate as a Proxy for Hyperpolarized Urea to Measure Tissue Perfusion1Department of Imaging Physics, UT MD Anderson Cancer Center, Houston, TX, United States, 2Department of Experimental Therapeutics, UT MD Anderson Cancer Center, Houston, TX, United States, 3Department of Diagnostic Radiology, UT MD Anderson Cancer Center, Houston, TX, United States
Synopsis
Hyperpolarized pyruvate can be used to noninvasively probe metabolism in vivo. However, quantitative measurement of metabolic processes is frequently complicated by tissue perfusion. Metabolic inert compounds such as hyperpolarized urea have been used to measure tissue perfusion. This work shows a strong correlation between hyperpolarized urea signal and the sum of hyperpolarized pyruvate and lactate signal, suggesting that the combination of pyruvate and lactate signals can be used to estimate tissue perfusion.
Introduction
One of the major strengths of MR of hyperpolarized pyruvate is the ability to detect dynamic metabolic and physiologic processes in vivo1. Because hyperpolarized pyruvate is prepared exogenously, it is delivered to target biology by intravenous injection. Delivery via perfusion can significantly alter pyruvate signal evolution as well as quantitative measures of pyruvate to lactate conversion2. Hyperpolarized urea has been used to measure perfusion and can be polarized simultaneously with pyruvate for co-injection3. This work shows that the combination of hyperpolarized lactate and pyruvate signals strongly correlates with urea signal both in numerical models and in a mouse model of glioblastoma. A strong correlation suggests that the combination of hyperpolarized lactate and pyruvate signal could be used to measure perfusion parameters and potentially improve the accuracy of metabolism quantification by hyperpolarized pyruvate.Methods
A two spatial, two chemical pool model, as described previously2, was assumed for hyperpolarized pyruvate and lactate:
$$\begin{bmatrix}M'_{P,i} \\M'_{L,i}\end{bmatrix}=\begin{bmatrix}M'_{P,(i-1)} \\M'_{L,(i-1)}\end{bmatrix}e^{A*(t_{i-1}-t)}+k_{ve}/v_e \int_{t_{i-1}}^{t_i}e^{A*(t_{i-1}-\tau)}\begin{bmatrix}b_{P}(\tau) \\b_{L}(\tau)\end{bmatrix} d\tau$$
$$A = \begin{bmatrix}-1/T_{1,P}-k_{pl}-k_{ve}/v_e,k_{lp}\\k_{pl},-1/T_{1,L}-k_{lp}-k_{ve}/v_e\end{bmatrix}$$
$$\begin{bmatrix}S_{P,i}\\S_{L,i}\end{bmatrix}=\begin{bmatrix}sin(\theta)\\sin(\theta)\end{bmatrix}*(v_e\begin{bmatrix}M'_{P,i}\\M'_{L,i}\end{bmatrix}+(1-v_e)\begin{bmatrix}b_P(i*TR)\\b_L(i*TR)\end{bmatrix})$$
$$\begin{bmatrix}M_{P,i}\\M_{L,i}\end{bmatrix}=\begin{bmatrix}cos(\theta)\\cos(\theta)\end{bmatrix}*\begin{bmatrix}M'_{P,i}\\M'_{L,i}\end{bmatrix}$$
where M'P,i is the magnetization for pyruvate before the excitation, kve is the rate of exchange between the vascular and extravascular compartments, ve is the volume fraction of the extravascular space, bP(t) is the vascular input function for pyruvate, kpl is the pyruvate to lactate exchange rate, T1,P is the spin lattice relaxation time for pyruvate, SP,i is the detected pyruvate signal, TR is the repetition time, and θ is the excitation angle, with similar terms for lactate. Additionally, a two compartment, one chemical pool was assumed for urea that is similar to equation (1). Using equation (1) synthetic dynamic spectroscopy curves were generated for pyruvate, lactate, and urea with a range of kpl, and, kve values assuming identical T1 and, kve for all metabolites, klp = 0, and sequence parameters θ=20o and TR=2 sec. Point wise comparisons of the pyruvate and urea signal as well as the combined pyruvate and lactate signals were performed and the coefficient of determination (R2) was calculated.
To test the correlation between hyperpolarized urea and other hyperpolarized agents in vivo, twenty-two mice bearing orthotopic glioblastomas were scanned on a 7-T/30-cm Biospec System (Bruker Biospin Corp., Billerica, MA) using B-GA12SHP gradient, a dual-tuned 1H/13C volume coil (70-mm ID, Bruker Biospin MRI) and 20 mm 13C surface coil (RAPID Biomedical Rimpar, Germany). Spectral data was processed by FWHM integration yielding metabolite signal curves that were normalized to maximal pyruvate signal for lactate and pyruvate or maximal urea signal for urea. Pyruvate, lactate and pyruvate + lactate signal was correlated with urea signal and values were calculated.
Results
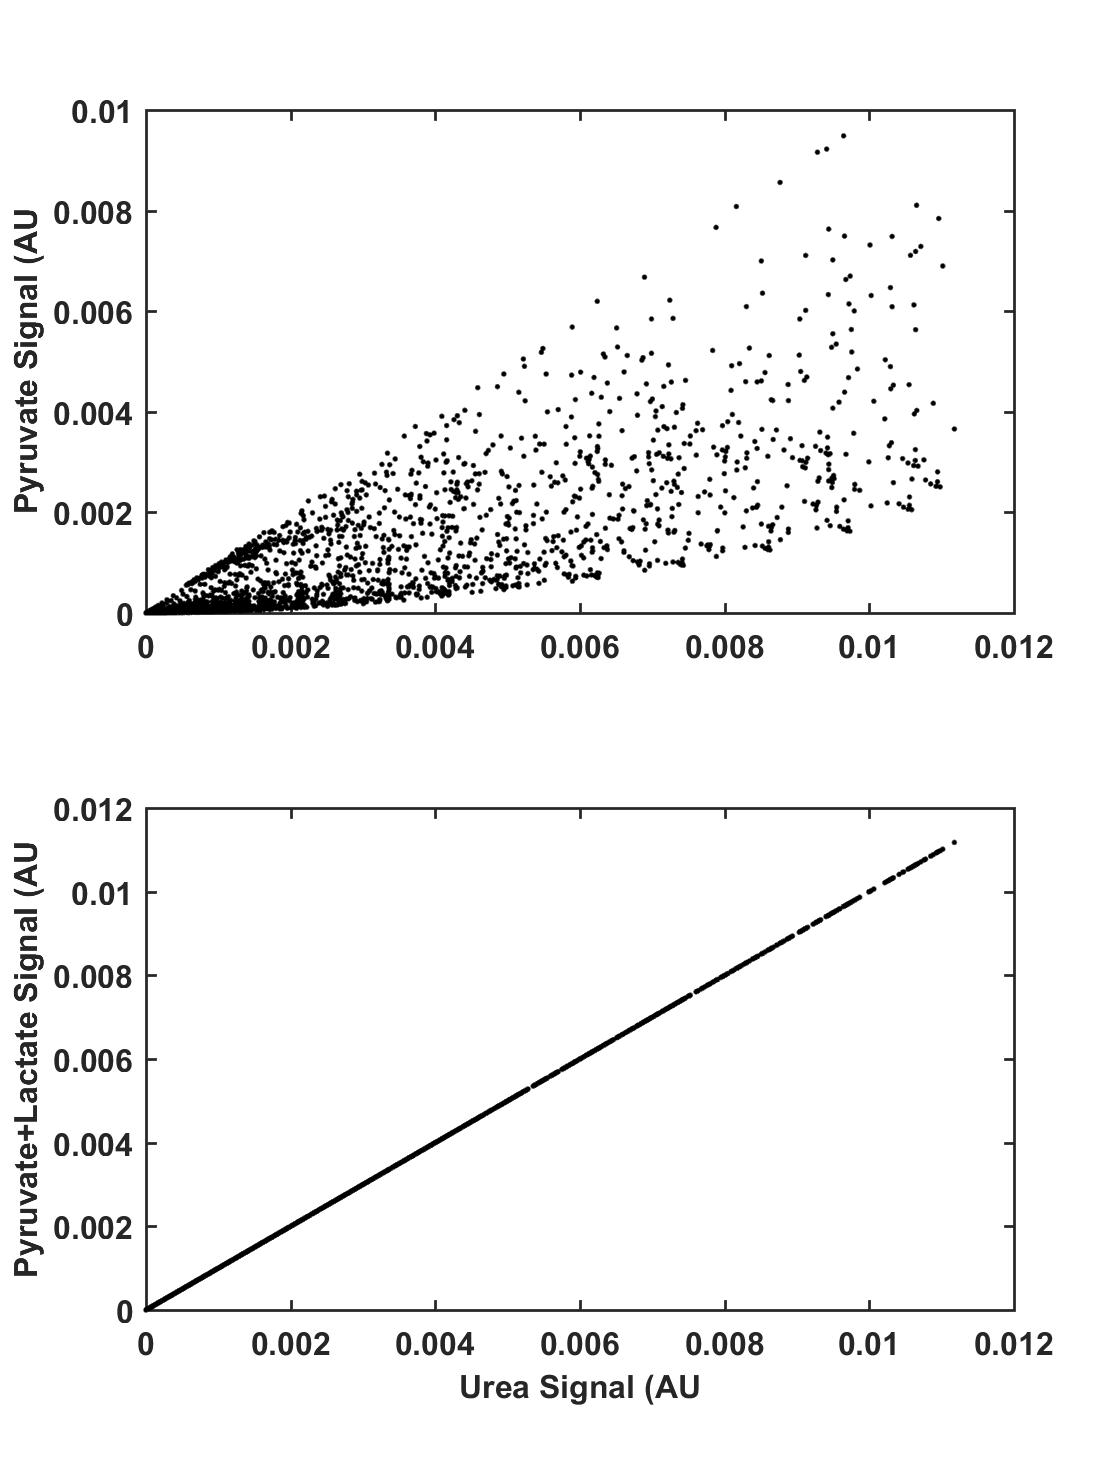
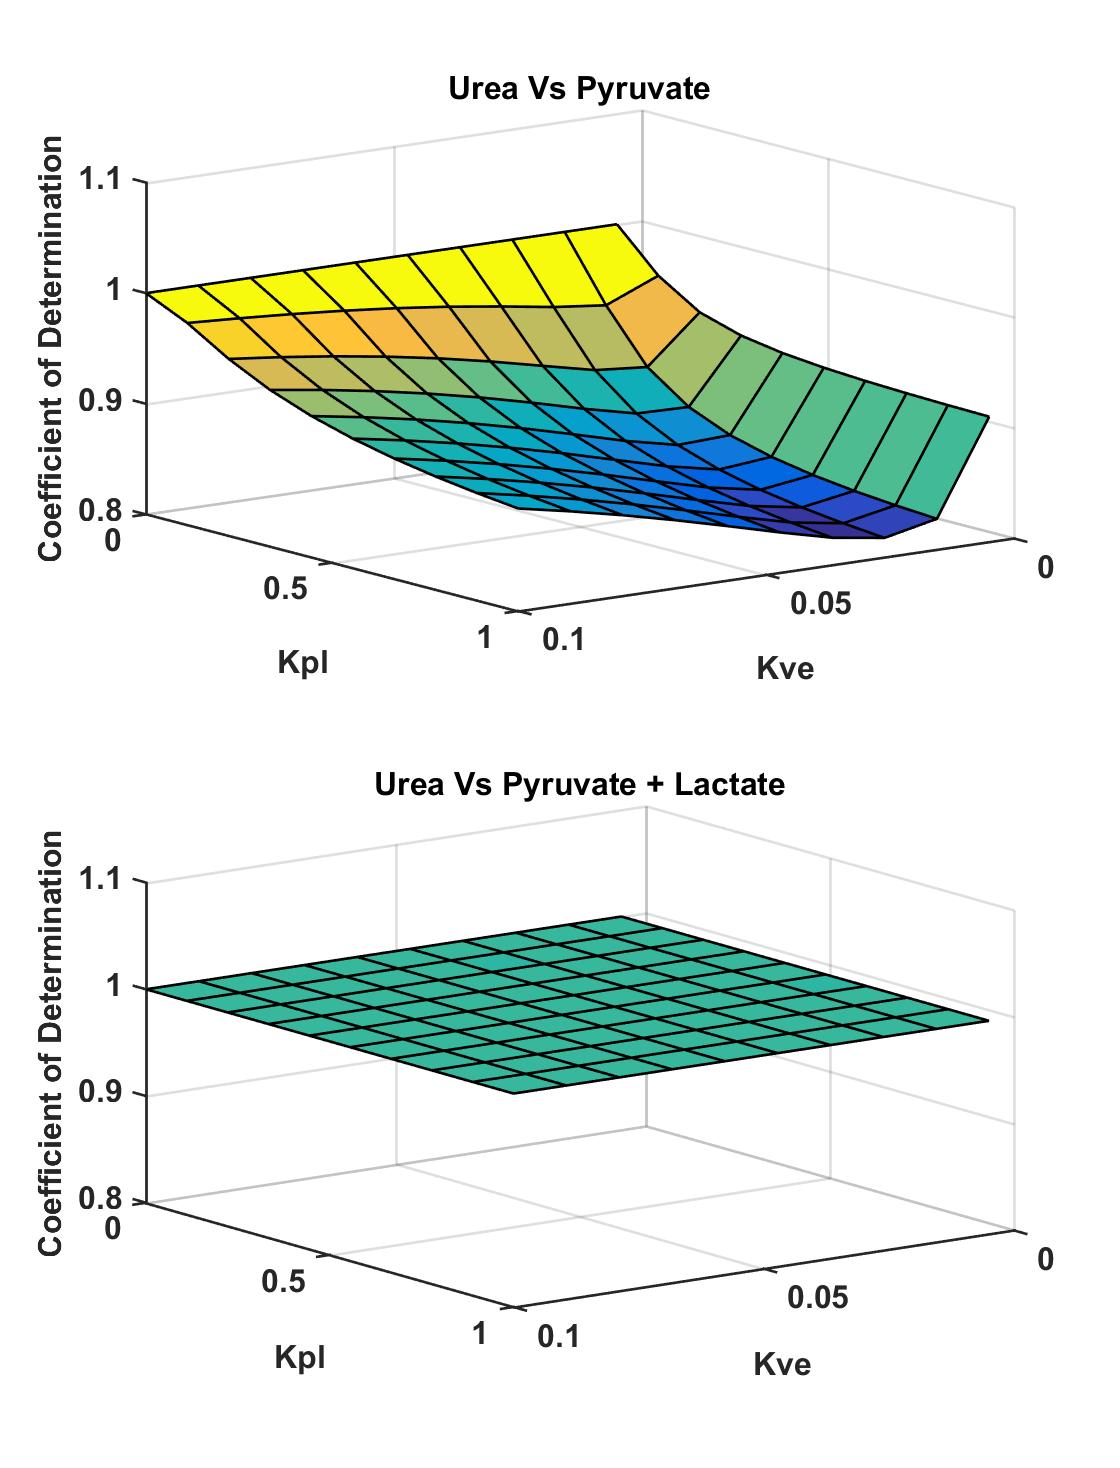
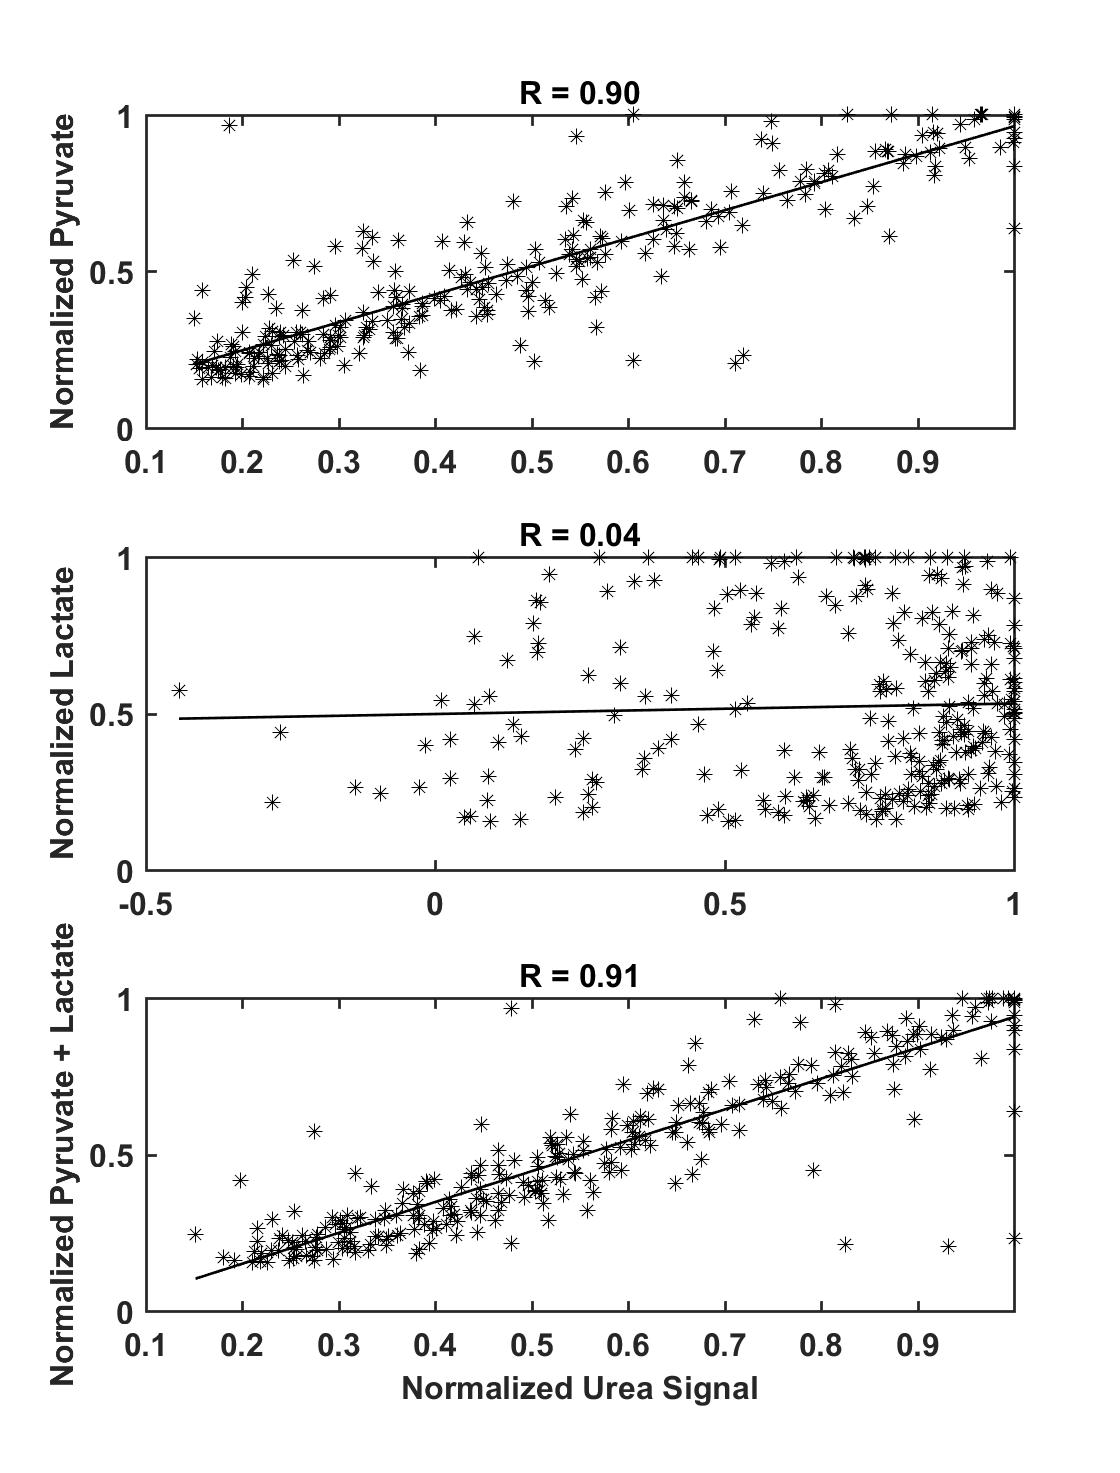
Using synthetic data, hyperpolarized pyruvate shows a rough correlation with hyperpolarized urea; however, as pyruvate is converted into lactate, the pyruvate signal begins to diverge from the urea signal as seen in Figure 1. Additionally, by combining pyruvate and lactate signals an exact correlation is observed between pyruvate + lactate and urea signal as shown in Figure 1. The exact correlation between pyruvate + lactate and urea holds for a range of and values as seen in Figure 2. Correlations between pyruvate and urea deteriorate as kve and k pl are increased and an exact correlation between pyruvate and urea is only observed when kpl=0. As seen in Figure 3, strong correlation (R2 = 0.90) between pyruvate and urea at all times is observed in the in vivo studies and a slightly improved correlation (R2 = 0.91) is detected for the sum of pyruvate and lactate signals and urea. As expected, there was no correlation (R2 = 0.04) detected between lactate and urea.Discussion & Conclusion
This work shows that in both a synthetic (simulation) model system and in a preclinical model of cancer, hyperpolarized urea signal is strongly correlated to hyperpolarized pyruvate signal. The correlation with urea is improved by combining hyperpolarized pyruvate and lactate signals. While this initial work focused on finding correlations between urea and other metabolites, future work is needed to show that such correlations can indeed be leveraged to fit perfusion parameters in a way that improves quantitative accuracy of measurements. The strong correlation between summed pyruvate lactate signals and urea, predicted to hold across a range of tissue conditions, suggest that the combined pyruvate and lactate signal could be used for tissue perfusion measurements.Acknowledgements
This work was supported by the Cancer Prevention & Research Institute of Texas (RP140021-P5), a Julia Jones Matthews Cancer Research Scholar/CPRIT research training award (RP140106, C.M.W.) and the National Institutes of Health (P30-CA016672)References
1 Nelson, S. J. et al. Metabolic imaging of patients with prostate cancer using hyperpolarized [1-(1)(3)C]pyruvate. Sci Transl Med 5, 198ra108, doi:10.1126/scitranslmed.3006070 (2013).
2 Bankson, J. A. et al. Kinetic Modeling and Constrained Reconstruction of Hyperpolarized [1-13C]-Pyruvate Offers Improved Metabolic Imaging of Tumors. Cancer Res 75, 4708-4717, doi:10.1158/0008-5472.CAN-15-0171 (2015).
3 von Morze, C. et al. Investigating tumor perfusion and metabolism using multiple hyperpolarized (13)C compounds: HP001, pyruvate and urea. Magn Reson Imaging 30, 305-311, doi:10.1016/j.mri.2011.09.026 (2012).
Figures