3705
Development of nanometer size silicon nanoparticles for hyperpolarized MRI1Institute for Biomedical Engineering, ETH Zurich, Zurich, Switzerland, 2Physical Chemistry, ETH Zurich, Zurich, Switzerland
Synopsis
Hyperpolarized silicon particles have been shown to exhibit enormously long T1 relaxation at room temperature, making them favourable as novel imaging MR probes. To date, only large particles (average particle size (APS)=2.2 μm) could be efficiently polarized, restricting their in-vivo applicability.
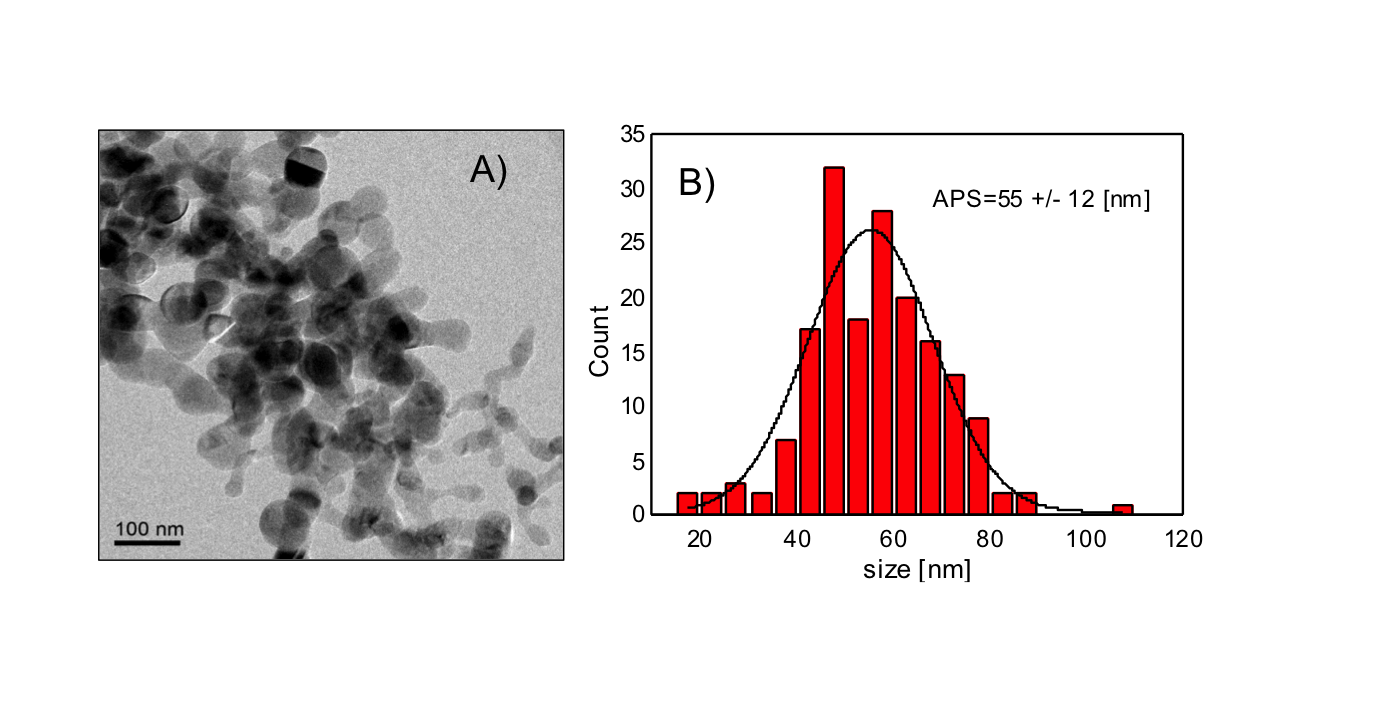
The objective of the present work was to develop nanometre size hyperpolarized silicon-29 particles (APS= 55+/-12 nm) with superior MR properties. A maximum achievable polarization of 12.6% is reported with relaxation time of 42 min at room temperature. Applications of imaging of both solid and colloidal dispersion of silicon particles are demonstrated.
Introduction
The main obstacle of imaging hyperpolarized substrates is
their relatively short lifetime, intrinsically limited by the T1 relaxation.
Currently, most of the substrates used in vivo are based on small organic
molecules (e.g. pyruvic acid) which are selectively labelled with 13C nuclei.
In such a case, the imaging window span lasts around 60–90 s. This time,
although short, allows to study rapid enzymatic reactions, e.g. anaerobic
metabolism which can be further used to characterize pathology of tissue1,2.
The situation is different if slow biological processes
such as protein-cell binding, intragastric movement or tissue perfusion are of
interest. For these purposes, a new class of hyperpolarized contrast agents,
characterized with a long lifetime, needs to be developed. One such potential
candidate is silicon in a form of micro and nanoparticles. Recent experimental
results of micrometer size silicon-29 particles3 showed a lifetime
of the hyperpolarized signal to be on the order of tens of minutes, exceeding
any other 13C based probe reported so far. In addition, its bio-compatibility
and versatile surface chemistry makes it well suited for in vivo use4.
Methods
Silicon nanoparticles: silicon nanopowder was synthesized from a gas phase using a laser assisted technique (US Nano Research, Houston, TX, USA). The end product was characterized with an elemental purity of >99.9% and 29Si natural abundance of 4.7%. Transmission electron microscopy (TEM) imaging was used to obtain size distributions.
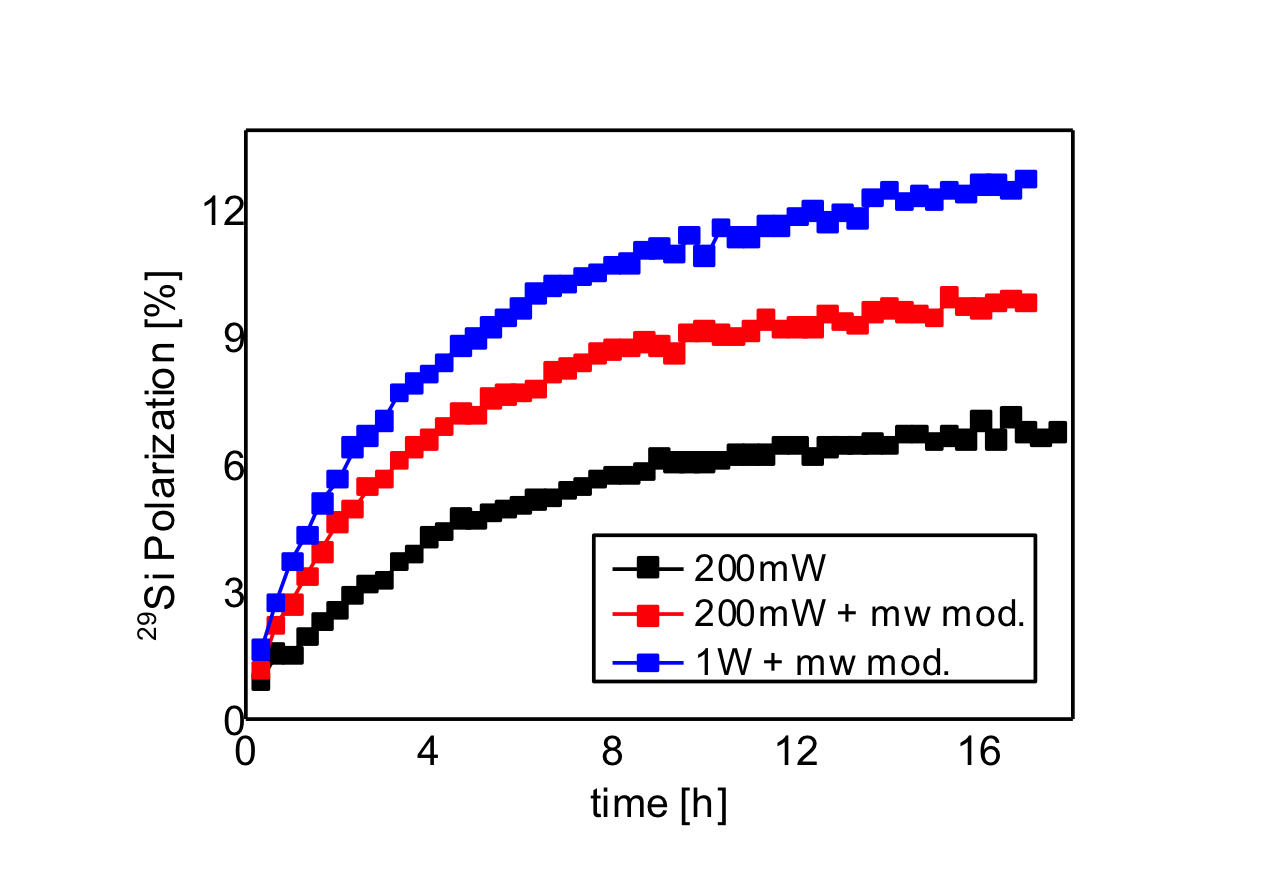
Hyperpolarization of silicon: The nuclear polarization of 29Si nuclei was enhanced by dynamic nuclear polarization employing endogenous defects between the crystalline silicon core and the oxidized shell. A home built polarizer operating at B0=3.4T and temperature of 3.5K was used as described in5. The sample was composed of 100mg tidily packed powder enclosed in a PTFE cup. In order to further enhance the polarization, the microwave field was frequency-modulated using a symmetric ramp function at f=3 kHz with 300MHz bandwidth. An additional boost in microwave power was given by feeding the output of the microwave source (max power=200mW) into a 1W power amplifier (QuinStar, Torrance, USA).
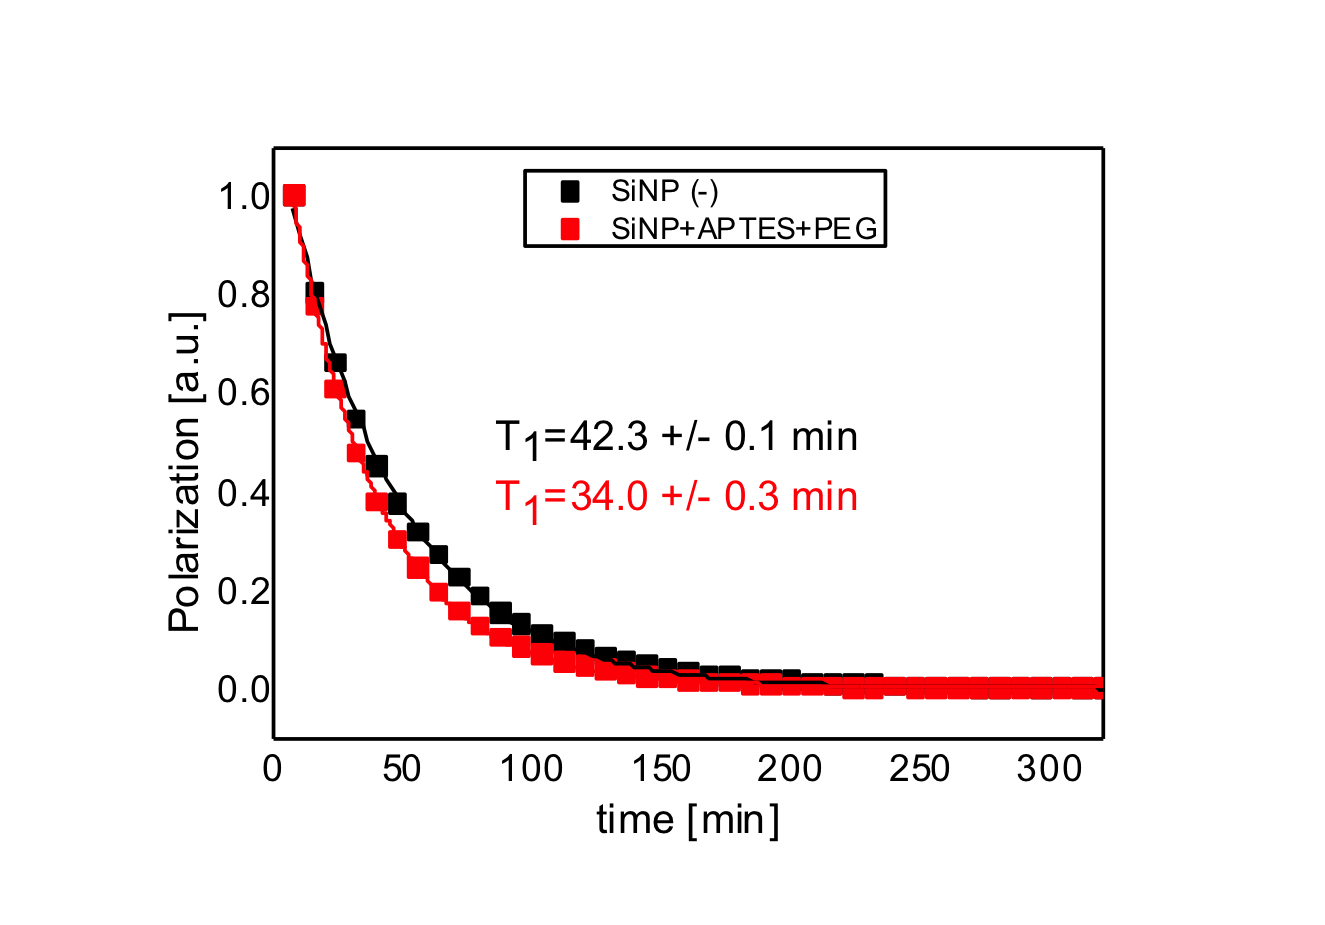
Surface functionalization: In order to improve biodistribution and biocompatibility of the nanoparticles, the surface of silicon nanoparticles was functionalized with NHS-dPEG4-(m-PEG12)3-ester as reported previously6.
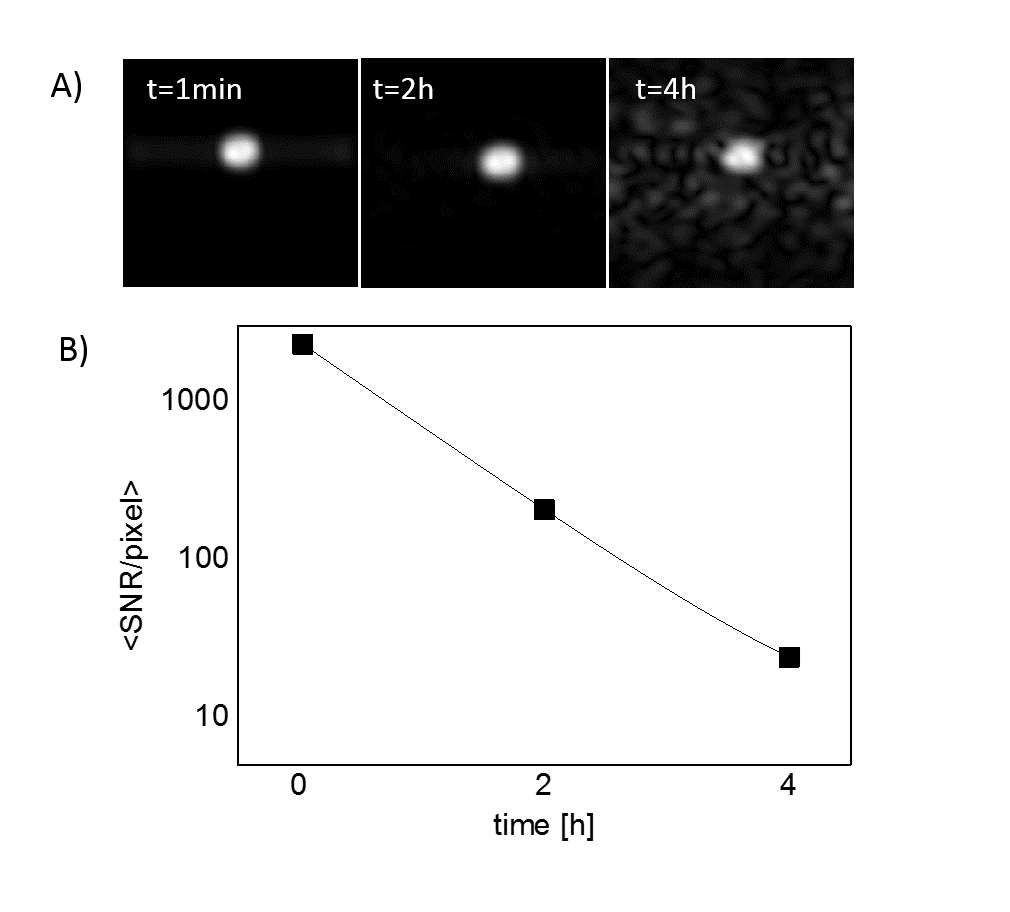
MRI experiments: After 24h of continuous polarization, the samples were taken out of the polarizer and immediately transferred to the face of a horizontal 9.4T imaging system (Bruker BioSpin, Ettlingen, Germany). The sample was placed in a home-built, semi half-saddle surface coil (f=79MHz). Silicon imaging was performed using the Rapid Acquisition with Refocused Echoes (RARE) sequence. The dry samples were imaged with a 32×32 matrix and 55% partial Fourier, while the dispersed sample was imaged with a 64×64 matrix and 71% partial Fourier. Silicon spectroscopy was recorded with a train of low angle (θ=10 deg) pulses over an 8h period. The absolute value of polarization was obtained by comparing the magnitude signal of a polarized sample and a 100 mg of fully labelled (99% of 29Si) phantom.
Results
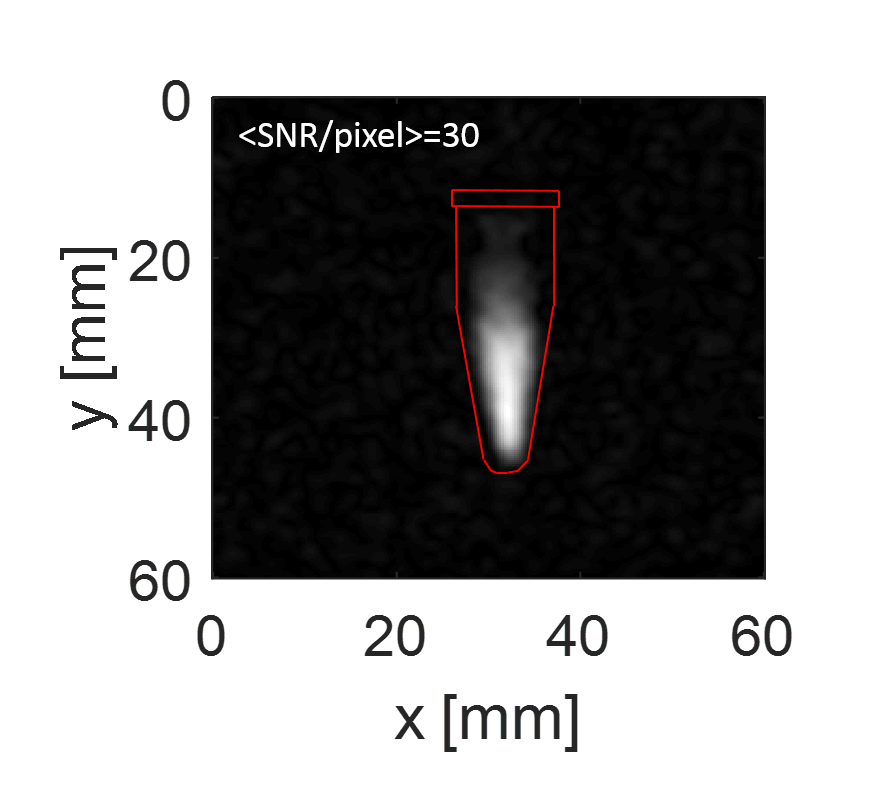
The resulting average particle size was found to be 55+/-12nm (Fig 1.) The characteristic time of polarization build-up was ∼4.5h and did not dependent on the microwave power. At the same time, the maximum achievable polarization for dry material could be substantially enhanced by employing a 1W power amplifier (Fig. 2). The presence of PEG polymer on the surface of the nanoparticles resulted in small shortening of T1 time at room temperature (Fig. 3), whereas no change in the polarization level was observed. High quality images were obtained by taking advantage of the long dephasing time of silicon nuclei under periodic excitation in RARE sequences (Fig. 4–5). The mean SNR/pixel value decayed with time given by T1 relaxation.Discussion
Early reports3,7,8 of hyperpolarized silicon particles demonstrated feasibility for large particles (APS∼2μm, obtained with ball-milling of a silicon ingot) whereas nanometre size material showed relatively poor performance with T1 relaxation on the order of few minutes9. No imaging was possible with the nanometre size particles due to intrinsically low achievable polarization levels8. In contrast, the nanoparticles developed in this study showed superior quality in both relaxation time (42 min for pure particles) and polarization level (12.6%), allowing to obtain high quality images up to 4 hours after transportation to the imaging system. The small size of the newly developed nanoparticles should facilitate greater in vivo mobility. Further development will be focused on designing a specific surface functionalization to produce targeted probes.
Acknowledgements
No acknowledgement found.References
1. Rider, O. J. & Tyler, D. J. Clinical implications of cardiac hyperpolarized magnetic resonance imaging. J. Cardiovasc. Magn. Reson. 15, 93 (2013).
2. Kurhanewicz, J. et al. Analysis of cancer metabolism by imaging hyperpolarized nuclei: prospects for translation to clinical research. Neoplasia 13, 81–97 (2011).
3. Cassidy, M. C., Chan, H. R., Ross, B. D., Bhattacharya, P. K. & Marcus, C. M. In vivo magnetic resonance imaging of hyperpolarized silicon particles. Nat. Nanotechnol. 8, 363–368 (2013).
4. Park, J.-H. et al. Biodegradable luminescent porous silicon nanoparticles for in vivo applications. Nat. Mater. 8, 331–6 (2009).
5. Batel, M. et al. A multi-sample 94 GHz dissolution dynamic-nuclear-polarization system. J. Magn. Reson. 214, 166–174 (2012).
6. Aptekar, J. W. et al. Hyperpolarized Long-T1 Silicon Nanoparticles for Magnetic Resonance Imaging. 1–5 (2009). doi:10.1021/nn900996p
7. Whiting, N. et al. Real-Time MRI-Guided Catheter Tracking Using Hyperpolarized Silicon Particles. Sci. Rep. 5, 12842 (2015).
8. Whiting, N. et al. Developing hyperpolarized silicon particles for advanced biomedical imaging applications. Proc. SPIE 9417, 941702 (2015).
9. Atkins, T. M. et al. Synthesis of Long T 1 Silicon Nanoparticles for Hyperpolarized 29 Si Magnetic Resonance Imaging. ACS Nano 7, 1609–1617 (2013).
Figures