3699
Overdiscrete Reconstruction for Signal Enhancement in Hyperpolarized 13C Spectroscopic Imaging1Technische Universität München, Munich, Germany, 2GE Global Research, Munich, Germany, 3MR Research Centre, Aarhus University, Aarhus, Denmark
Synopsis
The overdiscrete reconstruction, originally proposed for 1H MR Spectroscopic Imaging (MRSI), is adapted and applied to hyperpolarized 13C MRSI. The method is demonstrated for in-vivo hyperpolarized [1-13C]-pyruvate scans of a pig’s kidneys using phase encoded 2D-MRS. Linewidth and spectral separation were improved in addition to a significant signal enhancement for low concentrated downstream metabolites such as lactate, alanine and pyruvate-hydrate.
Purpose
This work presents the adaptation of the overdiscrete reconstruction framework to hyperpolarized [1-13C]-pyruvate experiments to improve spectral separation and Signal-to-Noise Ratio (SNR) of the measured signal.Introduction
Dynamic metabolic imaging using hyperpolarized [1-13C]-pyruvate enables minimally invasive imaging of real-time metabolic processes in-vivo. A main challenge of this technique is to acquire the non-recoverable disappearing hyperpolarized signal while encoding, ideally, three spatial dimensions, one spectral dimension and the temporal dynamics. However, achievable resolutions are generally coarse mainly due to limited SNR and acquisition time constraints. Overdiscrete reconstructions1,2,3 have shown to substantially improve SNR, spectral and spatial quality in the field of 1H MR Spectroscopic Imaging (MRSI) by (1) minimizing voxel bleeding, (2) incorporating prior knowledge from coil sensitivities and (3) correcting for phase effects caused by B0 inhomogeneities. Moreover, this method can be potentially combined with parallel imaging and arbitrary k-space reconstructions.
Methods
The overdiscrete reconstruction method aims to minimize for every voxel $$$\pi$$$ the cost function $$\triangle_{\pi}=\parallel (FE - T)_{\pi}\parallel_{2} + \alpha(F\Psi F^{H}),$$ where $$$F$$$ represents the reconstruction matrix to be found, $$$T$$$ represents a target Spatial Response Function (SRF) to be optimized and $$$E$$$ corresponds to the encoding operator, expressed at $$$\zeta^{2}$$$-fold of the nominal resolution and containing the high-resolution sensitivity profiles and k-space acquisition trajectory, $$$\Psi$$$ represents the noise covariance matrix and $$$\alpha$$$ is the regularization parameter to control the noise optimization. The analytical solution of the problem leads to $$F^{'} = T \theta E^{H} (E\theta E^{H} + \alpha \Psi)^{+},$$ where $$$\theta$$$ corresponds to a spatial weighting factor, and $$$^{+}$$$ denotes the pseudo-inverse. Linear phase effects caused by B0 inhomogeneities are corrected at a high-resolution, prior to the optimization of the SRF, where coherent signal averaging is performed and thus improving SNR at nominal resolution.
Data acquisition: A hyperpolarized [1-13C]-pyruvate phase encoded 2D-MRSI scan of a healthy pig was obtained at a clinical 3T GE-HDx MR scanner (GE Healthcare, Milwaukee, WI, USA) using a 13C Helmholtz loop coil of 20cm diameter (PulseTeq Limited, Surrey, UK) and a SpinLab (GE Healthcare, DK) for pyruvate polarization. A slice through the pig’s kidneys was acquired using an FID-based Chemical Shift Imaging sequence with the following parameters: spectral width=5kHz, TR=75ms, FA=10°, in-plane resolution 9.4mm, slice thickness 10mm and a total scan duration of 19 seconds.
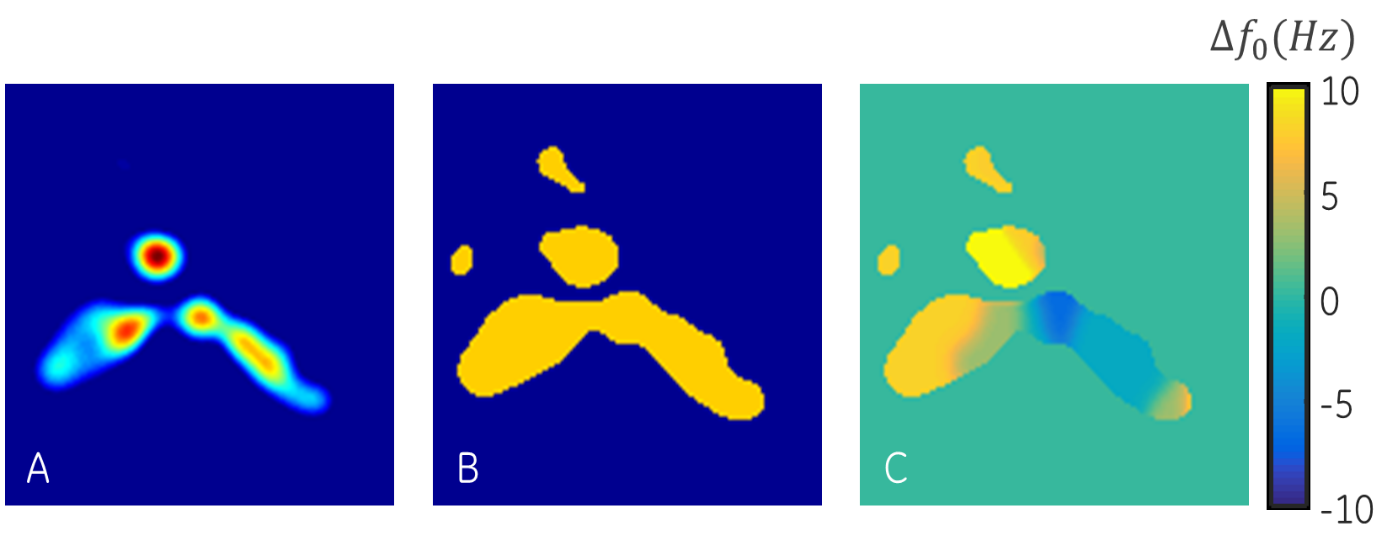
Data Processing: The datasets were zero filled to a resolution of 48x48 and processed using (1) standard CSI Fourier-based reconstruction without spectral apodization and (2) overdiscrete reconstruction using a Gaussian target function with $$$\sigma$$$=2 sub-voxels and reconstruction parameters of and $$$\alpha$$$=1000. A B0-field map together with the spatial weighting were extracted from the data4, using the main pyruvate peak. The SNR was computed as the maximum absolute peak of each metabolite $$$M$$$ divided by the standard deviation of the noise region in real spectrum for all voxels with the following expression $$SNR_{M}(\mathbf{r})=\frac{max(\mid S(\mathbf{r},\omega)\mid)_M}{std(\mathbb{R} [S(\omega)_{noise}])}.$$
Results and Discussion
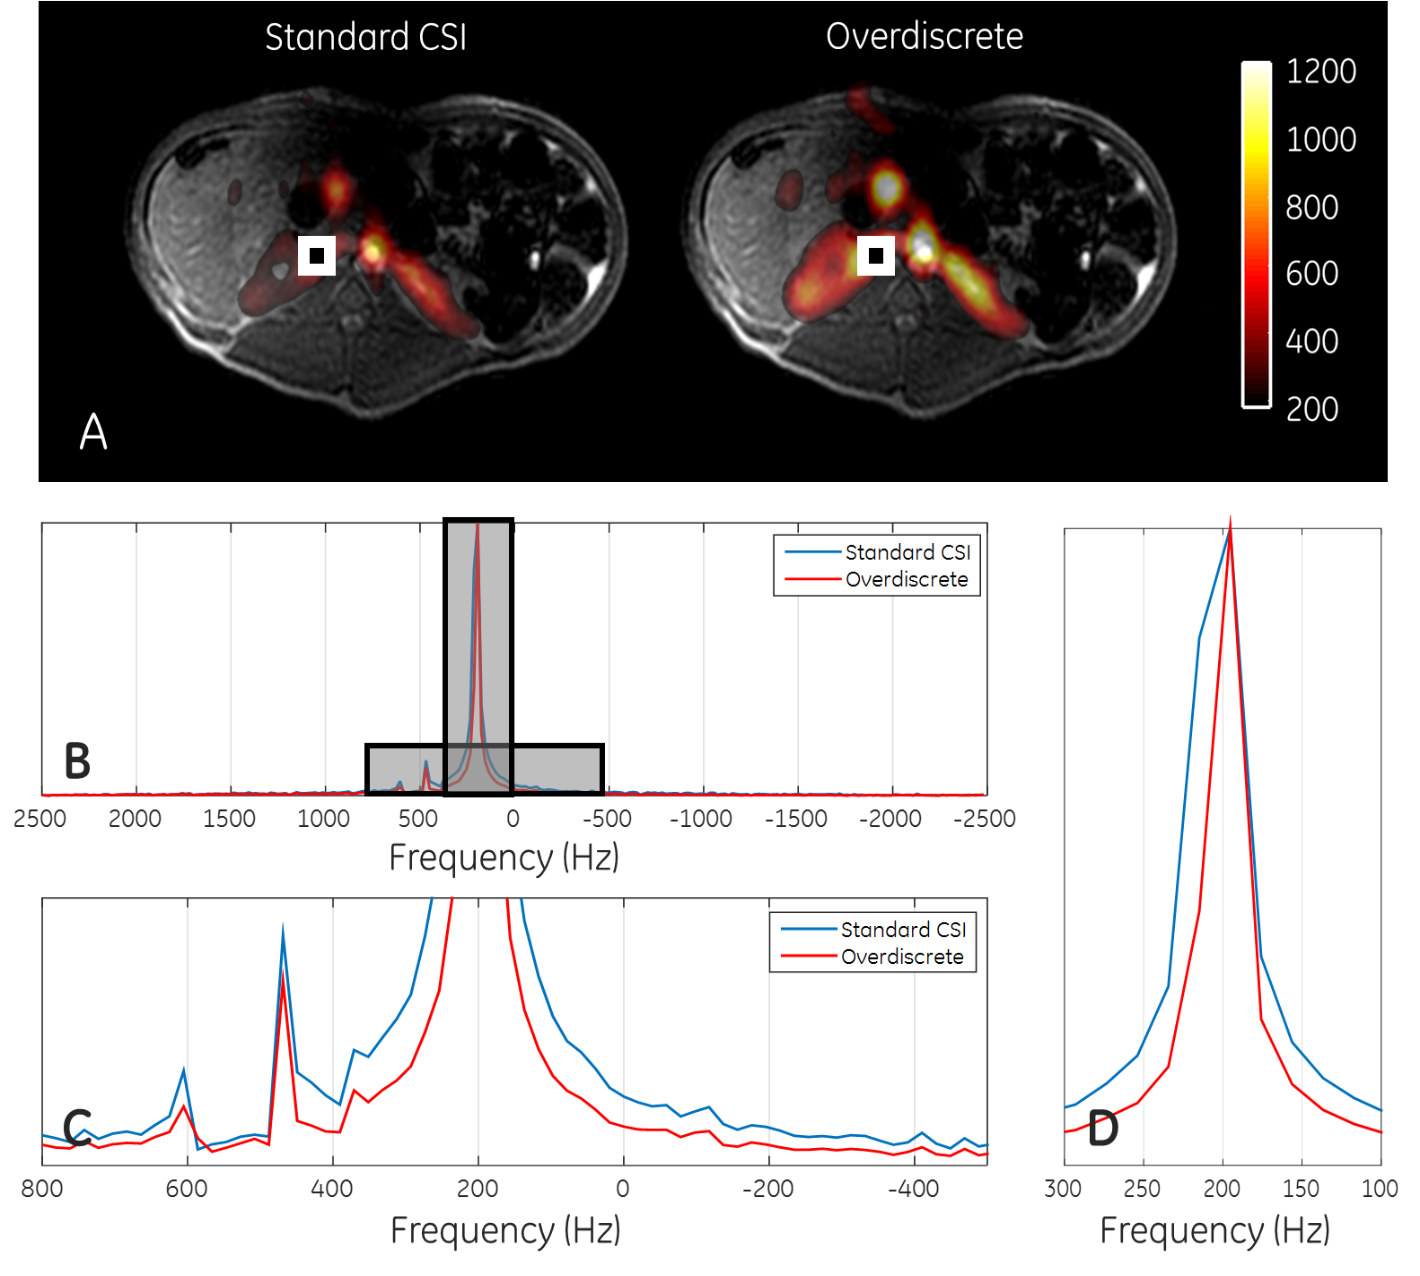
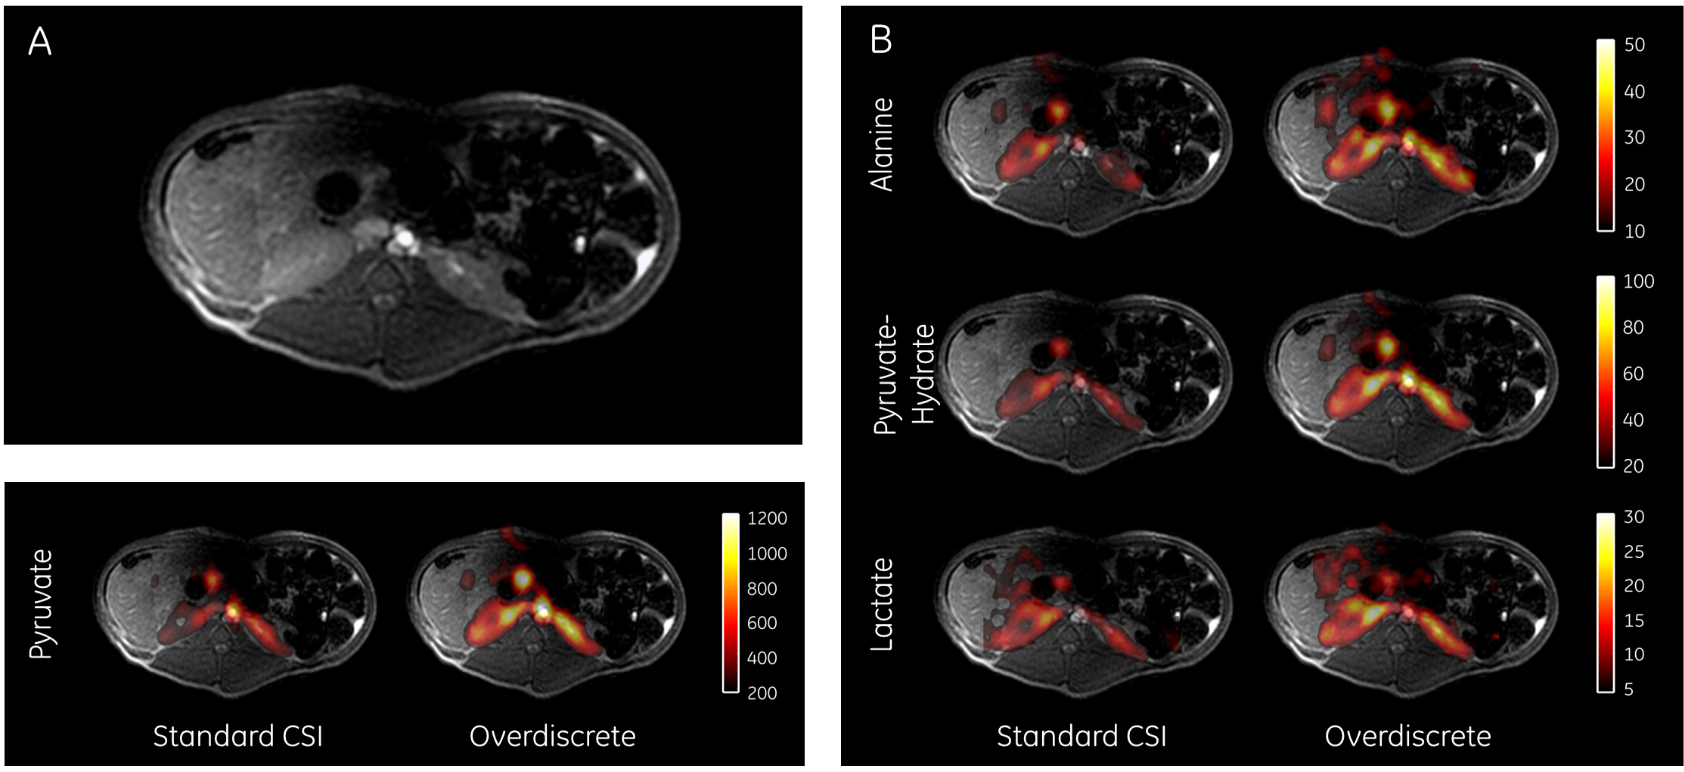
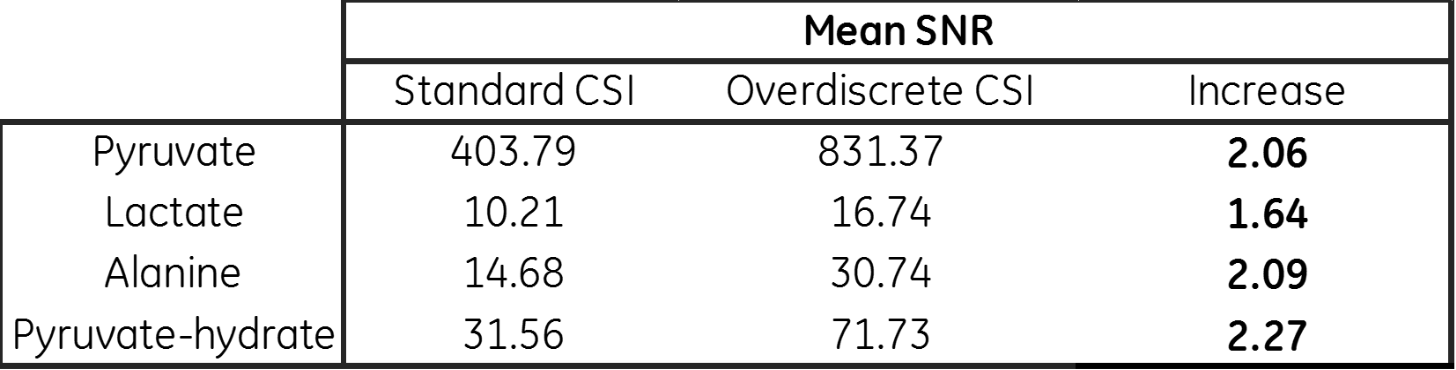
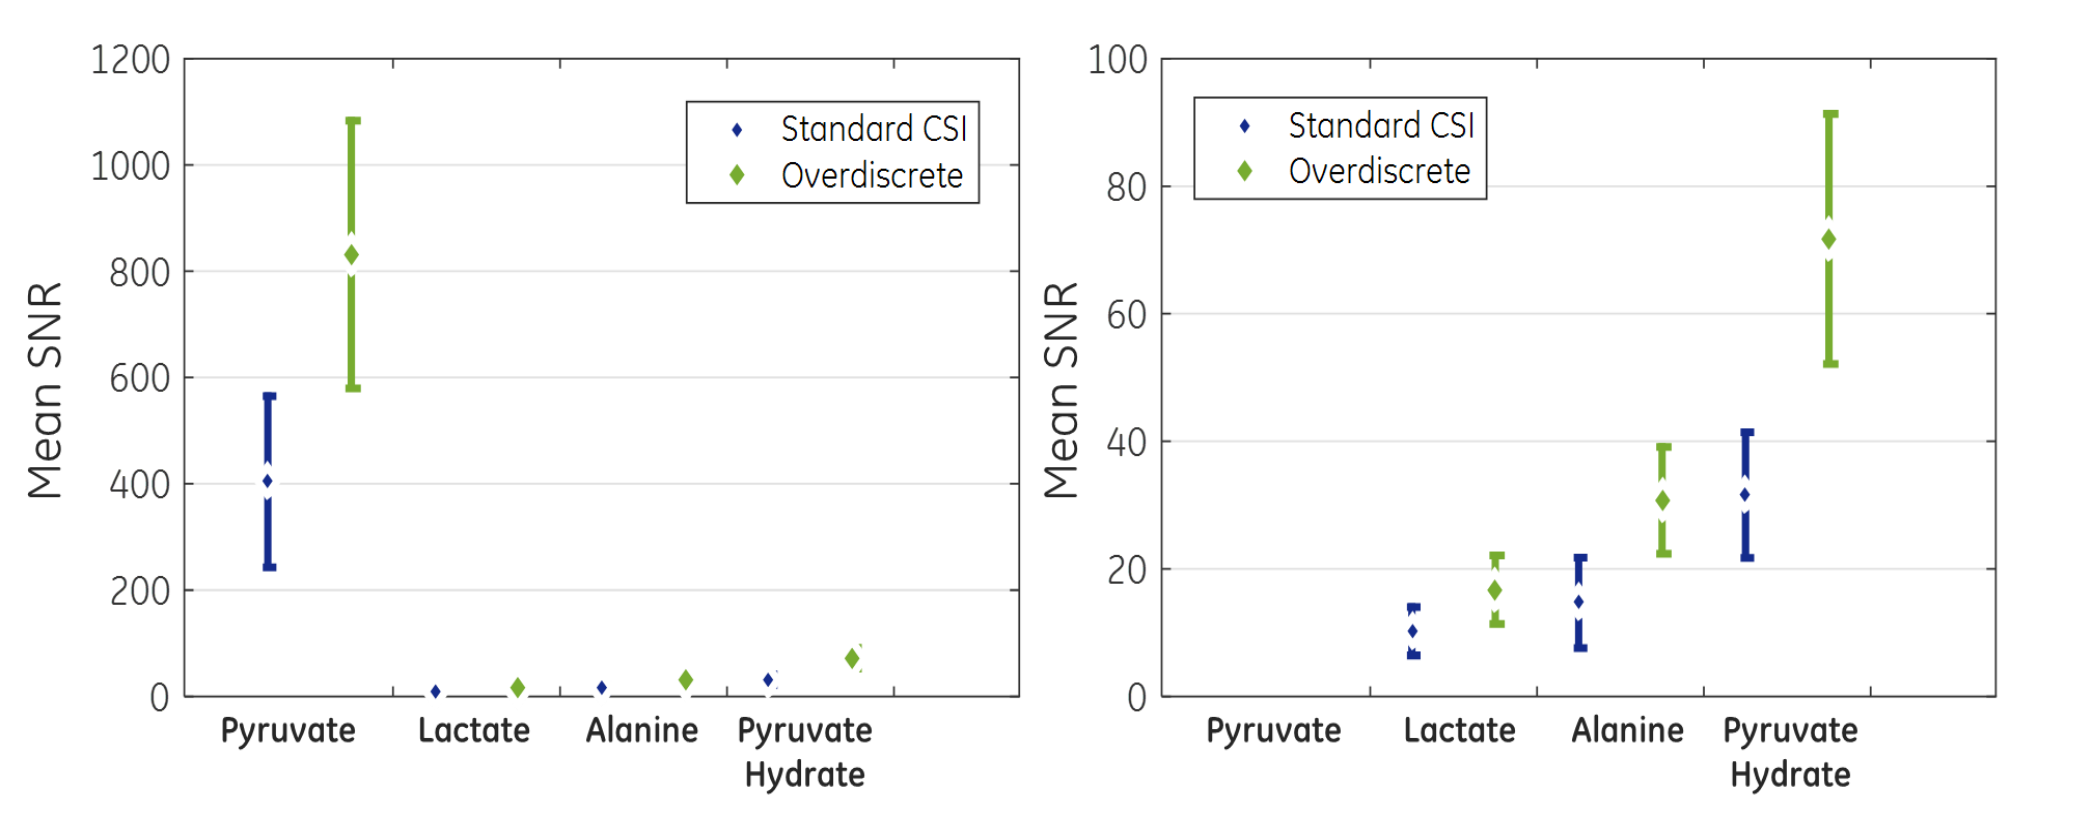
The standard and overdiscrete reconstructed 13C MRSI datasets were compared using SNR analysis of the three main downstream metabolites, namely lactate, alanine and pyruvate-hydrate. Fig.-1 presents the spectral characteristics of both reconstructed signals, where a noticeable improvement in linewidth is shown. Spatial reconstructions for each metabolite are shown in Fig.-2 and quantitative values are shown in Fig.-3 and Fig-4. An increased detected signal in the left kidney was observed and a mean SNR increase factors of 1.6-2.3 were achieved. Additional enhancement factors are to be expected by adding the coil profile prior knowledge to the reconstruction matrix.Conclusion
The feasibility and advantages of the overdiscrete reconstruction method for [1-13C]-Pyruvate MRSI were presented. The method demonstrated that better spectral separation and a mean signal enhancement up to a factor between 1.6-2.27 can be achieved for low concentration downstream metabolites, which improves detection and quantification for dynamic metabolic imaging studies.Acknowledgements
No acknowledgement found.References
[1] Pruessmann K and Tsao J. Magnetic Resonance Imaging Method. US Patent No. 7.342.39.
[2] Kirchner et al. Reduction of voxel bleeding in highly accelerated parallel 1H MRSI by direct control of the spatial response function. Magn Reson Med 2014.
[3] Kirchner et al. Mechanisms of SNR and Line Shape Improvement by B0 Correction in Overdiscrete MRSI Reconstruction. Magn Reson Med 2015.
[4] Coello et al. Overdiscrete Reconstruction in Echo-Planar Spectroscopic Imaging with Auto Calibrated B0 Field Map Estimation. ISMRM 2016 #0386.
Figures