3698
High resolution hyperpolarized 13C MRSI acquired by applying SPICE in mouse kidney1Department of Electrical and Electronic engineering, Yonsei university, Seoul, Korea, Republic of, 2Department of Radiology, Yonsei University College of Medicine, Seoul, Korea, Republic of
Synopsis
Hyperpolarized 13C technique might be a practical challenge to achieve both high spatial and spectral resolution in spectroscopic images due to the amount of required data. Recently, an emerging technique called to SPectroscopic Imaging by exploiting spatiospectral CorrElation (SPICE) has been introduced for high spatiotemporal resolution in 1H magnetic resonance spectroscopic image (MRSI). In this study, by applying this technique to hyperpolarized 13C MRSI, a high resolution spectroscopic image was acquired.
Purpose
High resolution magnetic resonance spectroscopic imaging (MRSI) is a useful technique to acquire quantitative metabolite images. However, due to the time-limited signal in hyperpolarized 13C MR, acceleration technique is required in data acquisition step1,2. Recently, an emerging spectroscopic imaging technique called SPectroscopic Imaging by exploiting spatiospectral CorrElation (SPICE) was introduced, enabling the acquisition of spectroscopic image with high spatial resolution3. In this study, the SPICE technique was applied to hyperpolarized 13C Magnetic Resonance Spectroscopic Imaging (MRSI) and a high spatial resolution spectroscopic image of mouse kidney was acquired in 9.4T.Method
[In vivo experiments]
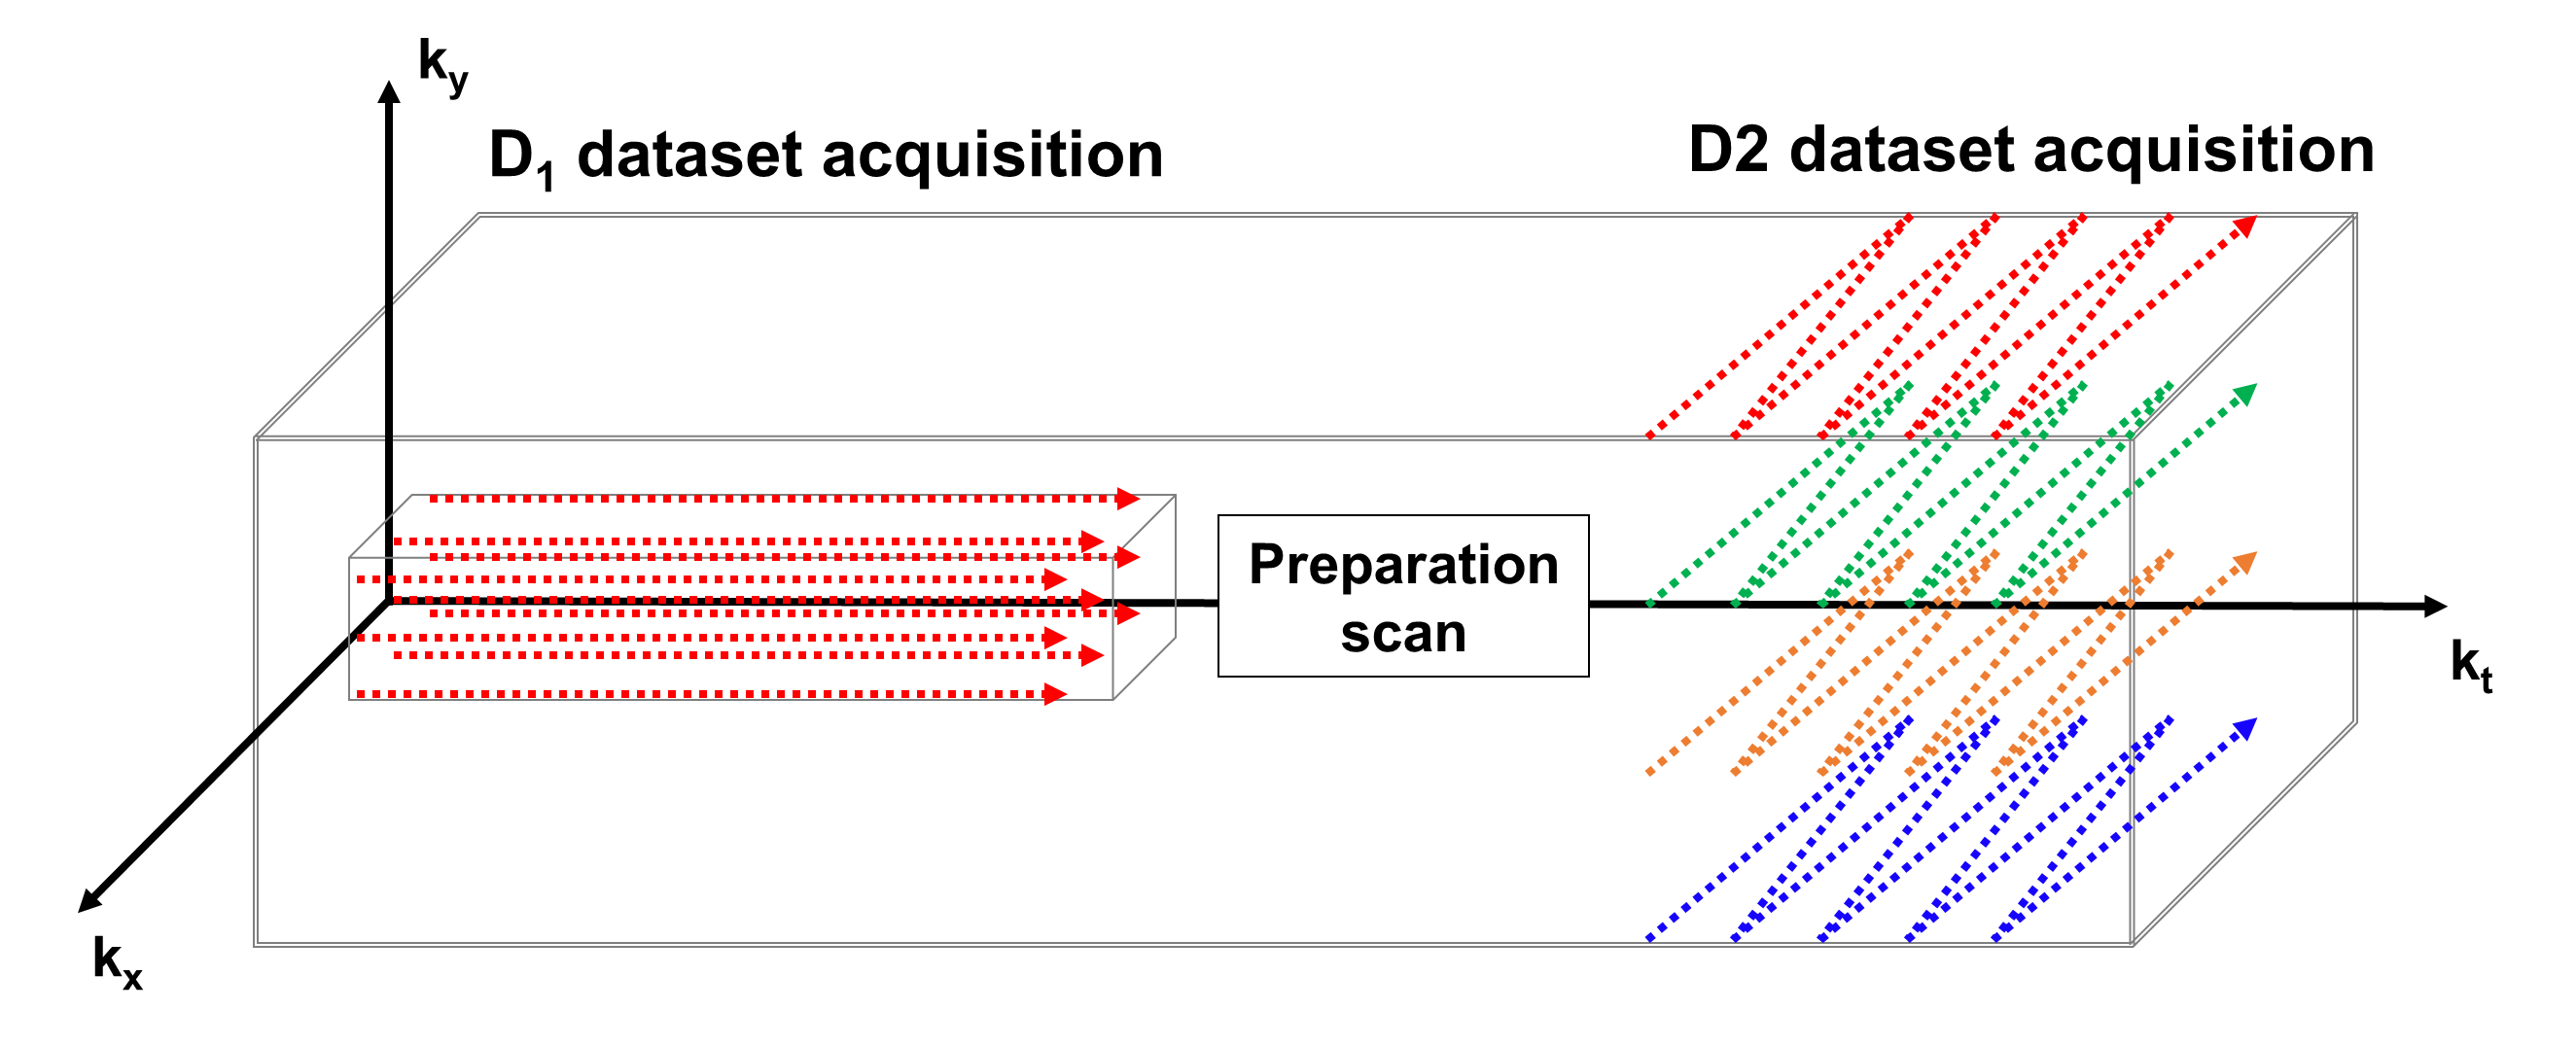
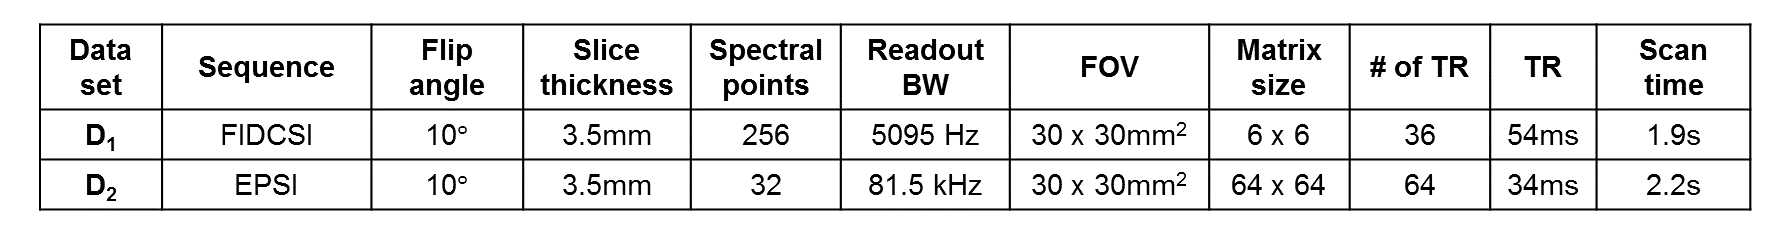
All experiments were performed using 9.4T small animal imaging scanner (Bruker BioSpin MRI GmbH, Germany) equipped with 1H-13C dual-tuned mouse volume Tx/Rx coil. [1-13C] pyruvic acid doped with 15mM Trityl radical and 1.5M Dotarem was polarized for 1 hour using HyperSense DNP polarizer (Oxford Instruments, Oxford, UK). Hyperpolarized sample was dissolved with Tris/EDTA-NaOH solution, and 350ul of pyruvate was injected into Balb/c mouse through tail vein catheter over duration of 5s. 3-mm thickness of axial-oriented slice containing mouse kidney was selected, and the scan was started at 5s after injection of the pyruvate. All procedures of the animal experiments were approved by the local animal care and use committee. For SPICE data acquisition, two datasets were acquired sequentially using centric ordered Free Induction Decay Chemical Shift Imaging (FIDCSI) (called as D1 dataset, sparse sampling in spatial domain) and Echo-Planar Spectroscopic Imaging (EPSI) with bipolar readout gradient (called as D2 dataset, sparse sampling in spectral domain) (Fig.1). There was a 4.25s of time-gap between FIDCSI and EPSI scans due to the preparation scan for EPSI. The imaging parameters are arranged in Table.1. Field map was also acquired for B0 inhomogeneity compensation.
[SPICE reconstruction]
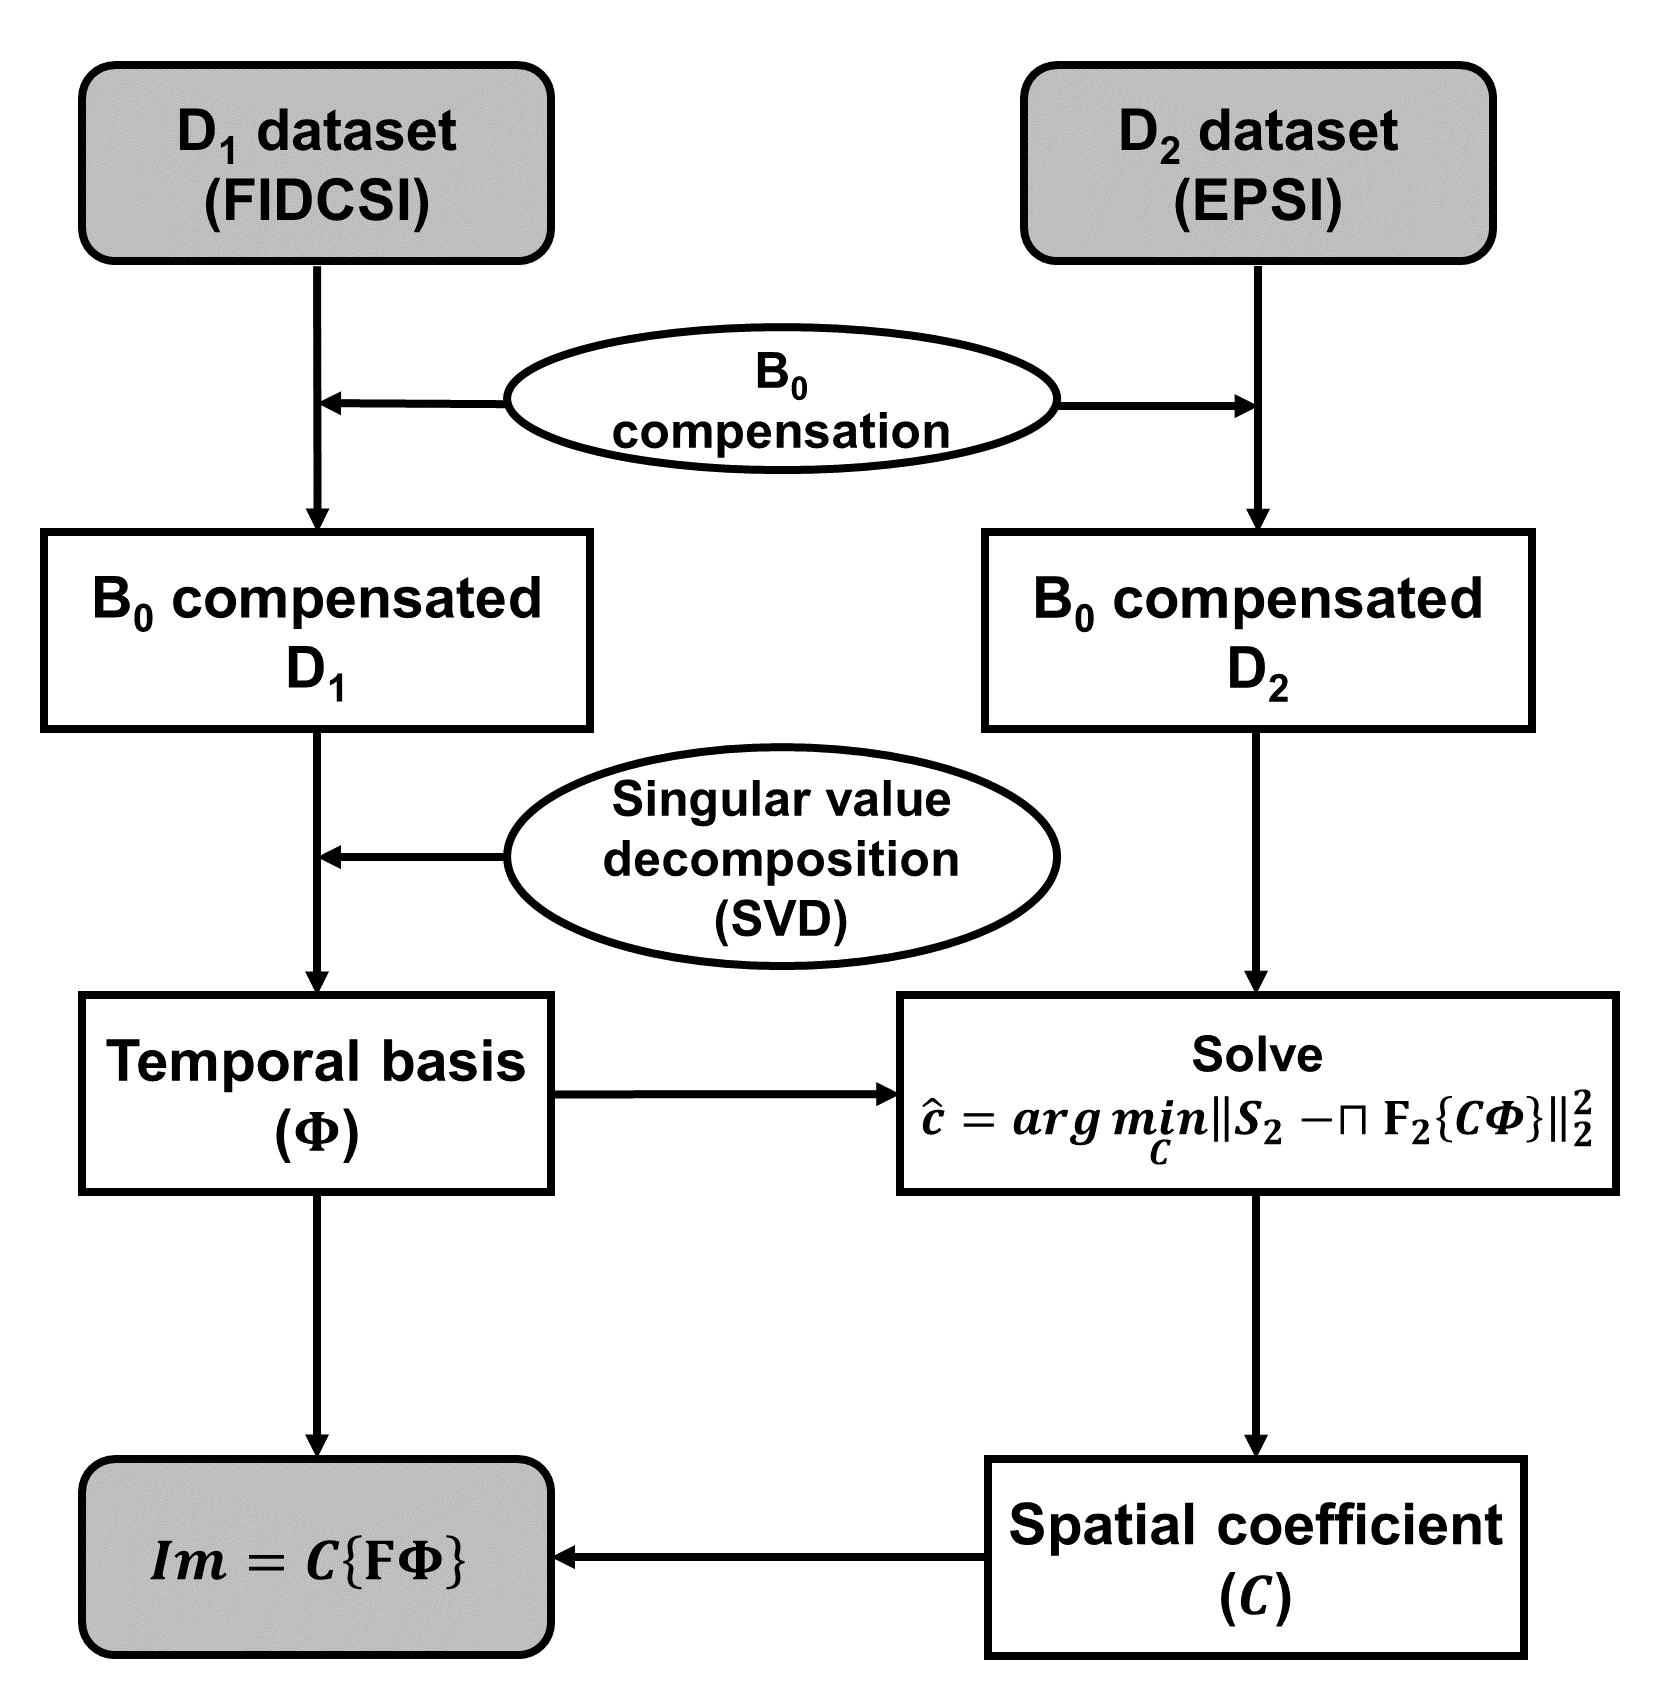
In spectroscopic imaging, the desired spatiotemporal signal (x-y-kt) can be expressed as $$ρ(r,t)=∑_{l=1}^LC_l(r)Φ_l(t),$$ which is known as partially separable functions4, where $$$ρ(r,t)$$$ is the spatiotemporal function, $$$C_l(r)$$$ is the spatial coefficient for $$$l^{th}$$$ order, $$$Φ_l(t)$$$ is the temporal basis function for $$$l^{th}$$$ order, and $$$L$$$ is the order of separability. Using this property of spatiotemporal function, SPICE allows acquisition of high resolution spectroscopic image with sparse sampling, exploiting the correlation between spatial and spectral information. For SPICE reconstruction, each measured dataset of D1 and D2 is compensated for B0 inhomogeneity using acquired field map. After that, D1 dataset is decomposed by singular value decomposition (SVD) to extract the temporal basis ($$$Φ$$$). Then, the spatial coefficient is determined by solving the simple least-squares problem. $$\hat{C}=arg\min_C\left||S_2-⊓F_2\left\{CΦ\right\}|\right|_2^2$$ Here, $$$S_2$$$ is the measured dataset of D2, $$$⊓$$$ is k-t space sampling operation for EPSI, and $$$F_2$$$ is 2-D Fourier transform operator. The reconstructed SPICE image can be obtained by operating 1-D Fourier transform in kt domain and then multiplying that and spatial coefficient. The process of this reconstruction is illustrated in Fig.2. Metabolite maps of pyruvate and lactate was obtained by measuring the peak values in magnitude spectrum.
Results
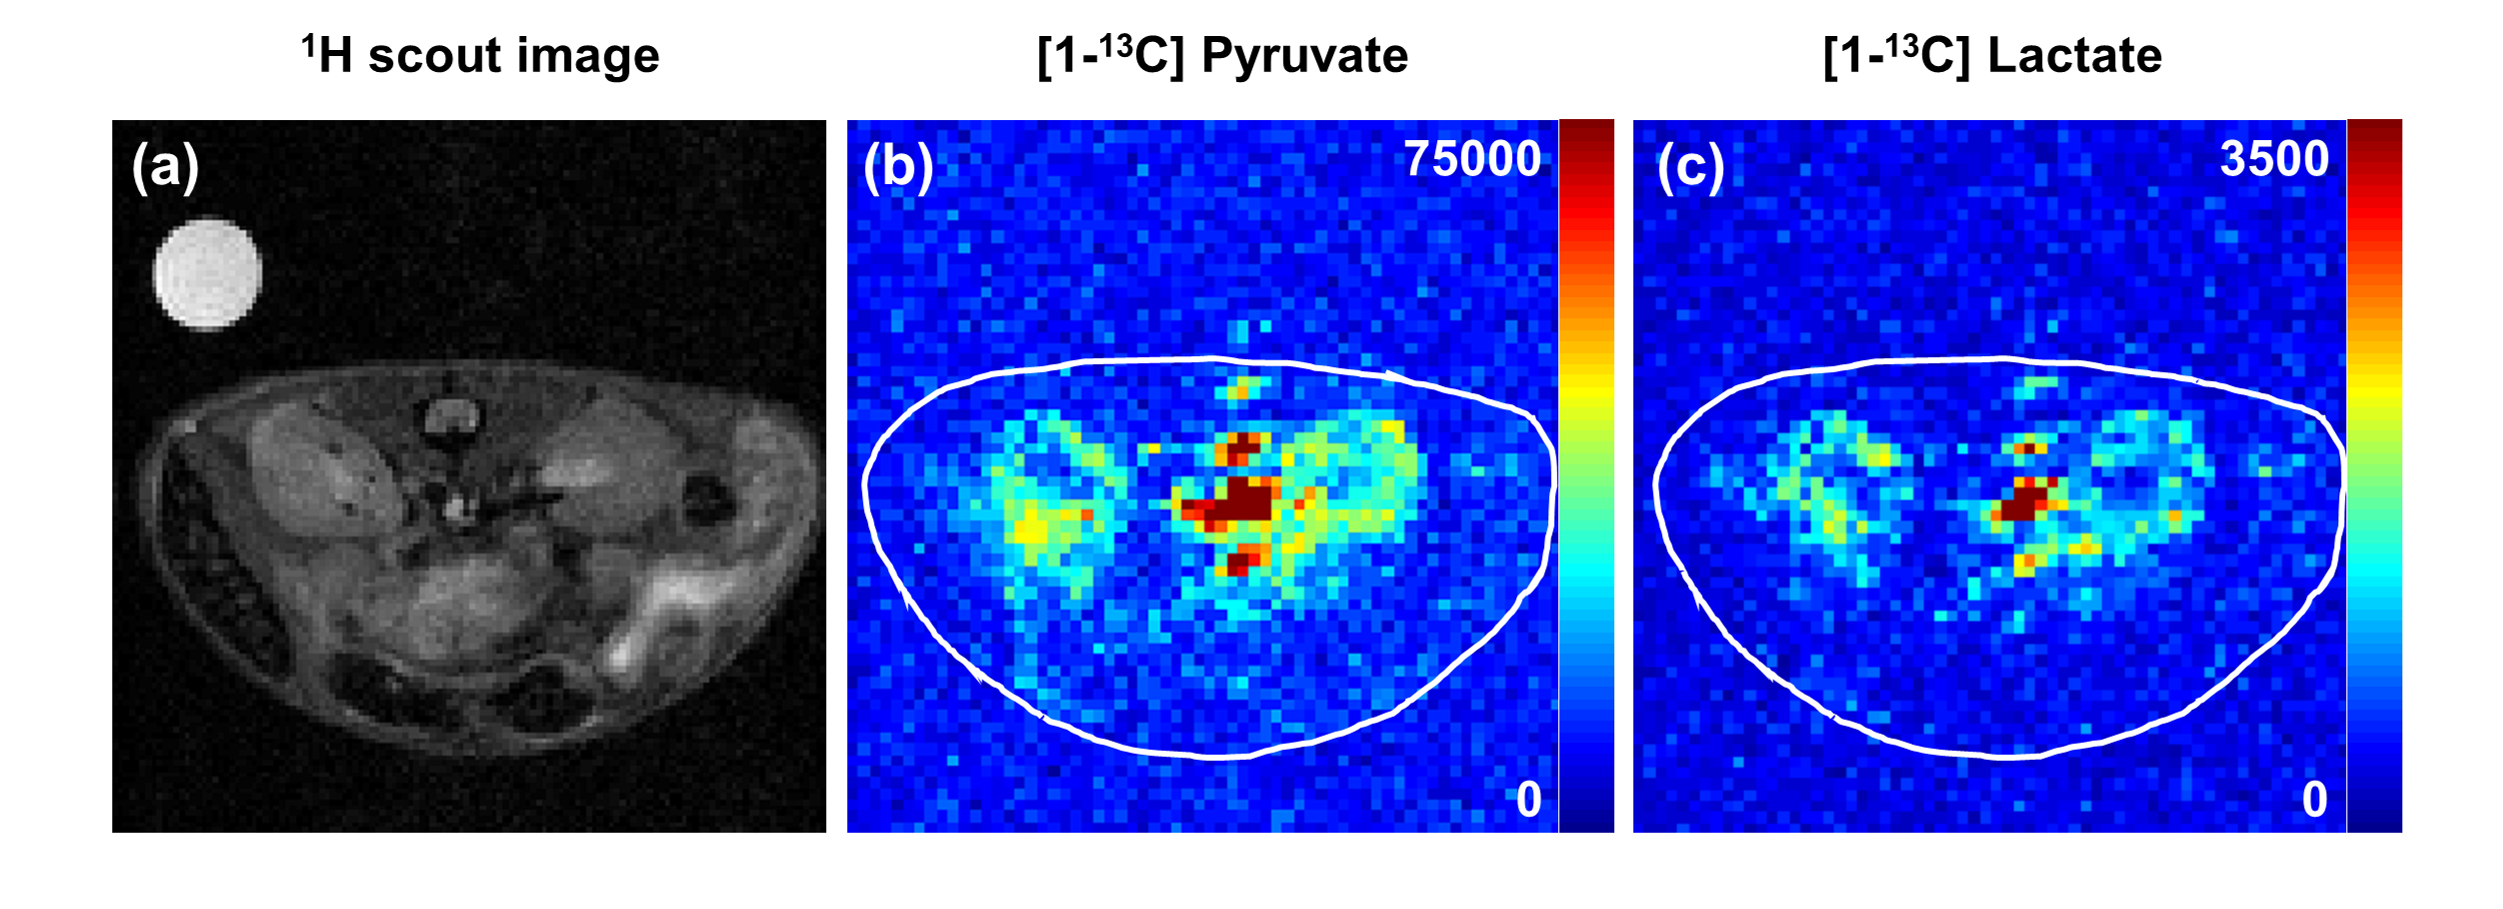
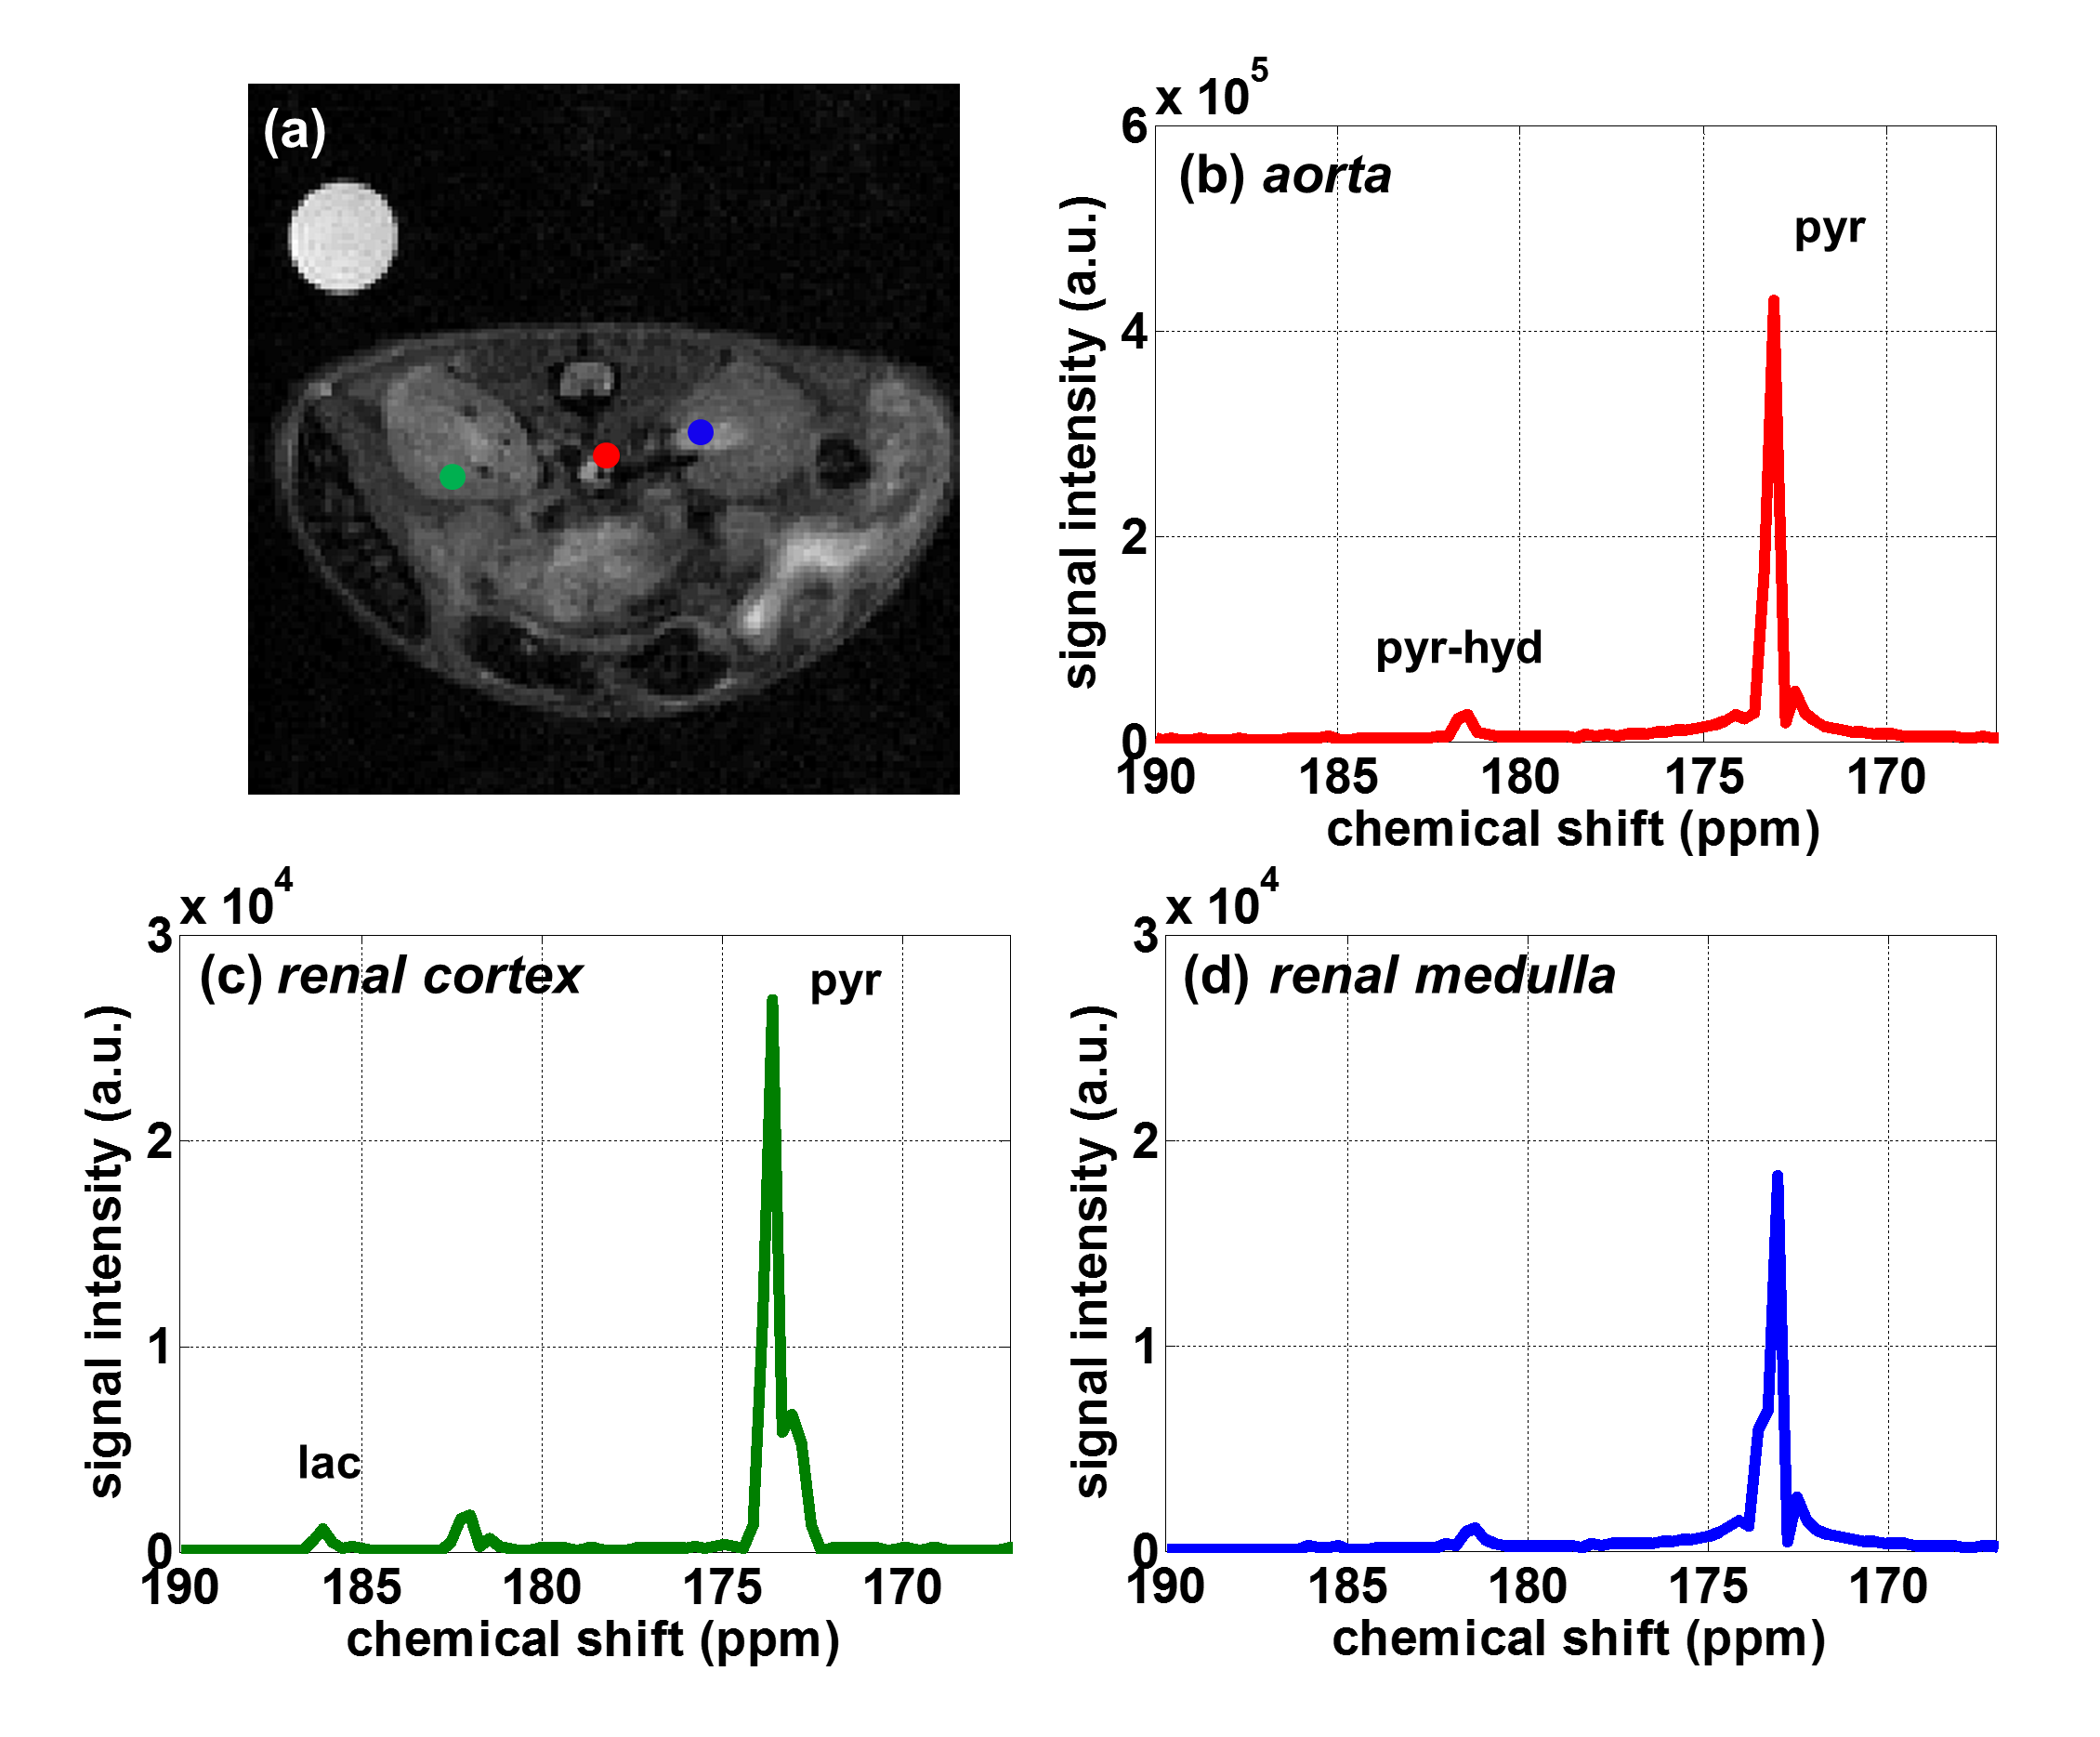
Metabolite maps of pyruvate and lactate in mouse kidney are present in Fig.2, where the resultant spatial resolution of reconstructed SPICE image is 0.47x0.47mm2. Large amount of pyruvate and lactate signal was observed in aorta. In addition, more pyruvate uptake in renal cortex was observed than in renal medulla, leading to more lactate conversion. This noticeable difference in lactate signal may be attributed to the high LDH activity in the cortex5. In addition, the magnitude spectra in representative voxel in aorta, renal cortex, and renal medulla are shown in Fig.3. In the same manner, high signal intensity of pyruvate and lactate were observed in renal cortex.Discussion and Conclusion
A high resolution spectroscopic image was acquired through applying SPICE technique in hyperpolarized 13C mouse renal MRSI at 9.4T. Acquired spectroscopic image has sufficient spatial resolution for distinction of pyruvate uptake and conversion to lactate in renal cortex. There was a time-gap between FIDCSI and EPSI scan for preparation, but it was acceptable in our experiment. In addition, scan parameters, such as preparation scan and flip angle, will be optimized in future study. As a result, we investigated that the application of SPICE in hyperpolarized 13C MRSI will have a potential to acquire high spatial resolution spectroscopic images which require quantitative analysis of metabolism as well.Acknowledgements
The authors would like to thank Eunkyung Wang for their supports.This research was supported by a grant of the Korea Health Technology R&D Project through the Korea Health Industry Development Institute (KHIDI), funded by the Ministry of Health & Welfare, Republic of Korea (grant number : HI15C2422)References
1. Cunningham CH, Chen AP, Albers MJ, et al. Double spin-echo sequence for rapid spectroscopic imaging of hyperpolarized 13C. J Magn Reson. 2007;187(2):357-362.
2. Wiesinger F, Weidl E, Menzel MI, et al. IDEAL spiral CSI for dynamic metabolic MR imaging of hyperpolarized [1-13C]pyruvate. Magn Reson Med. 2012;68:8-16.
3. Lam Fan, Liang ZP. A subspace approach to high-resolution spectroscopic imaging. Magn Reson Med. 2014;71:1349-1357.
4. Liang ZP. Spatiotemporal imaging with partially separable functions. In IEEE International Symposium on Biomedical Imaging, Arlington, VA, USA, 2007. pp. 988-991.
5. Needleman P, Passonneau JV, Lowry OH. Distribution of glucose and related metabolites in rat kidney. Am J Physiol. 1968;215:655-659.
Figures