3697
Analysis of the feasibility in using the SPICE technique for hyperpolarized 13C1Department of Electrical and Electronic Engineering, Yonsei University, Seoul, Korea, Republic of
Synopsis
In this study, using high spatial and/or spectral resolution CSI technique in 1H, the SPICE (SPectroscopic Imaging by exploiting spatiospectral CorrElation), we investigated the feasibility of using SPICE in hyperpolarized 13C through numerical simulations for applications targeted for Kp estimation and high resolution studies. The error of the fitted Kp were within ±20% of the true value and the high spatial resolution rat brain image was reconstructed. It is seen that this method can be transferred to a hyperpolarized 13C situation where due to the T1 decay and metabolite exchange the temporal basis can change dynamically.
Introduction
In hyperpolarized 13C MRSI, the signal level is enhanced up to 10,000 times compared to the thermal equilibrium state. However, it decreases irrecoverably due to T1 relaxation and RF excitation limiting the available scan time. Due to this restriction, fast imaging sequences have been required1,2. One potential method recently developed for 1H MRSI is the SPICE (SPectroscopic Imaging by exploiting spatiospectral CorrElation) technique. Here, by utilizing the partially separability of spatial and temporal functions, acquisition of high spatial and/or spectral resolution CSI is enabled3. The direct transfer of this method to hyperpolarized 13C is questionable due to the varying nature of the signal in terms of T1 relaxation, irrecoverable after RF, metabolic exchange. In this study, we investigated the feasibility of using SPICE in hyperpolarized 13C through numerical simulations for applications targeted for Kp estimation and high resolution studies.Methods
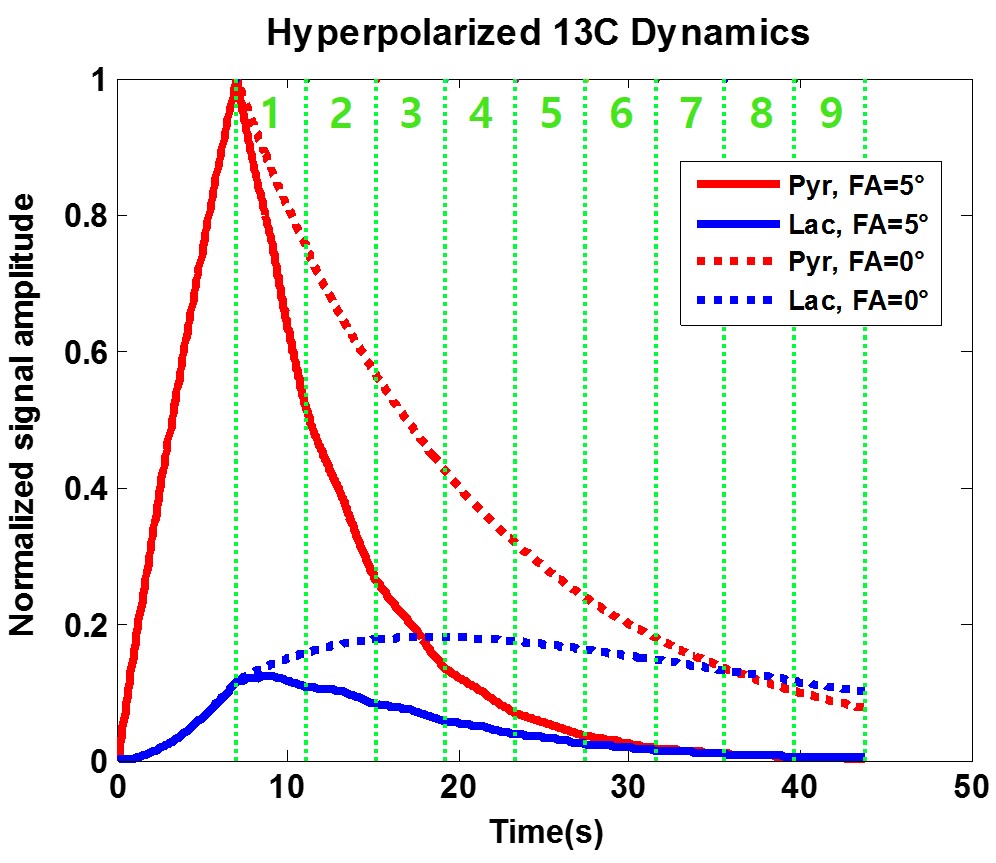
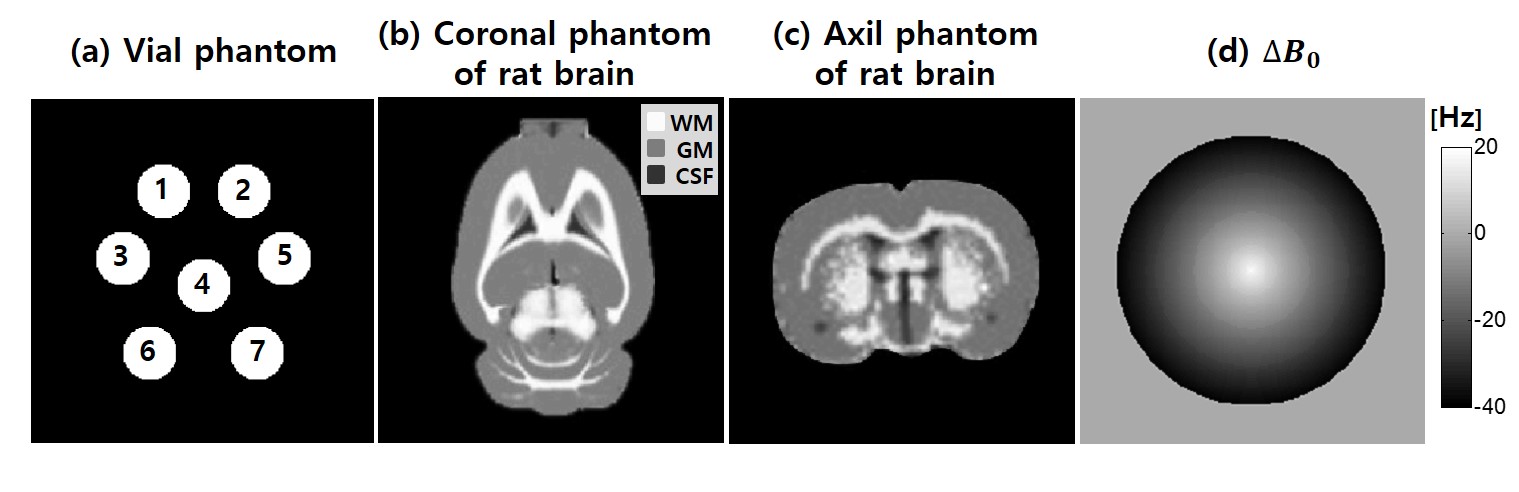
For numerical simulation of SPICE in the hyperpolarized 13C MR environment, pyruvate and lactate signal was generated using two-site exchange model with an arterial input function. The dynamics between pyruvate and lactate are represented with the dotted line in Fig. 1, and the signal behavior assuming RF excitation (FA = 5°) is plotted with solid line in Fig. 1. The T1 and T2* were assumed to be 20 s and 40 ms, respectively (9.4T environment). To apply the SPICE method, two following dataset acquisitions were simulated; 1. D1 dataset (D1 obtains the temporal basis over the FOV) using a low spatial and high spectral resolution centric ordered free induction decay chemical shift imaging (FIDCSI) sequence 2. D2 dataset (D2 obtains the spatial coefficients for the D1 temporal basis) using a high spatial and low spectral resolution echo-planar spectroscopic imaging (EPSI) sequence with bipolar readout gradient simulation. After data acquisition, the D1 dataset was decomposed using singular value decomposition (SVD) to obtain the temporal basis, and the spatial coefficients were obtained from least squared solution using the temporal basis and D2 dataset. Using the acquired temporal basis and spatial coefficient, the spectroscopic images with high spatial and spectral resolution were reconstructed. Field inhomogeneity was distributed radially from -30 Hz to 20 Hz (Fig. 2c) and compensated in each D1 and D2 dataset.
[Numerical vial phantom for feasibility of Kp value estimation]
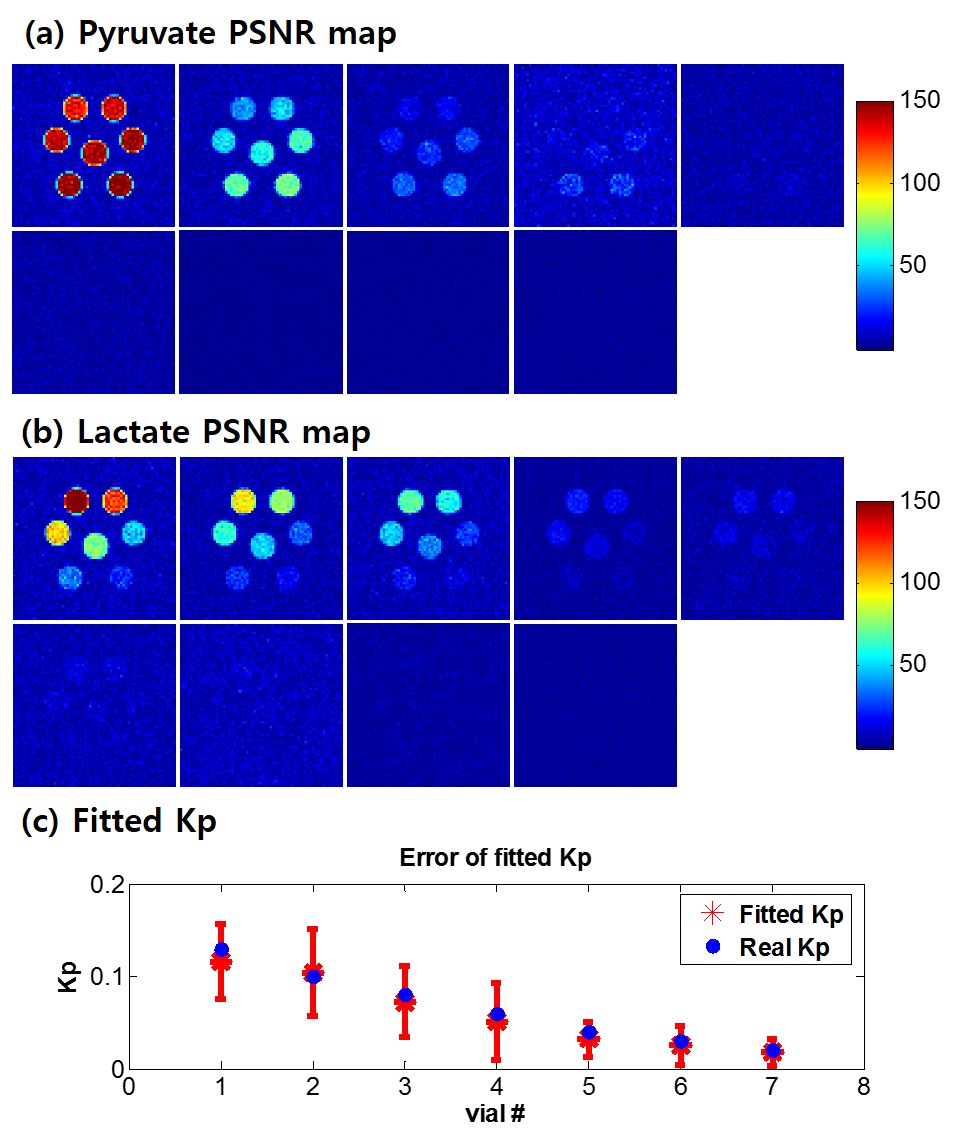
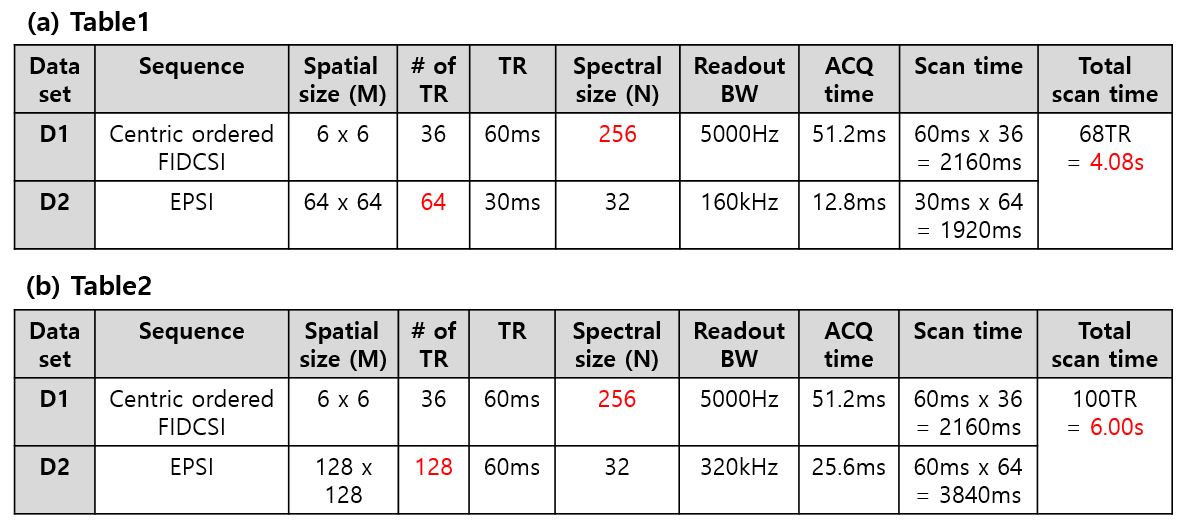
Seven numerical vial phantoms with different Kp values were designed as in Fig. 2a (Kp =0.13, 0.10, 0.08, 0.06, 0.04, 0.03, 0.02). Before data acquisition, noise was added in k-space resulting in peak SNR (PSNR) of pyruvate to be approximately 150. The imaging parameters for FIDCSI and EPSI were set as in Table 1. The total scan time for one full D1 D2 set was 4.08 s. A series of images were acquired sequentially in 9 different time points during a total of 36.72 s. The PSNR map of pyruvate and lactate in each time point were obtained, and the Kp value was estimated by fitting to two-site exchange model.
[Numerical in vivo phantom]
A numerical in vivo phantom which reflects rat brain morphometry4 was designed as in Fig. 2b and Fig. 2c. The Kp of WM, GM and CSF was set to 0.04, 0.02 and 0.01. Noise was added to the simulated k-space resulting in PSNR of pyruvate of approximately 150. The imaging parameters for FIDCSI and EPSI were set as in Table 2. The total scan time for one full D1 D2 set was 6.00 s.
Results
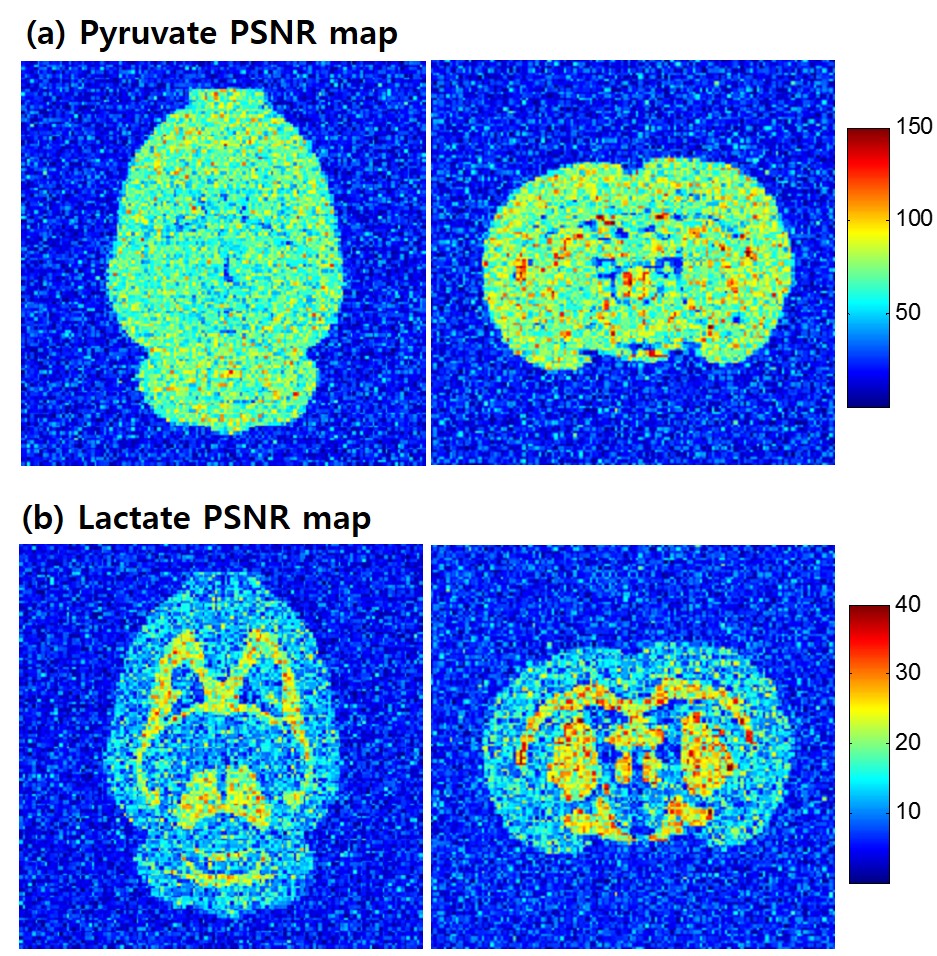
In the numerical vial phantom, 64x64 spatial resolution CSI were reconstructed as in Fig. 3a and Fig. 3b for each time point. The signal decay during the time points was used to fit Kp. The error of the fitted Kp were within ±20% of the true value. It is seen from the results of the numerical vial phantom that SPICE could be applied to hyperpolarized 13C for evaluation of Kp values. The results of the numerical in vivo phantom are shown in Fig. 4a and Fig. 4b. 128x128 high resolution CSI images of Fig. 4a and Fig. 4b, are a good agreement with anatomy image of Fig. 2b and Fig. 2c. In the lactate PSNR map, we can distinguish WM and GM of rat brain.Discussion and Conclusion
The SPICE technique, using temporal basis and spatial coefficients, can be effectively used to reduce total scan time for high resolution image. It is seen that this method can be transferred to a hyperpolarized 13C situation where due to the T1 decay and metabolite exchange the temporal basis can change dynamically. Further studies using in in vivo situations are underway.Acknowledgements
This research was supported by a grant of the Korea Health Technology R&D Project through the Korea Health Industry Development Institute (KHIDI), funded by the Ministry of Health & Welfare, Republic of Korea (grant number : HI15C2422)References
1. Mayer D, Yen YF, Tropp J, et al. Application of subsecond spiral chemical shift imaging to real-time multislice metabolic imaging of the rat in vivo after injection of hyperpolarized 13C1-pyruvate. MRM 2009;62(3):557–564.
2. Yen YF, Kohler SJ, Chen AP, et al. Imaging considerations for in vivo 13C metabolic mapping using hyperpolarized 13C-pyruvate. MRM 2009;62(1):1-10.
3. F. Lam, C. Ma, B. Clifford, et al. High-Resolution 1H-MRSI of the Brain Using SPICE: Data Acquisition and Image Reconstruction. MRM. 2016;76(4):1059-1070.
4. Valdés-Hernández PA, Sumiyoshi A, Nonaka H, et al. An in vivo MRI template set for morphometry, tissue segmentation, and fMRI localization in rats. Front.Neuroinform. 2011;24:5-26.
Figures