3696
Effect of B0 inhomogeneity on the quantification of hyperpolarized metabolic data of the heart at 9.4T1Institute for Biomedical Engineering, ETH and University Zurich, Zurich, Switzerland
Synopsis
The effect of B0 inhomogeneity on the quantification of hyperpolarized metabolic data is studied using simulations based on B0 maps acquired in-vivo in rat hearts at 9.4T. Kinetic modelling is compared to area-under-the-curve analysis and both methods are applied to average signals over myocardial segments and individual voxels, respectively.
Introduction
Hyperpolarized magnetic resonance imaging of the heart using [1-13C] pyruvate polarized with Dynamic Nuclear Polarization (DNP) is a promising tool to study cardiac metabolism1. Several quantification approaches for hyperpolarized data have been proposed. These methods can broadly be categorized into two groups2: 1) kinetic modelling and 2) model-free methods. At the high field strengths used in preclinical experiments, it can be challenging to obtain a homogenous B0 field and intravoxel dephasing induced by B0 field inhomogeneity leads to signal losses. In this work, the effect of B0 inhomogeneity on the quantification of hyperpolarized metabolic data is studied using simulated data and B0 maps acquired in-vivo in rat hearts at 9.4T. Results from kinetic modelling were compared to analysis using the area-under-the-curve3 (AUC) of the signal-time curves, a model-free method.Methods
In-vivo B0 maps of healthy rat hearts were acquired for three cases: 1) no shim currents activated, 2) upon first order shimming by minimizing the water line width using a localized spectroscopic pulse sequence with a voxel covering the left ventricle, and 3) upon second order shimming using field maps and a region-of-interest covering the left ventricle. Dynamic metabolic data for pyruvate in the left ventricular blood pool and lactate and bicarbonate in the myocardium were simulated at a resolution of 1.25x1.25mm2 using rat heart anatomy. Noise was added resulting in peak voxel-wise signal-to-noise (SNR) values of 110, 17 and 10 for pyruvate, lactate and bicarbonate, respectively, corresponding to values reported for in-vivo measurements4. Intravoxel dephasing effects in the myocardium were simulated with the high-resolution multi-slice in-vivo B0 maps (N=3 times the metabolic image resolution along each spatial direction). Frequency offsets of N3 subvoxels per voxel in the metabolic image were calculated and the signal per voxel in the metabolic maps was calculated as follows:
$$M_{xy,dephas}(t) = M_{xy}(t)*\frac{1}{N^3}\sum_{i=1}^{N^3}{e^{i2\pi \Delta f_i}}$$
where Δfi is the frequency offset of the ith subvoxel, Mxy(t) is the magnitude of the magnetization in the xy-plane and Mxy,dephas(t) is the magnitude of the magnetization taking into account the intravoxel dephasing. The reconstructed dynamic data with the frequency offsets for the three shim scenarios were quantified and compared to the quantification of the noise-free undistorted data using the root-mean-square error (RMSE). Quantification was carried out with two methods: 1) Area-under-the curve (AUC)3 values of pyruvate, lactate and bicarbonate were calculated by integrating the signal-time-curves and then ratios of the metabolites were computed. 2) Kinetic modelling was performed by solving the following equations:
$$\frac{dP}{dt} = -(k_{PL} + k_{PB} + r_{1P})P + U$$
$$\frac{dL}{dt} = k_{PL}P-r_{1L}L$$
$$\frac{dB}{dt} = k_{PB}P-r_{1B}B$$
$$U=A(t-t_{arr})^{\alpha}e^{\frac{-(t-t_{arr})}{\beta}}$$
where P, L and B are the hyperpolarized signals of pyruvate, lactate and bicarbonate, kPL and kPB are the apparent rate constansts and r1X are decay time constants taking into account T1 relaxation and RF excitation. U is a gamma-variate input function where A, α and β describe the shape and tarr is the arrival time. The equations were simultaneously solved using Matlab. Voxel-wise quantification was compared to segmental quantification using the average signals in four myocardial segments (anterior, septal, inferior, lateral) for both methods.
Results
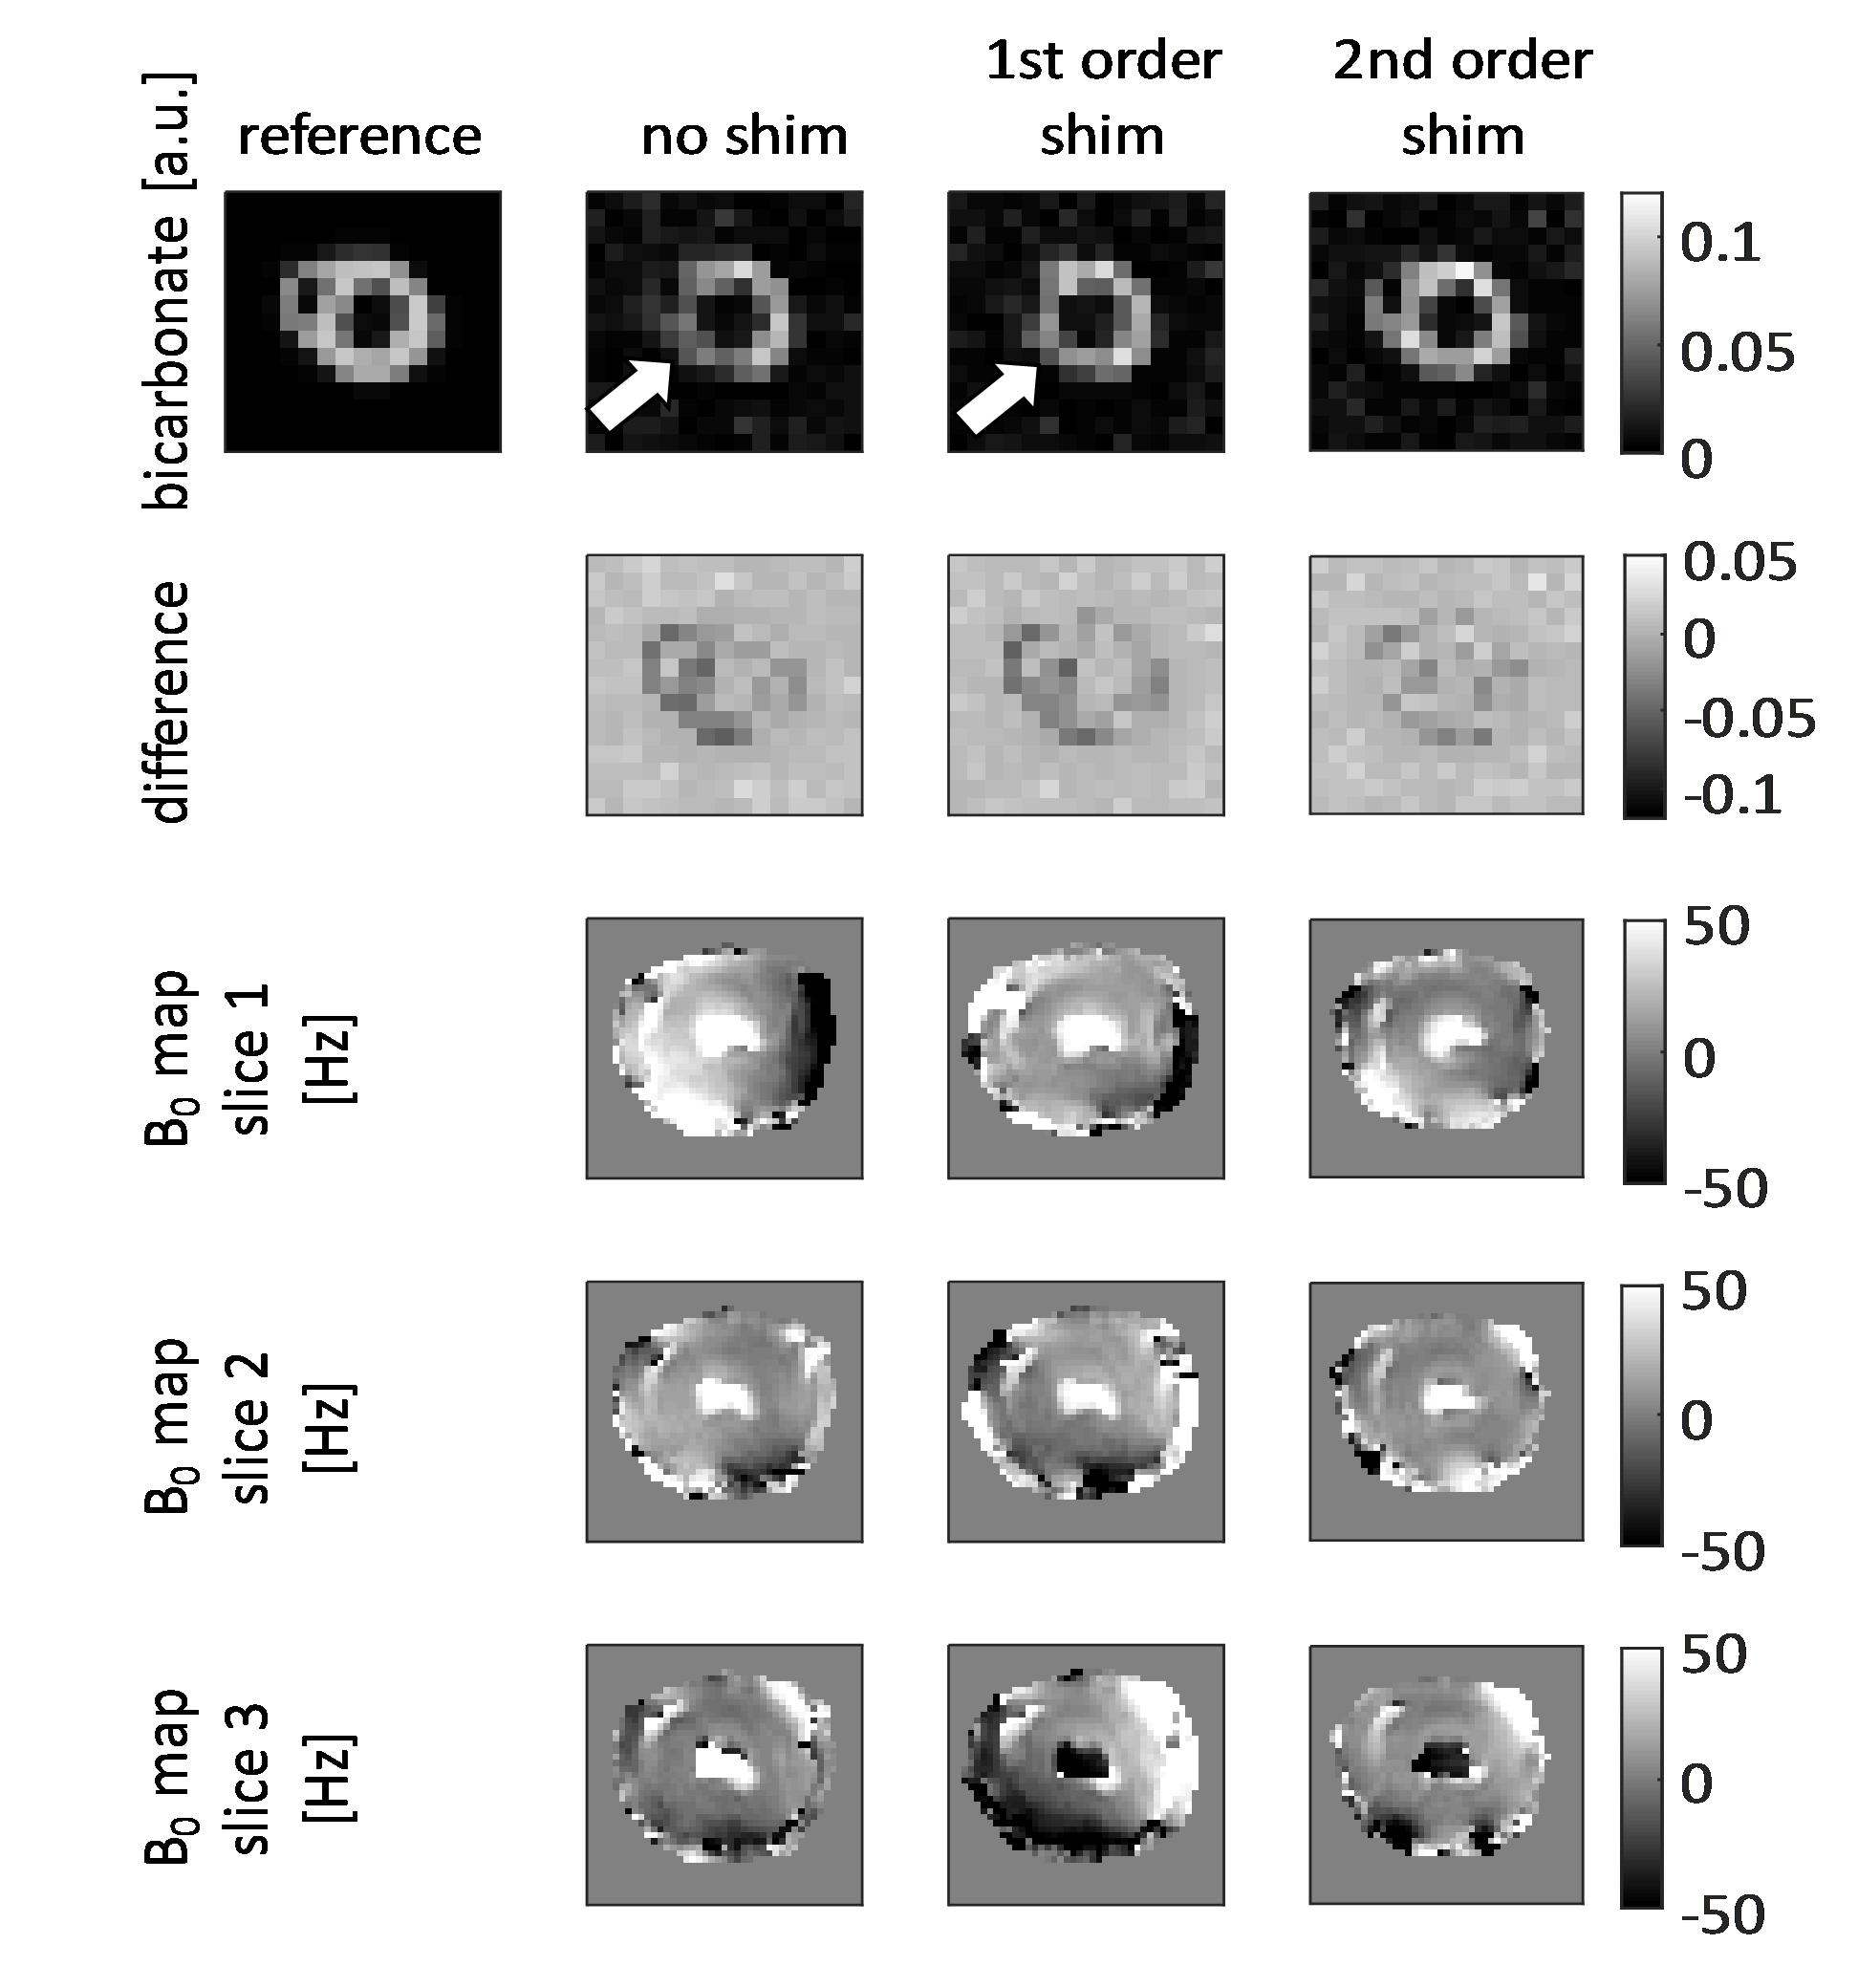
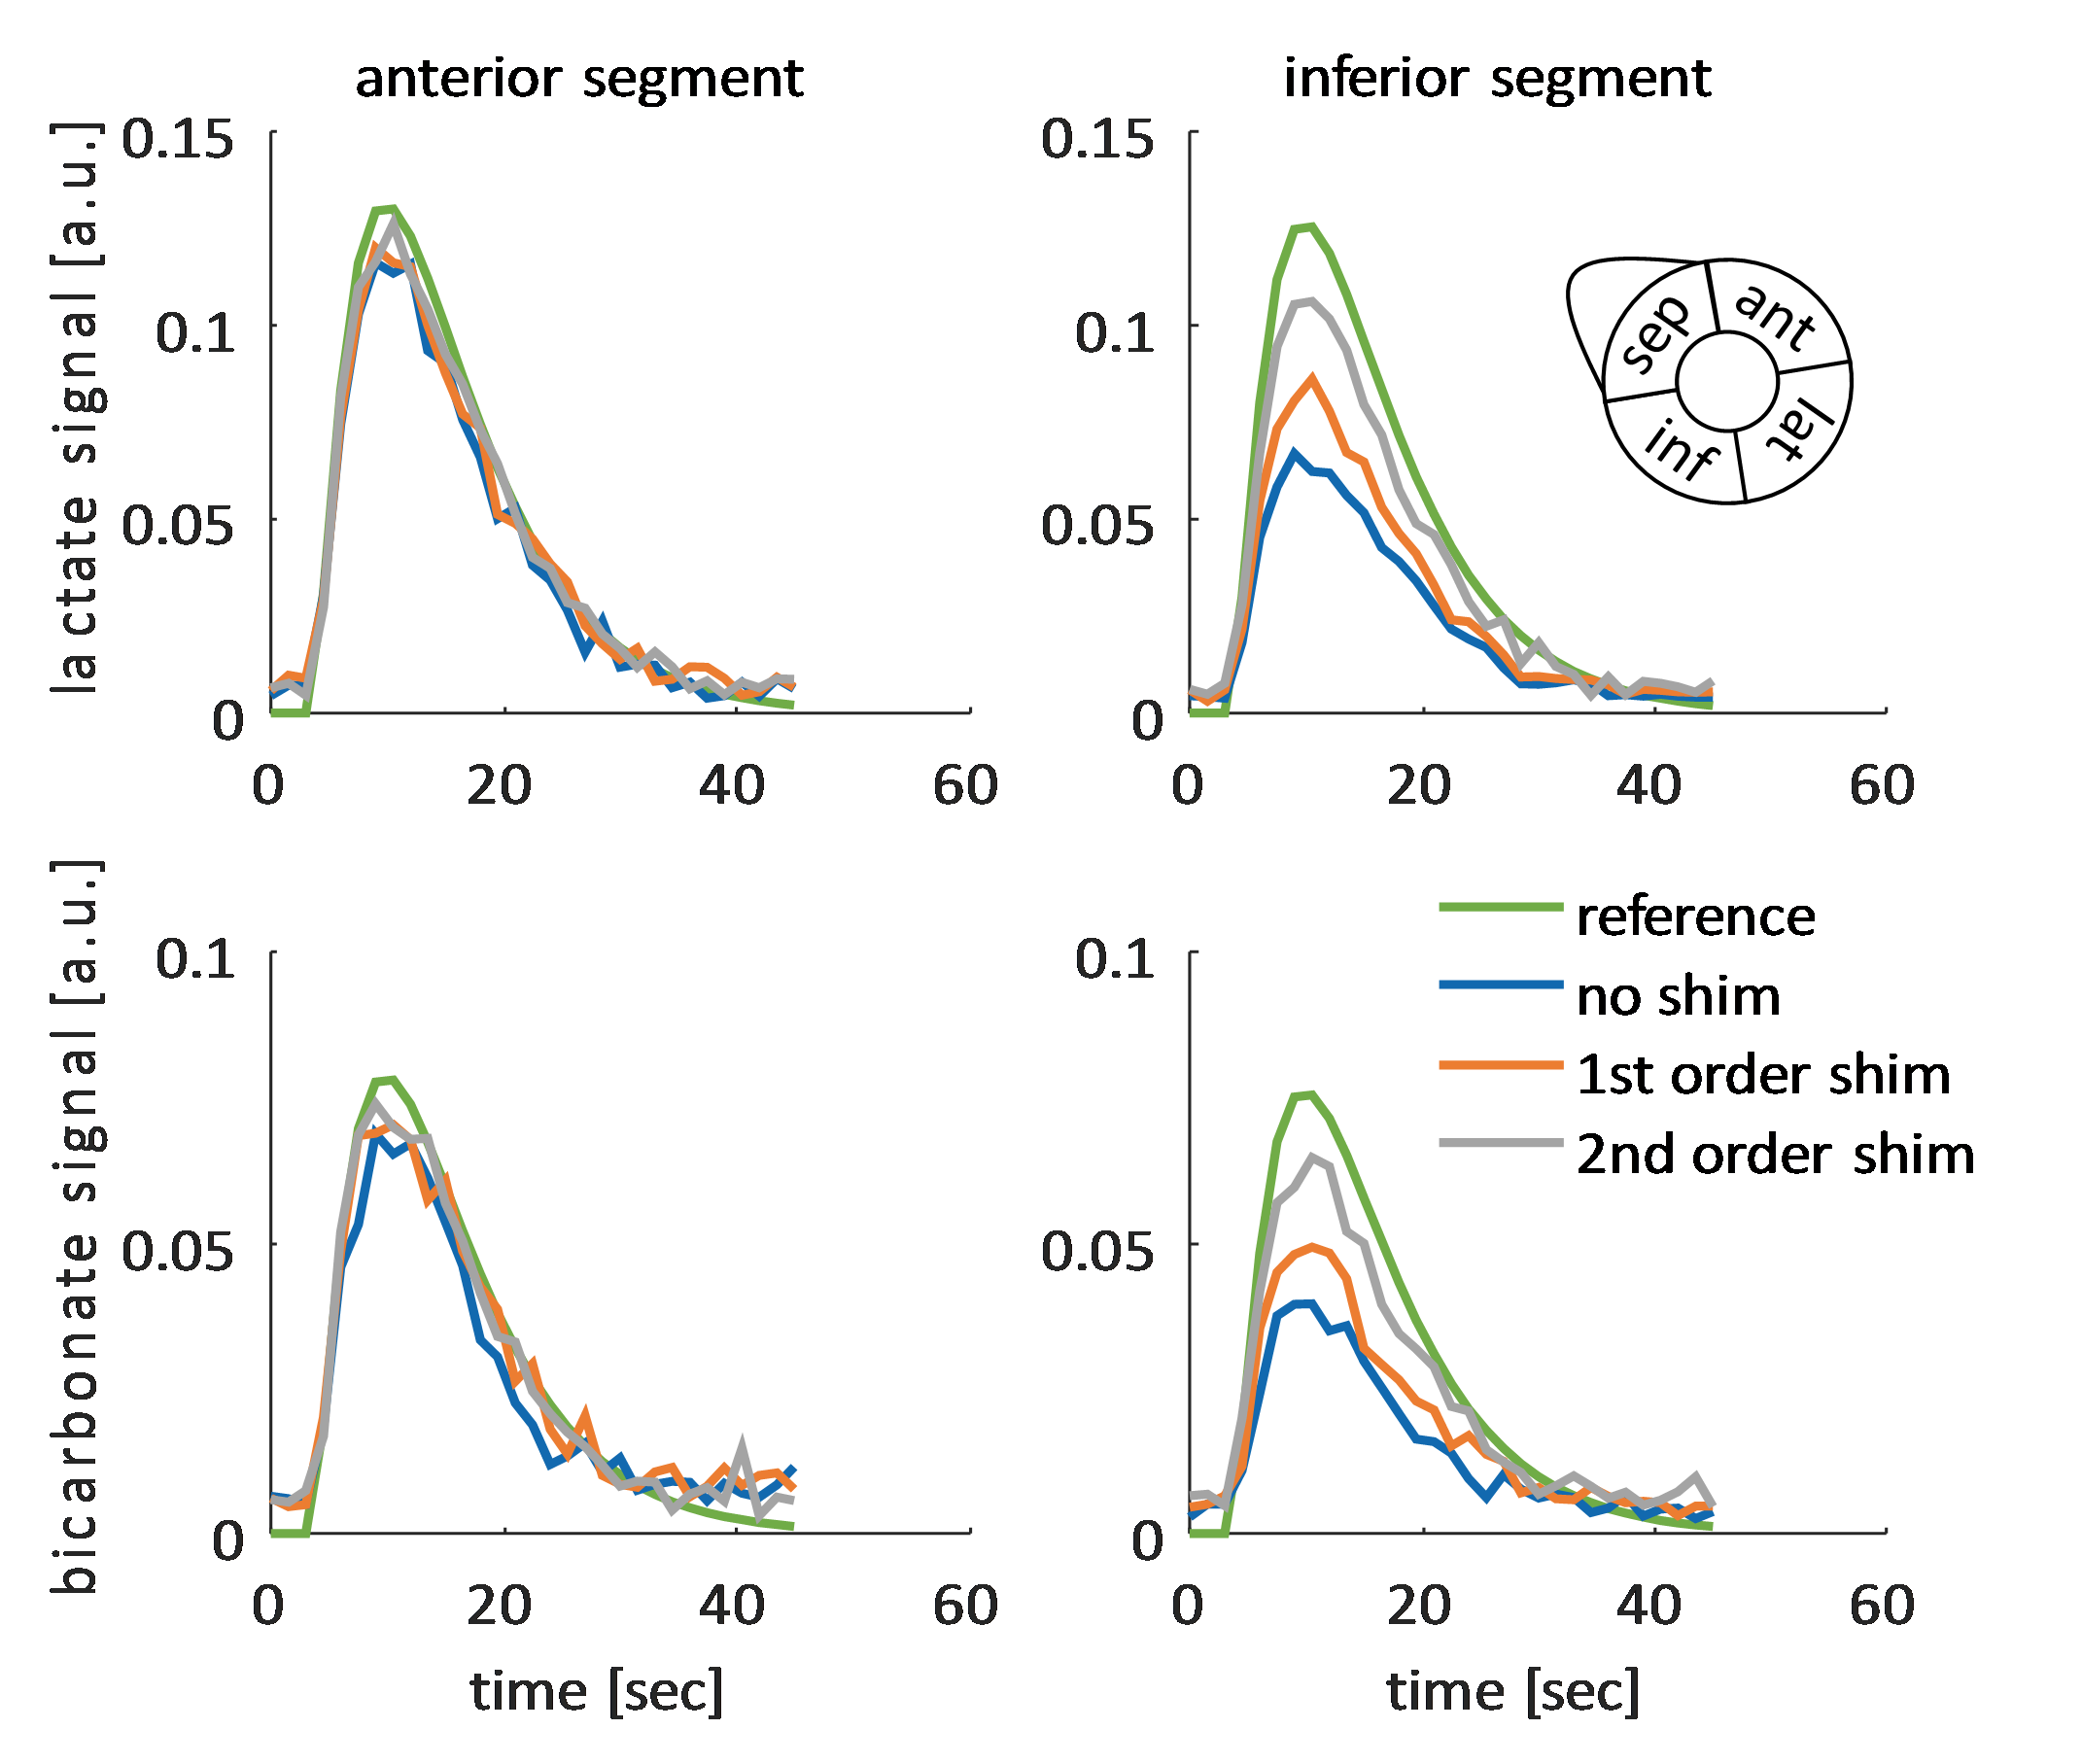
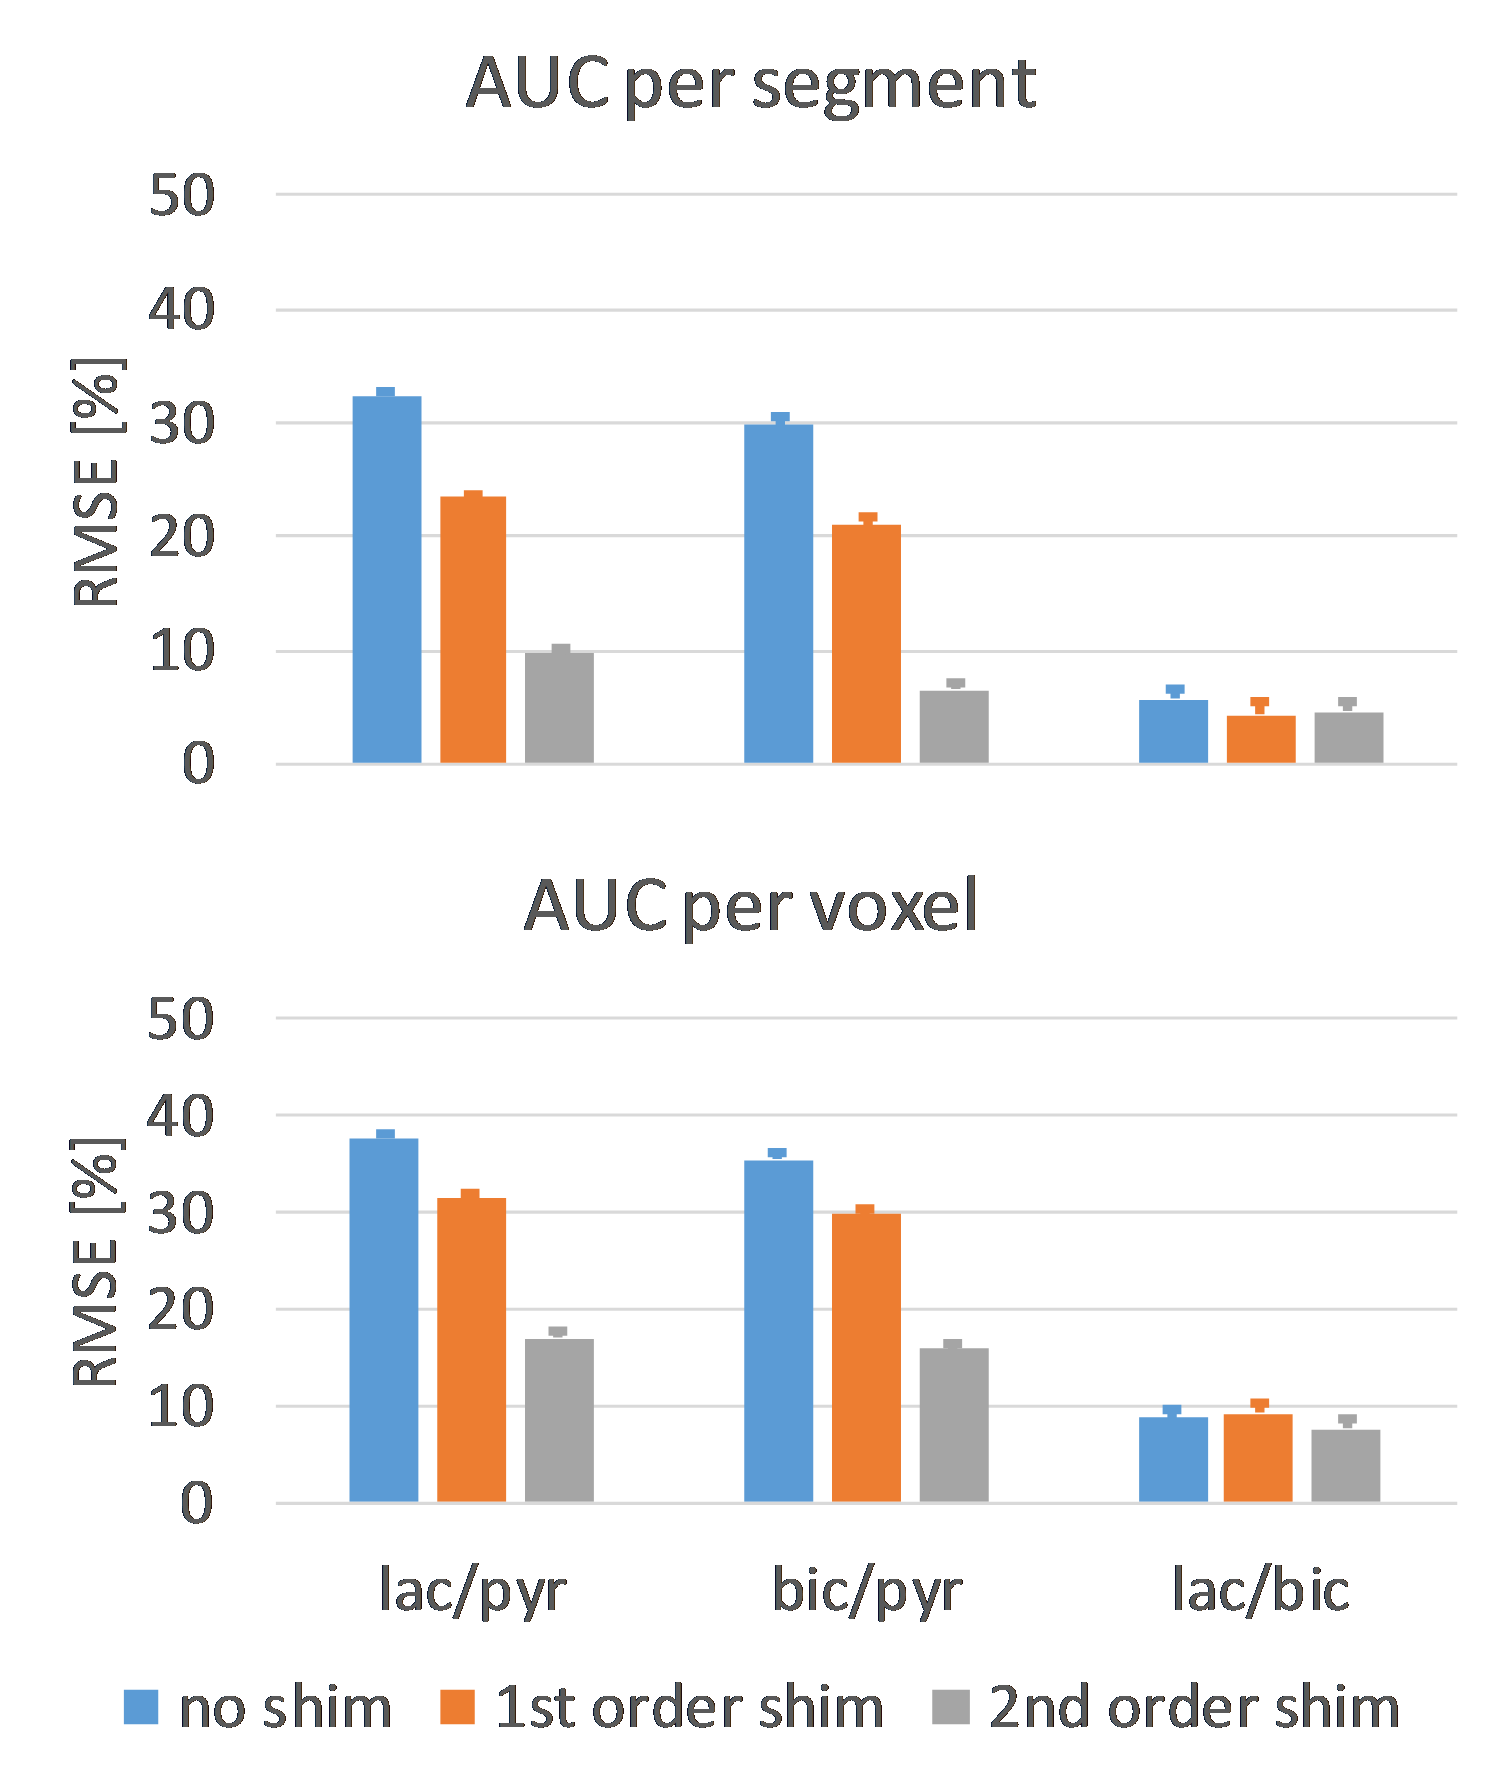
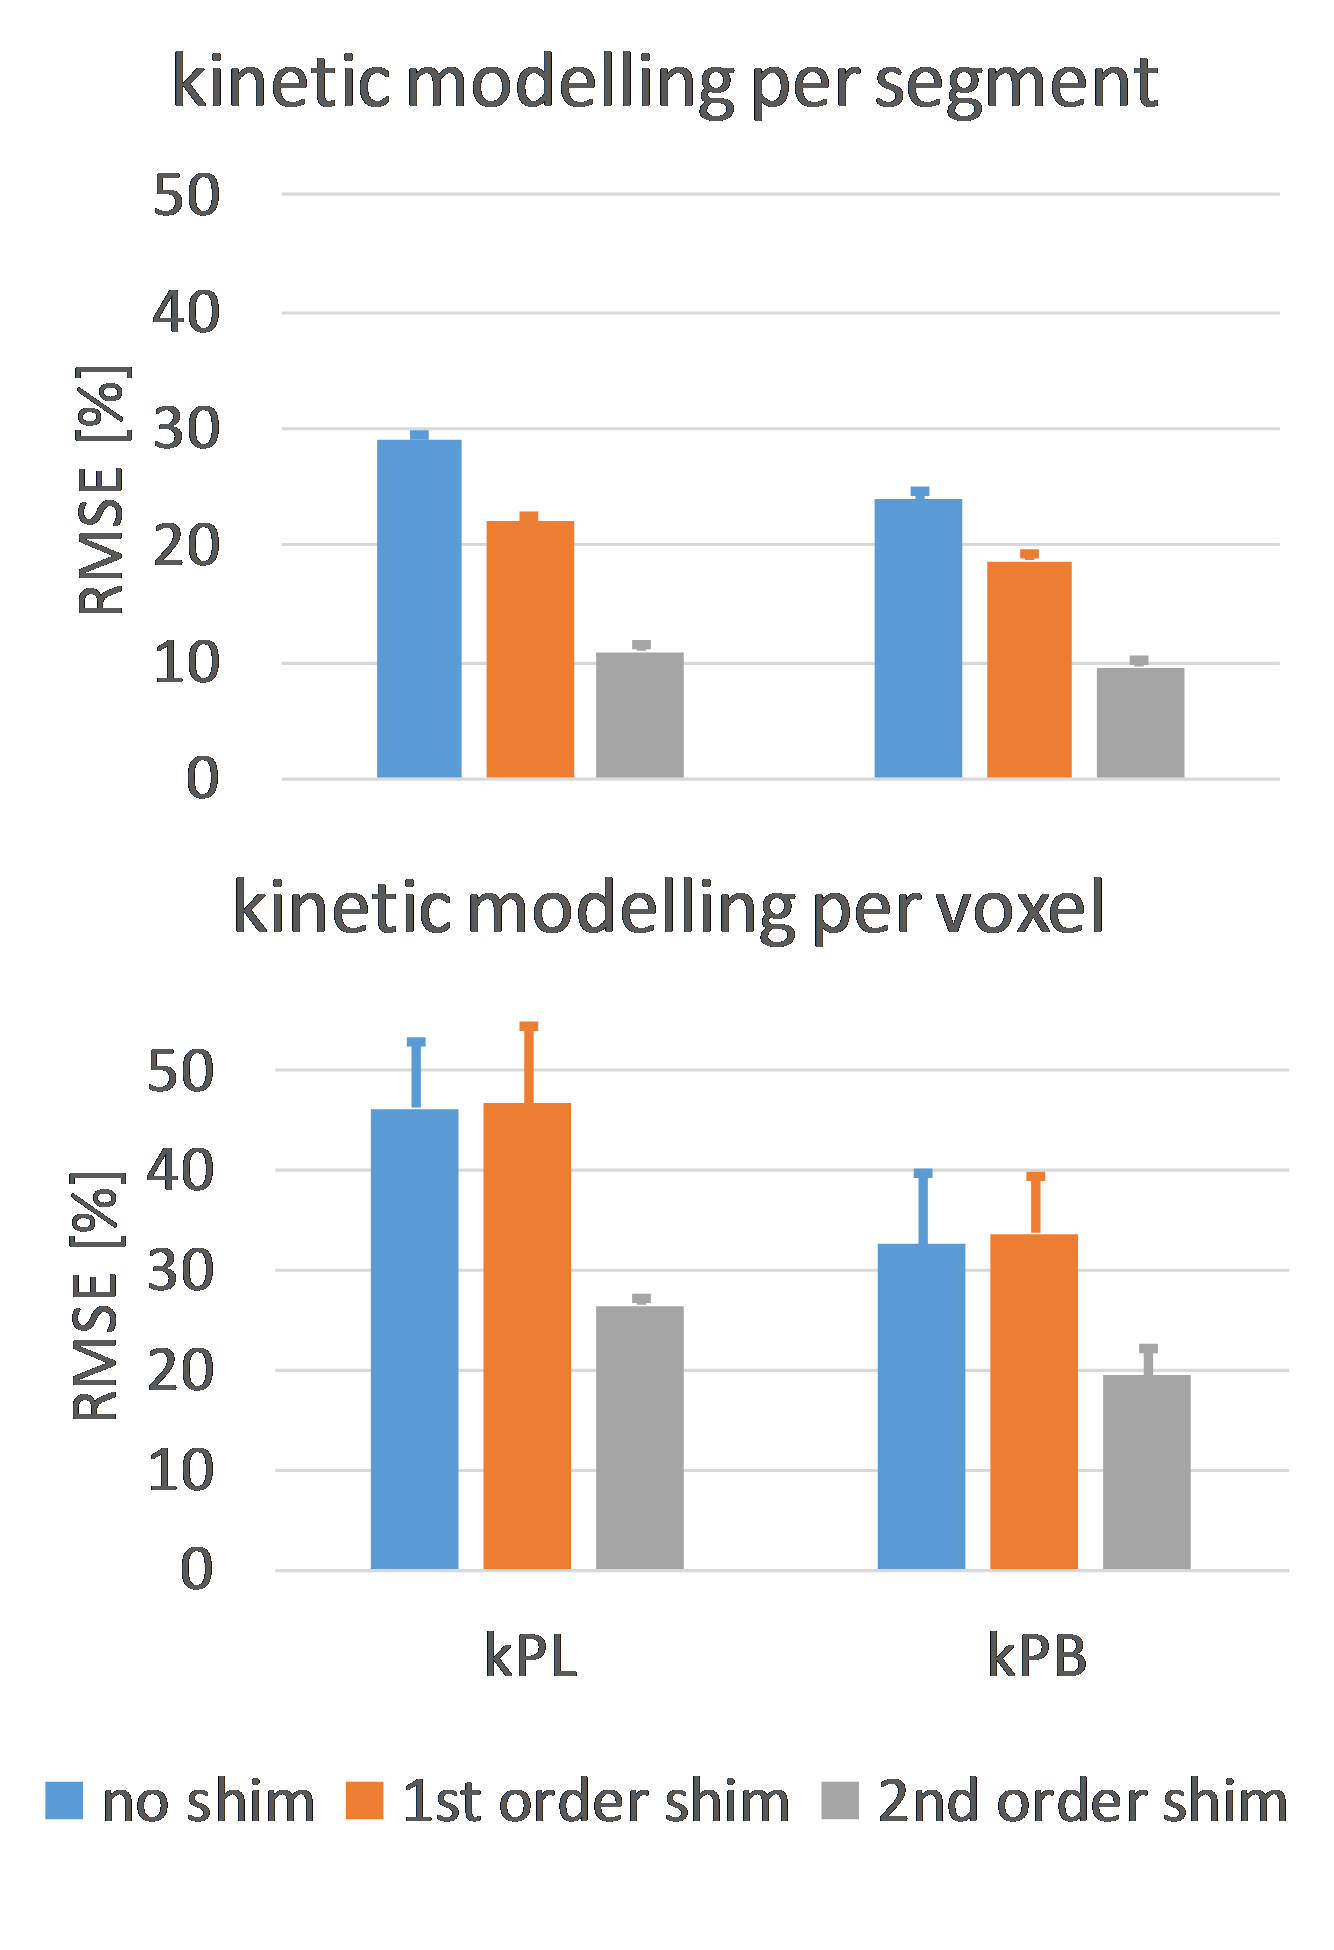
Figure 1 shows an example dynamic frame of the bicarbonate image and the reconstructed images taking into account intravoxel dephasing for the three cases (no shim, first order shim, second order shim). Significant loss of signal can be observed in the inferior and septal segments of the heart, when no shimming is applied. Figure 2 shows signal-time curves for lactate and bicarbonate in the anterior and inferior segments of the myocardium. Figures 3 and 4 show the quantification errors due to B0 inhomogeneity for the two methods. Errors range from 47% in the case of voxel-wise kinetic modelling without shim to 5% for the segment-wise AUC lactate/bicarbonate ratio with second order shim.Discussion
Simulations using in-vivo B0 maps show that intravoxel dephasing induced by B0 field inhomogeneity can lead to errors in the quantification of hyperpolarized data as high as 47% when no shimming is used. First and second order shimming reduce the error, but it can still be higher than 15% depending on the quantification method. Segment-wise analysis generally performed better than voxel-wise analysis due to the low SNR in lactate and bicarbonate images. The segment-wise AUC ratio of lactate-to-bicarbonate was found to be most robust against B0 inhomogeneity due to the fact that localized B0 effects cancel out when taking the ratio of signals that both originate from the myocardium. Furthermore, this approach has the advantage of not needing an input curve, which may be challenging to acquire accurately in-vivo.Acknowledgements
The authors acknowledge funding from the Swiss National Science Foundation, grant 320030_153014.References
1. Schroeder MA, Clarke K, Neubauer S, Tyler DJ. Hyperpolarized Magnetic Resonance A Novel Technique for the In Vivo Assessment of Cardiovascular Disease. Circulation 2011;124:1580–1594.
2. Daniels CJ, McLean MA, Schulte RF, et al. A comparison of quantitative methods for clinical imaging with hyperpolarized13C-pyruvate. NMR Biomed 2016.
3. Hill DK, Orton MR, Mariotti E, et al. Model Free Approach to Kinetic Analysis of Real-Time Hyperpolarized 13C Magnetic Resonance Spectroscopy Data. PLoS ONE 2013;8:e71996.
4. Krajewski M, Wespi P, Busch J, Wissmann L, Kwiatkowski G, Steinhauser J, Batel M, Ernst M, Kozerke S. A multisample dissolution dynamic nuclear polarization system for serial injections in small animals. Magn Reson Med 2016.
Figures