3693
High Spatiotemporal Resolution bSSFP Imaging of Hyperpolarized 13C Lactate and Pyruvate using Spectral Suppression of Alanine and Pyruvate-hydrate at 3T1Radiology and Biomedical Imaging, UCSF, San Francisco, CA, United States, 2UC Berkeley-UCSF Graduate Program in Bioengineering, UCSF and University of California, Berkeley, San Francisco, CA, United States
Synopsis
The bSSFP sequence provides high spatial and temporal resolution capabilities, but has a difficult to manage frequency response at 3T with regards to hyperpolarized [1-13C]pyruvate and its products. The purpose of this project was to integrate a spectral suppression pulse, designed to suppress alanine and pyruvate-hydrate, with the bSSFP sequence to image [1-13C]pyruvate and its conversion to [1-13C]lactate. The results showed no significant effect on quantitative analysis of lactate-to-pyruvate ratios or kpl after suppression of alanine and pyruvate-hydrate. Subsequently, dynamic imaging of [1-13C]pyruvate and [1-13C]lactate at high in-plane spatial resolution was achieved with the bSSFP sequence.
Purpose
New hyperpolarized (HP) 13C magnetic resonance (MR) techniques have enabled real-time detection of pyruvate-to-lactate conversion in various diseases, such as cancer.1 Various imaging strategies have been developed for this purpose, such as MR spectroscopic imaging (MRSI),2 spiral,3 and echo planar imaging,4 but they are limited in achieving both high temporal and spatial resolution with sufficient SNR. The balanced steady-state free precession (bSSFP) sequence features high SNR efficiency and provides high spatiotemporal imaging,5 but has a spectral response that is difficult to manage, especially at 3 Tesla where [1-13C]pyruvate and its products resonate relatively close to each other (within 390Hz). In this project, we aimed to image HP [1-13C]pyruvate and its conversion to [1-13C]lactate dynamically via the bSSFP sequence at 3 Tesla. This was achieved by integrating spectral suppression6 of alanine and pyruvate-hydrate with an optimized pulse design, width, and repetition time.7Methods
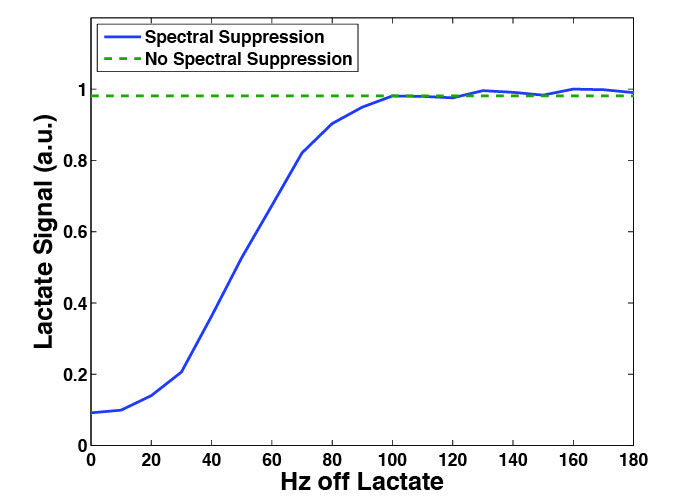
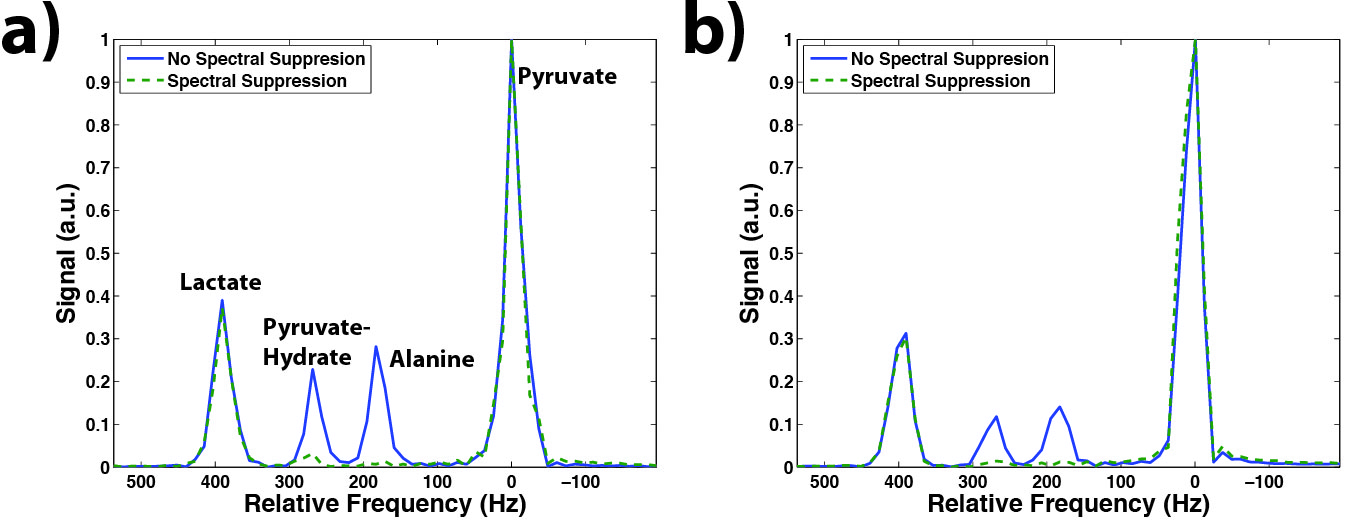
A 20ms SLR maximum-phase suppression pulse6 with an excitation bandwidth of 150Hz was initially tested in a slab-selective chemical shift imaging (CSI) sequence. The in vivo parameters were: two 12cm axial slabs, one localized on liver and one on kidney, 8cm FOV, progressive flip angle scheme,8 double-spin echo, 120ms TE, 25kHz spectral width, 2048 spectral points, 3s temporal resolution, 10 time-points, with one suppression pulse (centered ~158Hz upfield of lactate, between the alanine and pyruvate-hydrate resonances) played out prior to each time-point, ending 1ms before slab excitation. Each Sprague-Dawley rat was subjected to one scan with spectral suppression and one without spectral suppression. Thermal 13C phantom parameters were similar, except the suppression pulse center frequency was centered on lactate and moved downfield in 10Hz increments up to 180Hz.
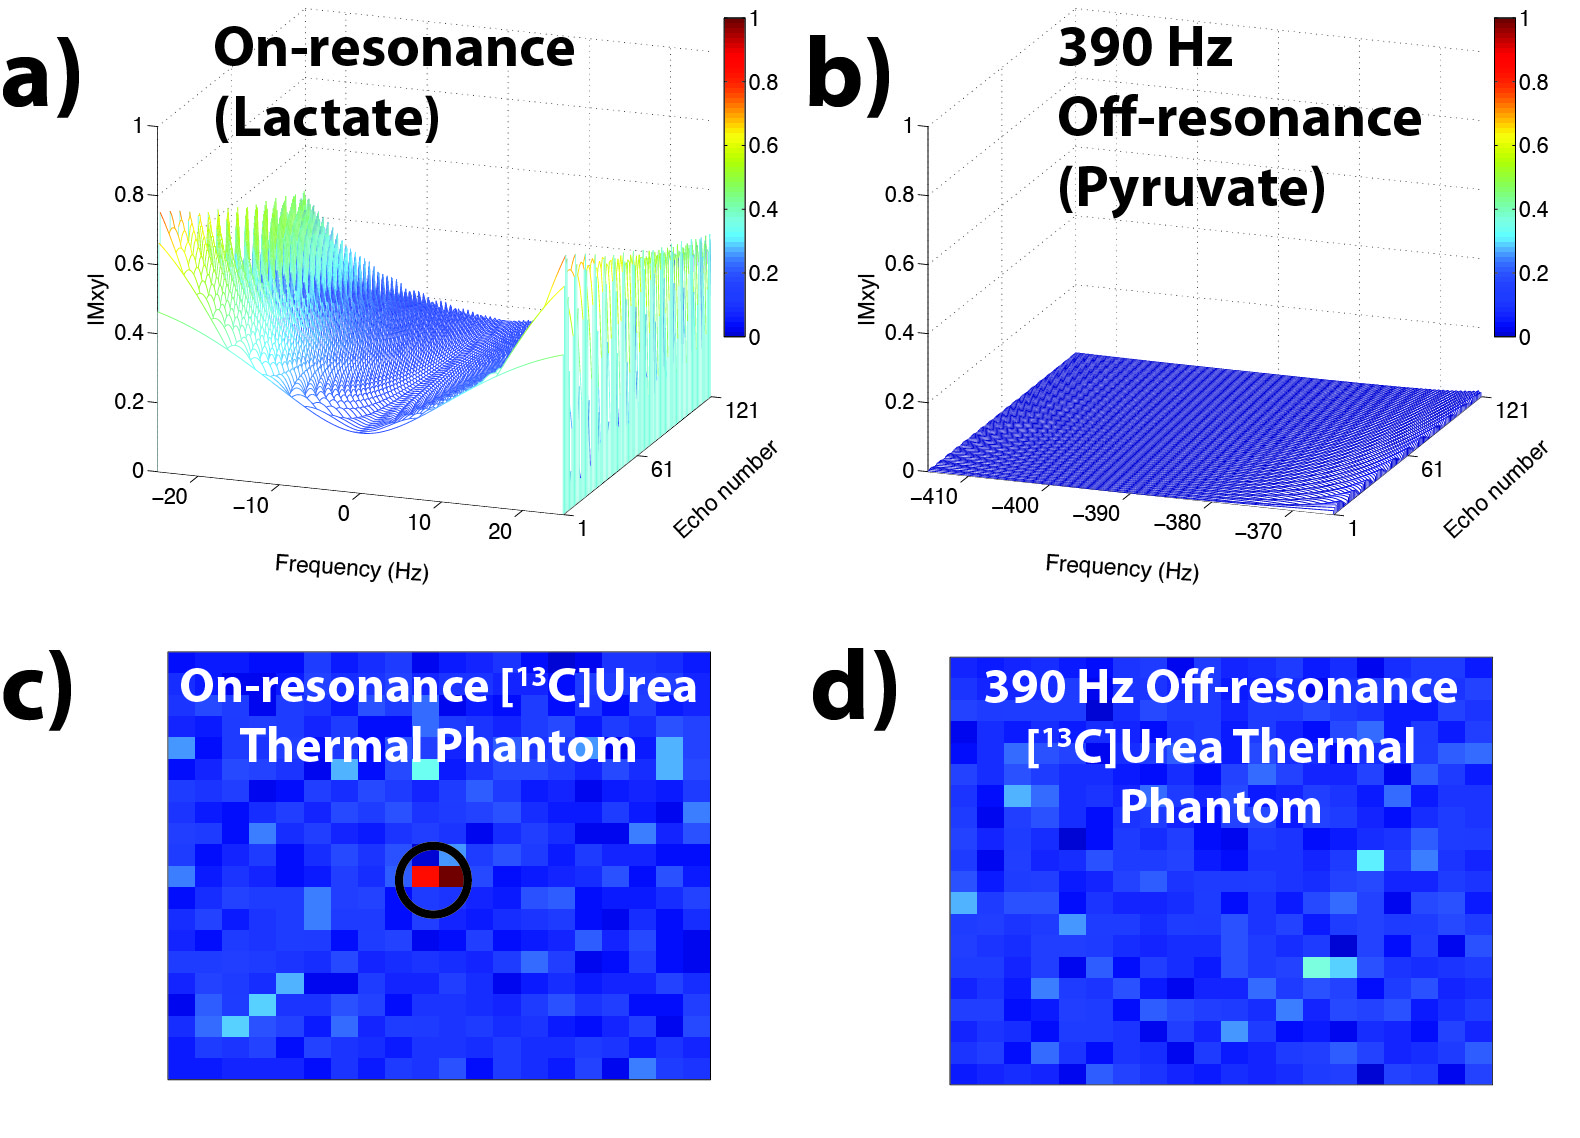
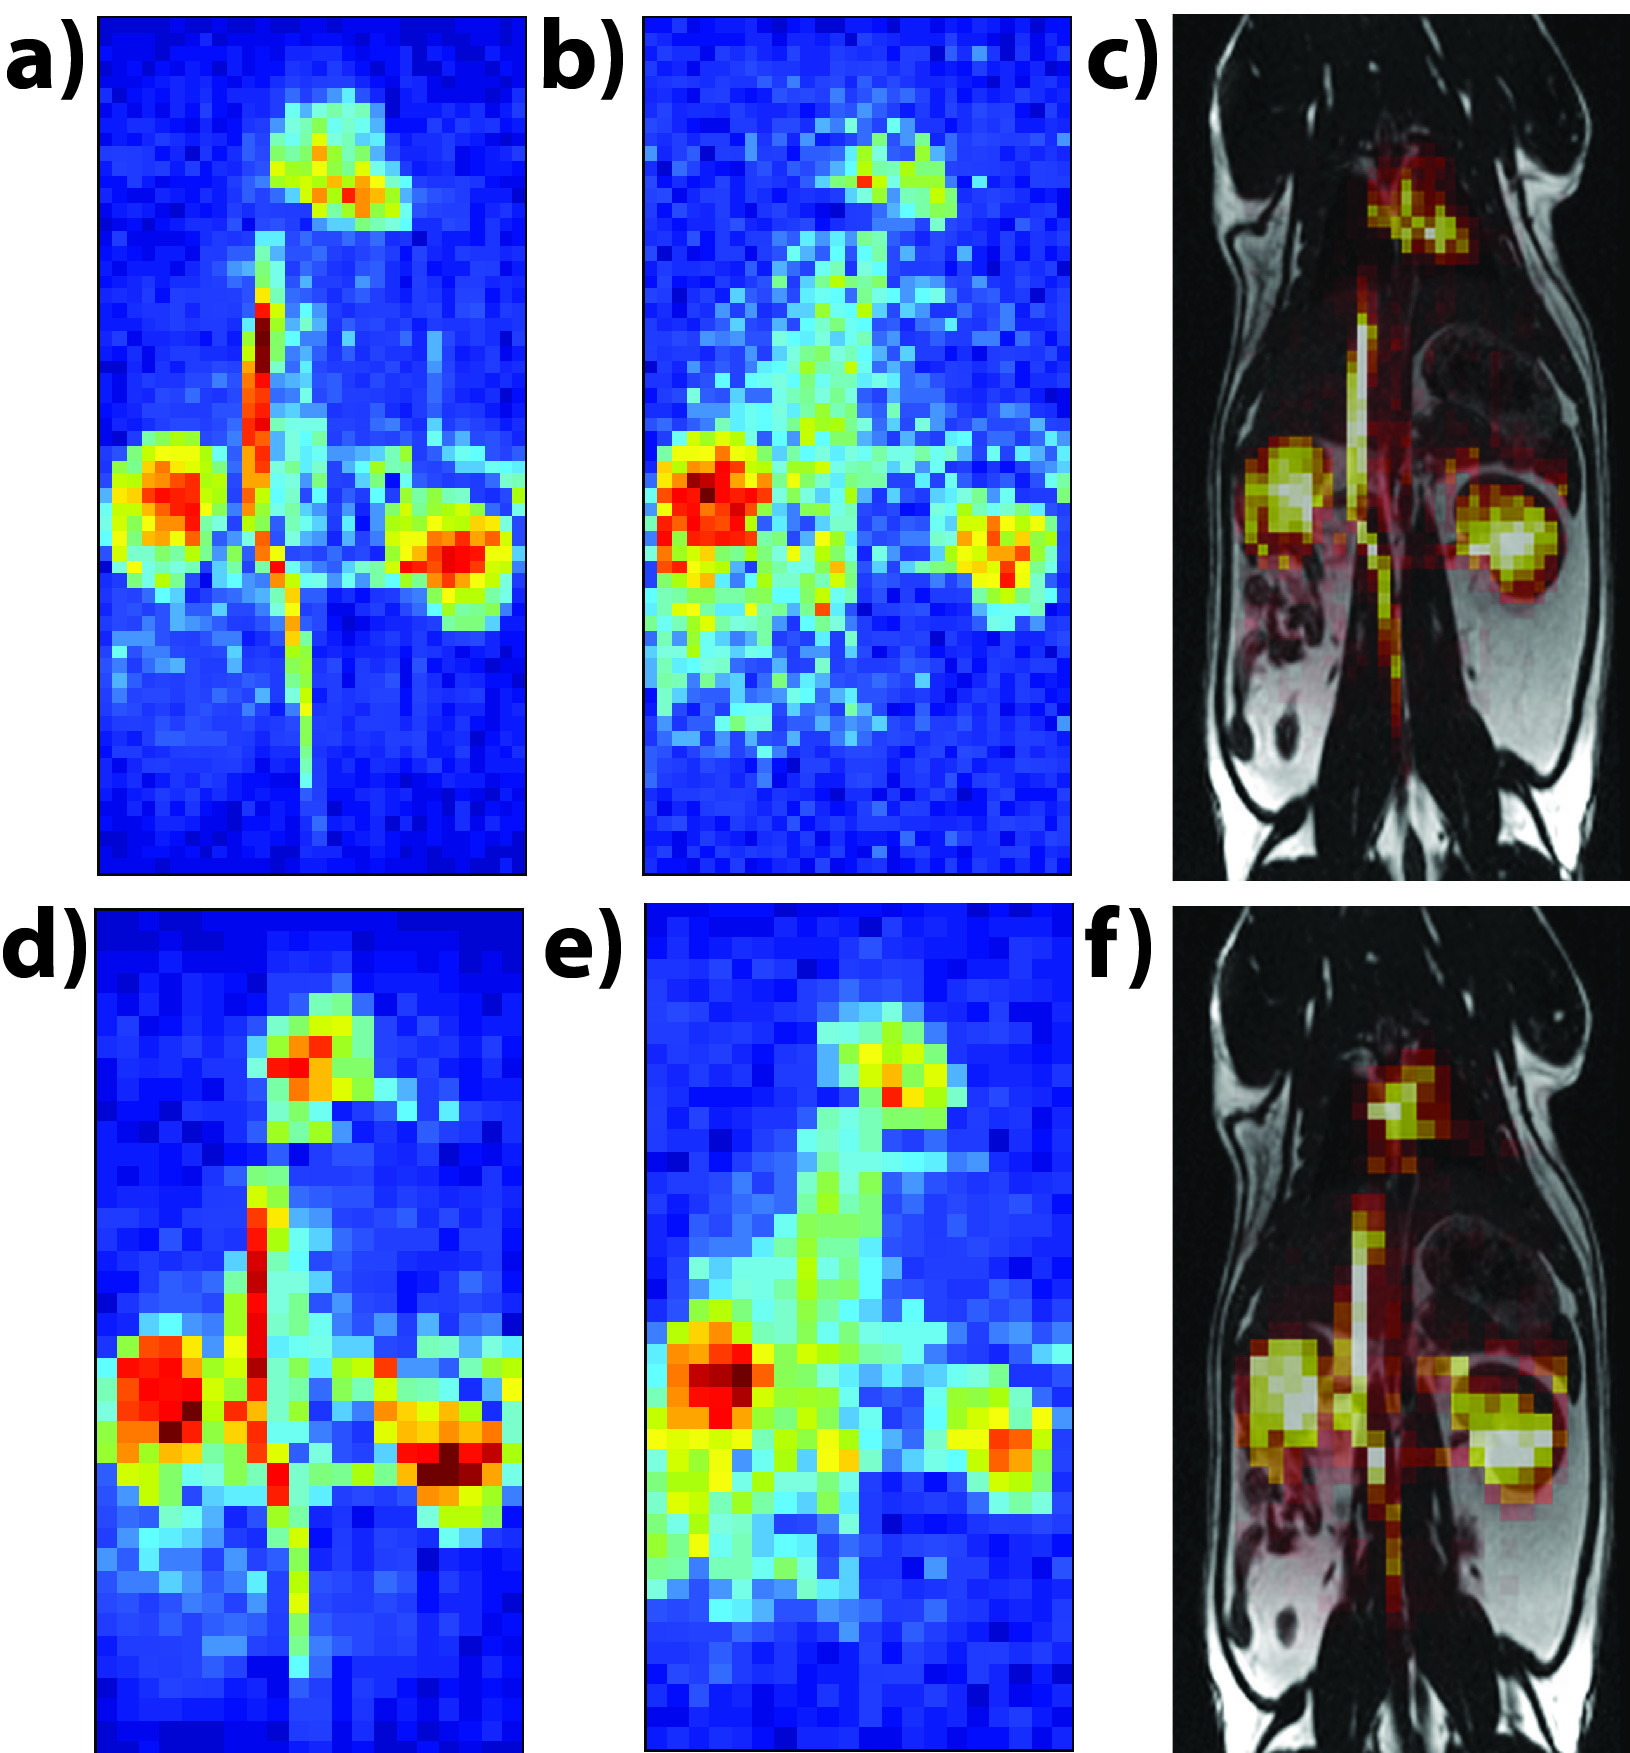
Subsequent bSSFP imaging, acquired as a coronal projection, utilized the following parameters: 12x6 cm2 FOV, 60x30 matrix size for 2x2 mm2 in-plane resolution (or 40x20 for 3x3 mm2), progressive flip angle scheme, 6 time-points and 5s temporal resolution for each metabolite, three suppression pulses played before each time-point as described above. The RF pulse width and TR/TE were simulated and chosen to selectively excite either pyruvate or lactate, whereby a 6.8ms TBW2 sinc pulse led to a TR/TE of 15.3/7.65ms. An alternating center frequency scheme was utilized, with lactate acquired first, followed by pyruvate 2.5s later. [13C]Urea phantom experiments were acquired for one time-point in a similar manner, with 10x10 mm2 spatial resolution, and alternating between on-resonance and 390Hz off-resonance.
A dynamic 2D CSI sequence was used for comparison of lactate-to-pyruvate ratios and had the following parameters: 8cm FOV, axial 8cm slab, 8x8 matrix size leading to 10x10 mm2 in-plane resolution, 5kHz spectral width, 256 spectral points, TR of 76ms, progressive flip angle scheme, 6 time-points. All data was analyzed in Matlab, except the 2D CSI, which was analyzed in SIVIC.9 The experiments were conducted on a 3T MR scanner and DNP experiments used a HyperSense polarizer. All scans started at 20s after beginning of injection and 3mL of 80mM [1-13C]pyruvate was injected over 12s via tail vein catheters in six different rats.
Results and Discussion
As seen in the phantom results, the spectral suppression pulse showed no effect on resonances 100+Hz away (Fig. 1). Within the kidneys and liver, the pulse was able to successfully suppress both alanine and pyruvate-hydrate without having an effect on the lactate or pyruvate resonances (Fig. 2). Calculations of lactate-to-pyruvate ratios from the integration of summed spectra and calculations of kpl showed no statistically significant difference between spectral suppression and no spectral suppression in either kidney (p=0.499, p=0.416) or liver (p=0.400, p=0.057), indicating no significant effect on quantitative analysis.
Simulations and phantom tests demonstrated individual selectivity of pyruvate and lactate with the bSSFP sequence after spectral suppression (Fig. 3). While part a shows the drawback to having a long TR with the bSSFP sequence, the pulse width and TR used here can be shortened by a factor of 2-3 using an optimally designed RF spectrally selective pulse,7 which also has improved off-resonance insensitivity. Figure 4 shows successful acquisition of each metabolite at both 2x2 mm2 and 3x3 mm2, while Figure 5 indicates correlation in dynamic lactate-to-pyruvate ratios between the bSSFP acquisitions and the 2D CSI acquisitions.
Conclusion
The ability to acquire spectrally selective high resolution dynamic images of [1-13C]pyruvate and its conversion to [1-13C]lactate at 3T via the bSSFP sequence was demonstrated in this project. Spectral suppression showed no effects on quantitative analysis and successfully reduced the imaging problem to a simpler, two-peak system. Further optimization of the bSSFP sequence should enable increased SNR and higher resolution, and ultimately translation to clinical imaging.Acknowledgements
The authors would like to thank Dr. Robert Bok, Mark Van Criekinge, Lucas Carvajal, Dr. Irene Marco-Rius, Dr. Peter J. Shin, and Hsin-Yu Chen, for all their help and funding from the NIH (P41EB013598 and R01EB017449).References
1. Kurhanewicz, J. et al. Analysis of cancer metabolism by imaging hyperpolarized nuclei: prospects for translation to clinical research. Neoplasia 13, 81–97 (2011).
2. Larson, P. E. Z. et al. Investigation of tumor hyperpolarized [1-13C]-pyruvate dynamics using time-resolved multiband RF excitation echo-planar MRSI. Magn. Reson. Med. 63, 582–591 (2010).
3. Gordon, J. W., Niles, D. J., Fain, S. B. & Johnson, K. M. Joint spatial-spectral reconstruction and k-t spirals for accelerated 2D spatial/1D spectral imaging of 13C dynamics. Magn. Reson. Med. 71, 1435–1445 (2014).
4. Gordon, J. W., Vigneron, D. B. & Larson, P. E. Z. Development of a Symmetric Echo Planar Imaging Framework for Clinical Translation of Rapid Dynamic Hyperpolarized 13C Imaging. Magn. Reson. Med. 1–7 (2016). doi:10.1002/mrm.26123
5. Scheffler, K. & Lehnhardt, S. Principles and applications of balanced SSFP techniques. Eur. Radiol. 13, 2409–2418 (2003).
6. Larson, P. E. Z., Kerr, A. B., Leon, C., Pauly, J. M. & Vigneron, D. B. A rapid method for direct detection of metabolic conversion and magnetization exchange with application to hyperpolarized substrates. J. Magn. Reson. 225, 71–80 (2012).
7. Shang, H. et al. Spectrally Selective Three-Dimensional Dynamic Balanced Steady-State Free Precession for Hyperpolarized C-13 Metabolic Imaging With Spectrally Selective Radiofrequency Pulses. Magn. Reson. Med. (2016). doi:10.1002/mrm.26480
8. Xing, Y., Reed, G. D., Pauly, J. M., Kerr, A. B. & Larson, P. E. Z. Optimal variable flip angle schemes for dynamic acquisition of exchanging hyperpolarized substrates. J. Magn. Reson. 234, 75–81 (2013).
9. Crane, J. C., Olson, M. P. & Nelson, S. J. SIVIC: Open-Source , Standards-Based Software for DICOM MR Spectroscopy Workflows. Int. J. Biomed. Imaging 2013, (2013).
Figures