3691
Echo Planar Spectroscopic Imaging of Hyperpolarized 13C in a Clinical System with Reduced Chemical Shift Artifacts1Center for Hyperpolarization in Magnetic Resonance, DTU Elektro, Technical University of Denmark, Kgs. Lyngby, Denmark, 2Danish Research Center for Magnetic Resonance, Hvidovre Hospital, Hivdovre, Denmark, 3Department of Neurology, University of New Mexico, Albuquerque, NM, United States, 4Department of Physics and Astronomy, University of New Mexico, Albuquerque, United States, 5Department of Electrical and Computer Engineering, University of New Mexico, Albuquerque, United States, 6Department of Clinical Physiology, Nuclear Medicine and PET, Rigshospitalet, Copenhagen, Denmark
Synopsis
Fast and robust symmetric echo planar spectroscopic imaging sequence for hyperpolarized 13C in a clinical system is presented. The sequence employs a reconstruction algorithm that re-grids the sampled data in the spatio-temporal frequency space to compensate for the chemical shift artifacts and achieve an improved reconstruction within a limited bandwidth. The sequence was tested on a clinical 3 T whole body scanner using dedicated 13C coils and was compared with the conventional chemical shift imaging. Good tradeoff between speed, efficiency and SNR was achieved and the reconstruction was superior compared to the commonly used FFT reconstruction.
Purpose
Echo Planar Spectroscopic Imaging 1,2 (EPSI) is becoming a routine protocol to achieve dynamic imaging of metabolism in cancer 3 and cardiac 4 studies with hyperpolarized [1-13C]pyruvate. The image reconstruction in EPSI is often done using FFT, thus ignoring that the data in k-t space are not collected on a Cartesian grid. We implemented a fast and robust 13C EPSI sequence with a reconstruction algorithm that reduces broadening from chemical shifts within a limited bandwidth. The presented sequence is compared with the conventional phase encoded chemical shift imaging.Method
The phantom experiment was performed in a mMR biograph scanner (Siemens Healthcare, Erlangen). The 13C images were acquired using a 270 mm diameter birdcage 13C head coil (RAPID Biomedical). A cylindrical ethylene glycol phantom with a diameter of 250 mm and height of 200 mm was used. It has three cylindrical compartments each with inner diameter of 19 mm filled with 1 M 13C-bicarbonate, [1-13C]acetate, and 13C-urea, respectively.
The CSI-FID reference data and the EPSI data were acquired with TR 1000 ms, acquisition delay 2.3 ms, field of view 100 x 100 mm2, spatial matrix size 16x16, tip angle 90 degrees, and slice thickness of 100 mm. The CSI had a spectral bandwidth of 5000 Hz and 512 spectral points. The EPSI had a spectral bandwidth of 495 Hz and 64 spectral points. 16 averages were acquired for EPSI.
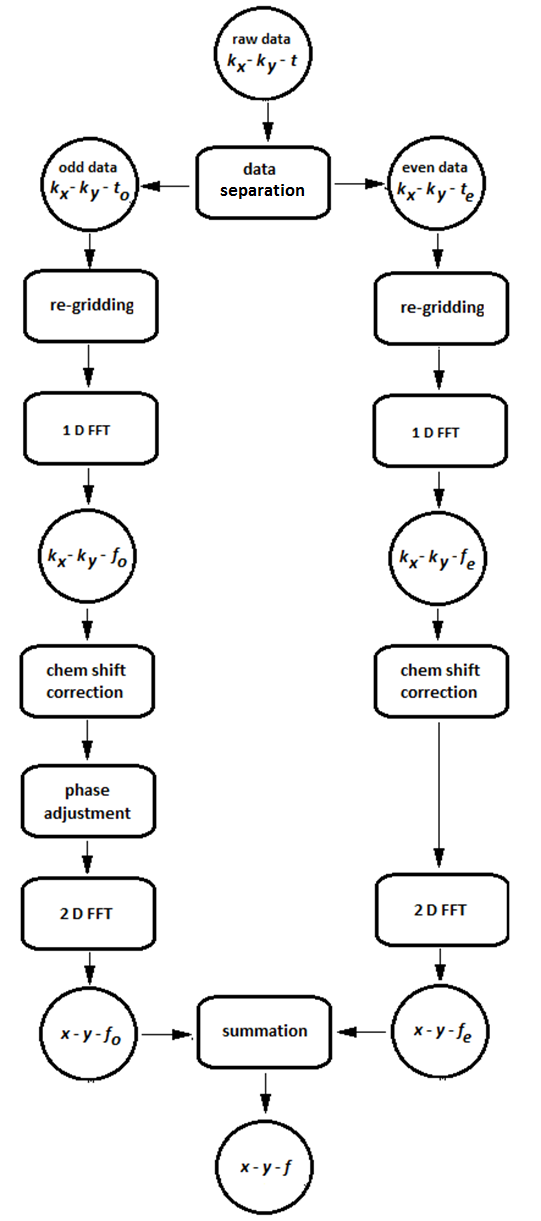
The EPSI data were reconstructed, Figure 1, by first applying re-gridding to compensate the uneven k-space sampling over the ramp. Then, the odd and even echoes were separated into two data arrays. Fourier transform was applied on the two data sets along the time domain to obtain two kx-ky-f arrays. Before applying the spatial Fourier transform, a linear phase correction was introduced along kx 5 to account for the time evolution when sampling along kx which results in chemical shift displacement in the spatial domain, differing between even and odd numbered echoes. This essentially regrids the data in the spectral-spatial domain. After introducing the phase correction, 2D Fourier transform was applied to obtain odd and even x-y-f arrays. The data corresponding to odd and even echoes were finally summed to obtain a spectroscopic image.
Results
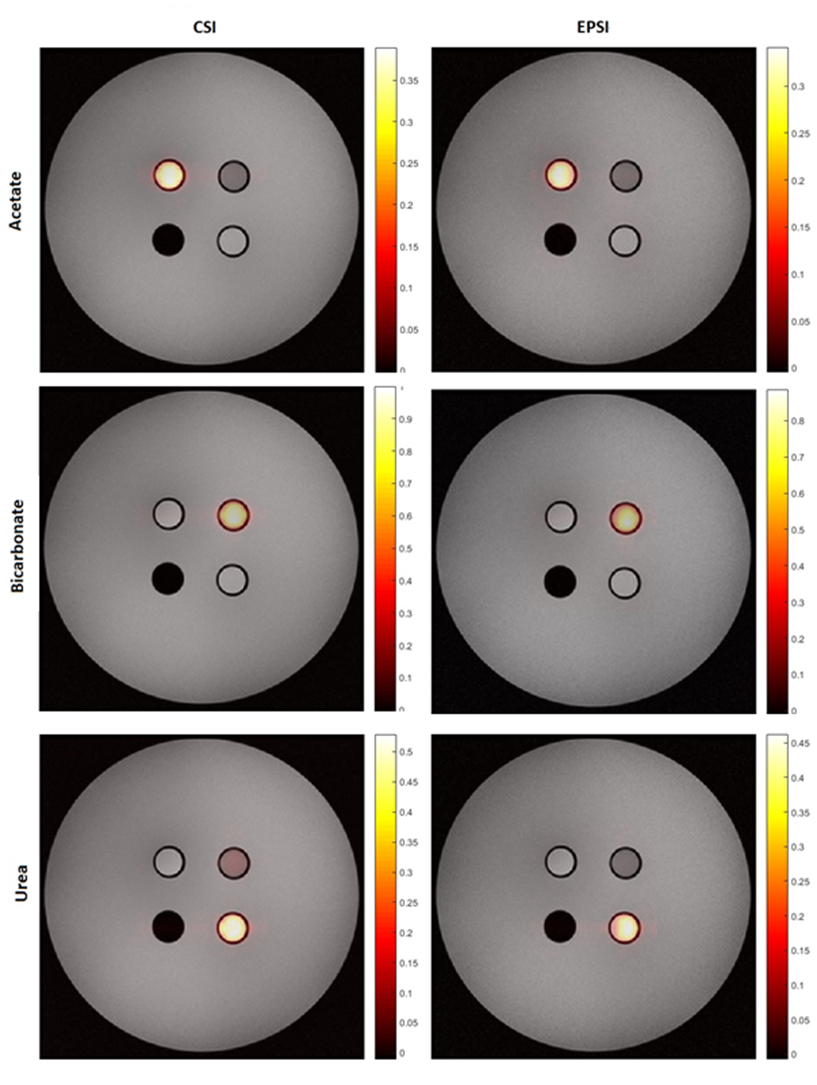
Figure 2 shows the signal for the three substrates 13C-Urea, 13C-bicarbonate and [1-13C]Acetate obtained with CSI and EPSI and superimposed on the proton image. The relative SNR values obtained with EPSI-FID with respect to CSI were 0.89, 0.87, and 0.88, consistent with the ramp sampling related decrease in sampling efficiency 6. SNR was measured from regions of interest that encompass the cylindrical compartments.
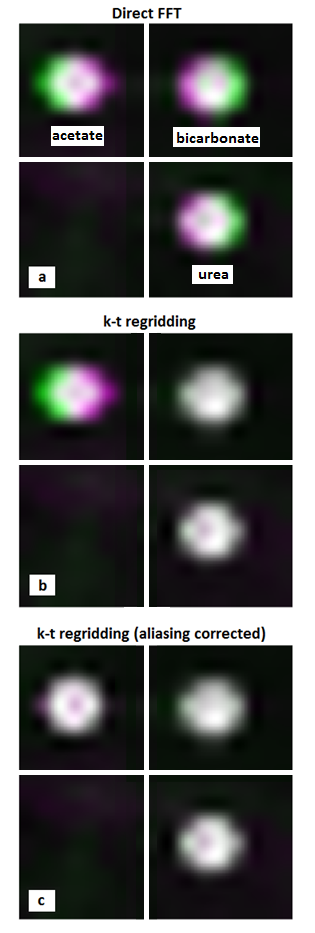
Figure 3 shows the comparison between EPSI reconstruction algorithms. Direct FFT reconstruction, Figure 3-a, results in spatial blurring of the substrates in the 13C image due to chemical shifts in opposite directions. On the other hand, spectral-spatial regridding using the apparent frequency positions, Figure 3-b, results in narrower and more accurate spatial representation of 13C-urea and 13C-bicarbonate. [1-13C]Acetate, however, was outside of the critically sampled bandwidth and aliased, which resulted in increased spatial broadening. When accounting for aliasing by using the actual frequency offset of the non-aliased peak, the chemical shift displacement of [1-13C]acetate was compensated as well, Figure 3-c.
Discussion
The reconstruction 5 employed in this work provides better accuracy compared to direct FFT. However, the bandwidth in EPSI is relatively small and aliasing may occur. Aliased metabolites cause an error in the spatial-spectral regridding. However, the 13C spectrum in hyperpolarization experiments is often sparse and the metabolite frequencies known a priori. The problem can therefore be solved if peaks do not overlap in the aliased spectra by simply applying phase ramps corresponding to spatial shifts of non-aliased peak frequencies.Conclusion
An implementation of an EPSI sequence in a clinical system was presented with reconstruction that gives more accurate representation of the data. EPSI provided a good tradeoff between encoding speed and efficiency, and SNR.Acknowledgements
We acknowledge the financial support from the Danish Research Council (Grant Number 1331-00259A) and the Danish National Research Foundation (Grant Number DNRF124). The Mind Research Network is also gratefully acknowledged for providing their facilities to conduct the initial experiments.References
1. Posse S, DeCarli C, Le Bihan D. Three-dimensional echo-planar MR spectroscopic imaging at short echo times in the human brain. Radiology. 1994;192(3):733-738.
2. Posse S, Otazo R, Caprihan A, et al. Proton echo-planar spectroscopic imaging of J-coupled resonances in human brain at 3 and 4 Tesla. Magn Reson Med. 2007;58(2):236-244.
3. Nelson SJ, Kurhanewicz J, Vigneron DB, et al. Metabolic imaging of patients with prostate cancer using hyperpolarized [1-13C]pyruvate. Sci Transl Med. 2013;5(198):198-108.
4. Cunningham CH, Lau JY, Chen AP, et al. Hyperpolarized 13C Metabolic MRI of the Human Heart: Initial Experience. Circ Res. 2016:CIRCRESAHA--116.
5. Hanson LG, Schaumburg K, Paulson OB. Reconstruction strategy for echo planar spectroscopy and its application to partially undersampled imaging. Magn Reson Med. 2000;44(3):412-417.
6. Durst M, Koellisch U, Frank A, et al. Comparison of acquisition schemes for hyperpolarised 13C imaging. NMR Biomed. 2015;28(6):715-725.
Figures