3689
Improved Off-Resonance Robustness for Spectral-Spatial Excitation and Echo-Planar Imaging of Hyperpolarized [1-13C]Pyruvate and Metabolites1Physical Sciences, Sunnybrook Research Institute, Toronto, ON, Canada, 2Medical Biophysics, University of Toronto, Toronto, ON, Canada, 3GE Healthcare, Toronto, ON, Canada
Synopsis
An interleaved multi-echo imaging sequence is proposed to improve off-resonance robustness for spectral-spatial excitation and echo-planar imaging of hyperpolarized [1-13C]pyruvate. A non-iterative pointwise k-space signal decomposition approach for removing pyruvate hydrate contamination from lactate images is presented. Performance of the sequence and reconstruction pipeline was evaluated using an ethylene glycol phantom and a catalyzing enzyme system. Minimal signal loss and successful removal of pyruvate hydrate contamination were demonstrated in vivo for realistic cases of off-resonance.
Introduction
Hyperpolarized 13C MRI has shown great potential for clinical translation [1,2]. Time-resolved metabolic imaging is preferred for clinical applications because the timing of the bolus arrival and metabolic conversion are unknown a priori. Spectral-spatial excitation followed by an efficient (echo-planar or spiral) k-space trajectory offers an attractive approach for time-resolved 3D 13C imaging with sufficient temporal resolution. However, the narrow RF spectral passbands required to excite only one resonance at a time poses a trade-off between off-resonance tolerance and potential signal contamination from nearby resonances. Furthermore, nonuniform and incomplete excitation of magnetization due to B0 inhomogeneity and/or incorrect centre frequency settings can result in loss of signal that cannot be recovered retrospectively. Such losses of potentially usable signal must be avoided in patient studies.
In this abstract, tolerance to off-resonance in echo-planar imaging (EPI) of hyperpolarized [1-13C]pyruvate and its metabolic products was improved by widening the frequency passband of the spectral-spatial excitation, and encoding the resulting contamination of the lactate images using an interleaved multi-echo approach. Following from previous work in which multiple 13C resonances were resolved using iterative reconstruction techniques [3,4], a non-iterative pointwise k-space decomposition of pyruvate hydrate and lactate signals was implemented in conjunction with distortion correction.
Methods
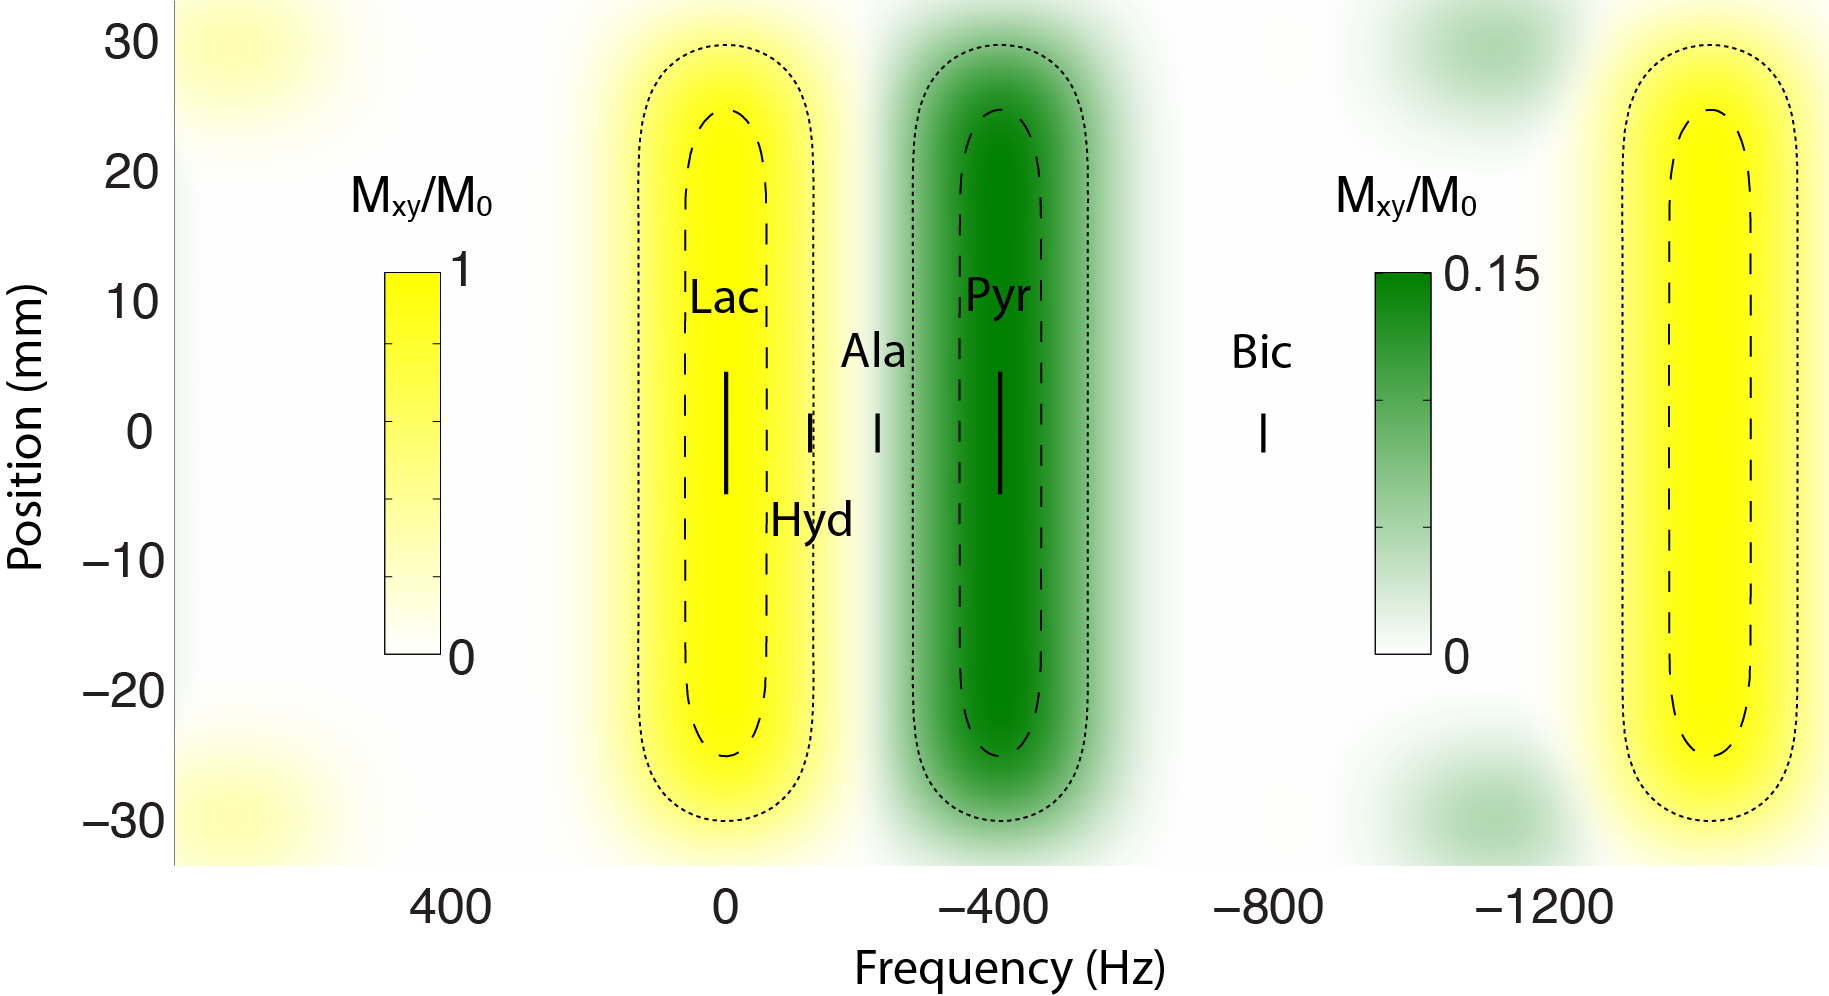
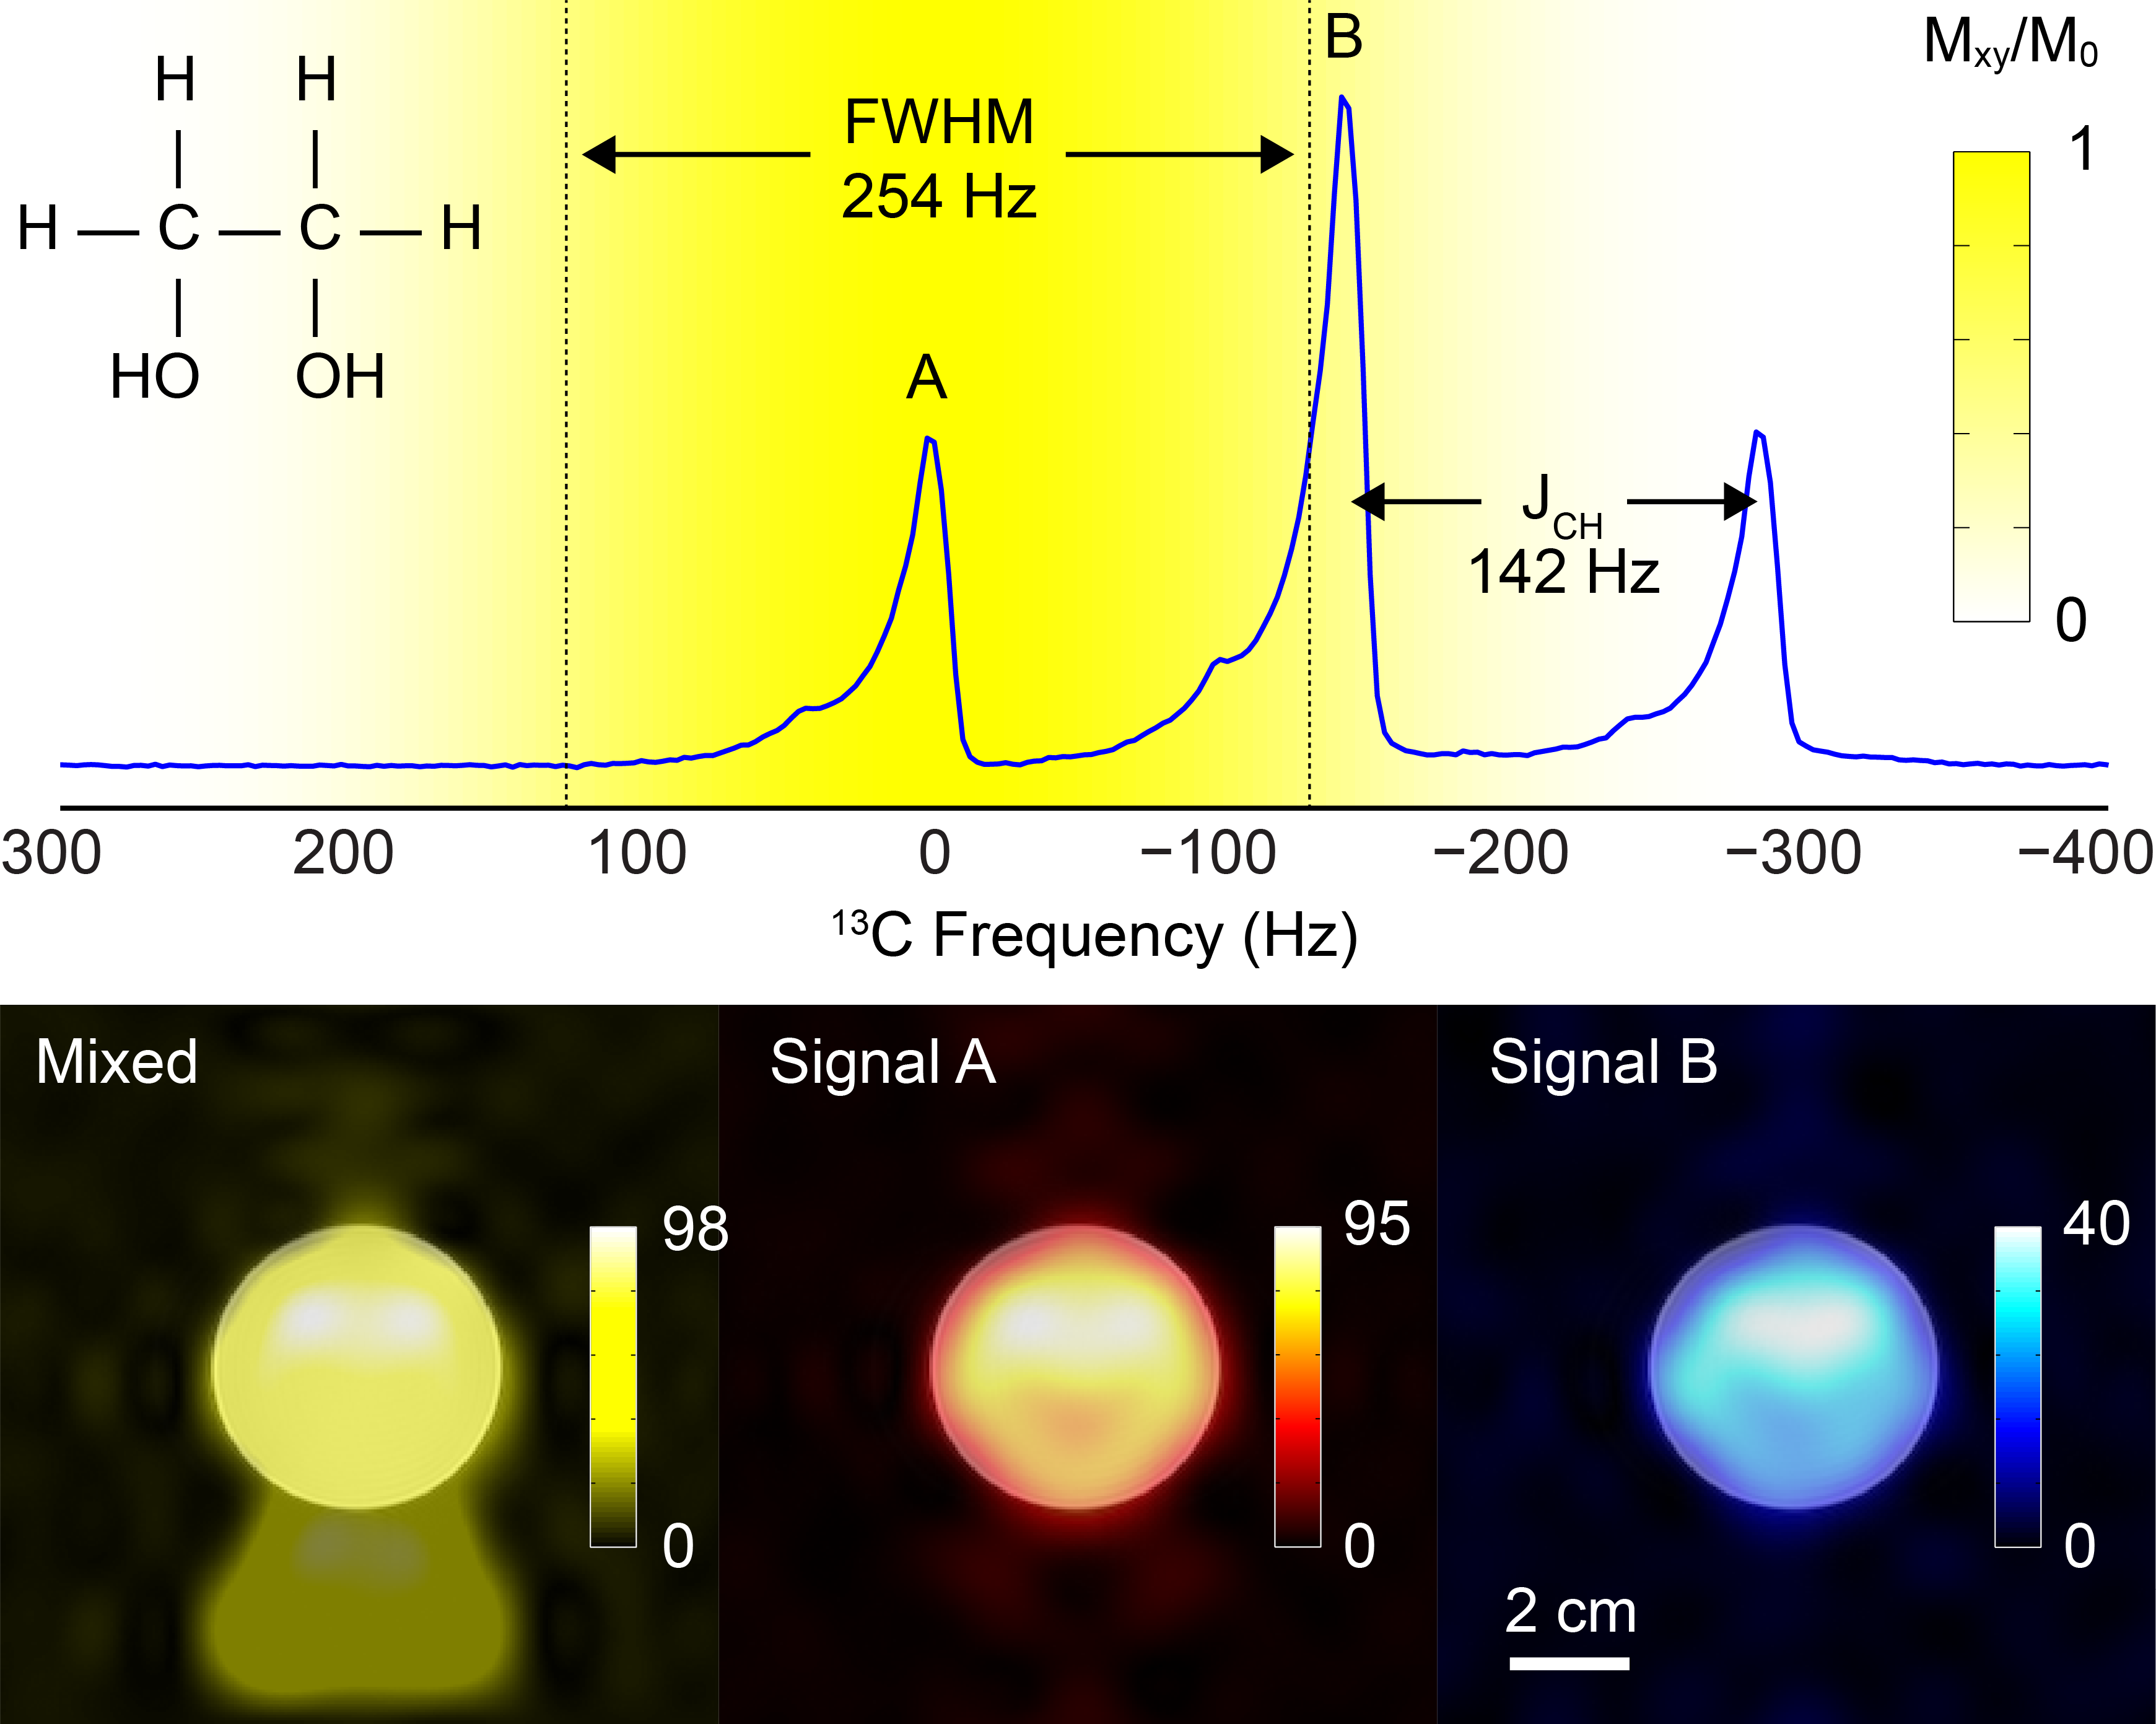
Pulse sequence: An 8.9 ms spectral-spatial pulse was designed with spectral passbands of 254 Hz full width at half maximum (FWHM), as shown in Figure 1. Within each repetition time of 5 s, three volumes were excited consecutively near the lactate frequency with echo time differences of 2.732 ms and a combined 80° net flip angle, followed by a single volume near the pyruvate frequency with an 8° net flip angle. Spatial encoding was performed using a dual-echo echo-planar trajectory [5]. A fully phase-encoded proton reference scan was acquired using the same readout gradient waveforms for EPI distortion correction [6]. Performance was validated using an ethylene glycol phantom (0.4 M natural abundance 13C) with 1:2:1 triplet resonance lines (JCH = 142 Hz).
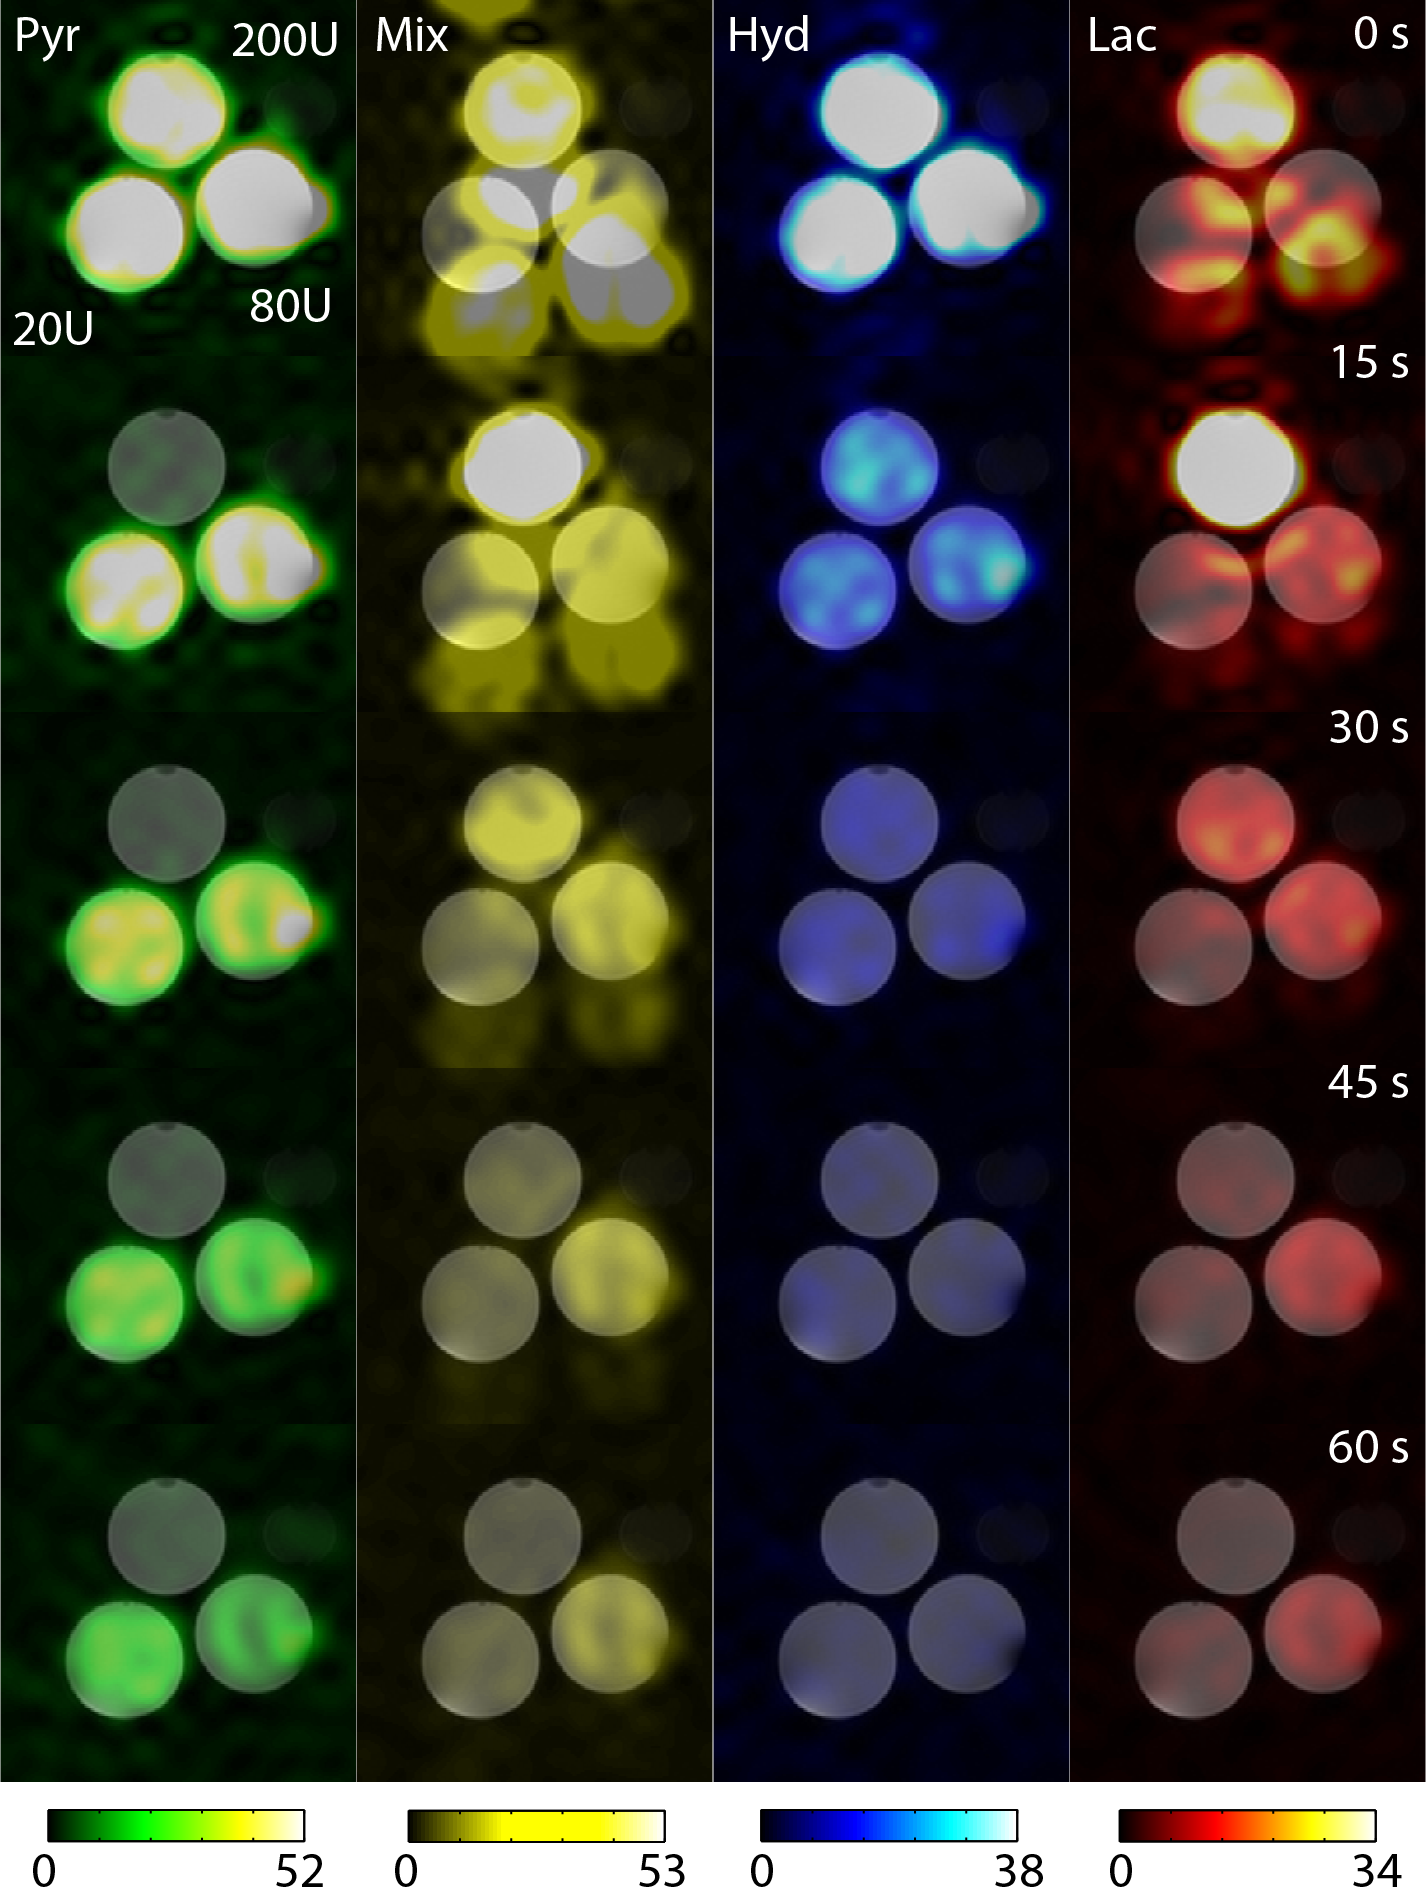
In vitro validation: A reproducible catalyzing phantom [7] was chosen to demonstrate time-resolved imaging capabilities. Three syringes containing 6.25 mM reduced nicotinamide adenine dinucleotide (NADH) and lactate dehydrogenase (LDH) activities of 800 U, 80 U, and 20 U in 16 mL of 12.5 mM Tris pH 7.2 were prepared. A three-way connector was used to inject 4 mL of 20 mM pre-polarized [1-13C]pyruvate in 350 mM Tris buffer into each syringe over 2 s. Imaging commenced simultaneously with the injection.
In vivo demonstration: A 300 g Sprague-Dawley rat was injected twice with 2.5 mL of 80 mM pre-polarized [1-13C]pyruvate over 12 s. Imaging began at the start of each injection. The centre frequency was intentionally prescribed 50 Hz off-resonance in the second experiment to demonstrate robustness to incorrect frequency prescription.
Results
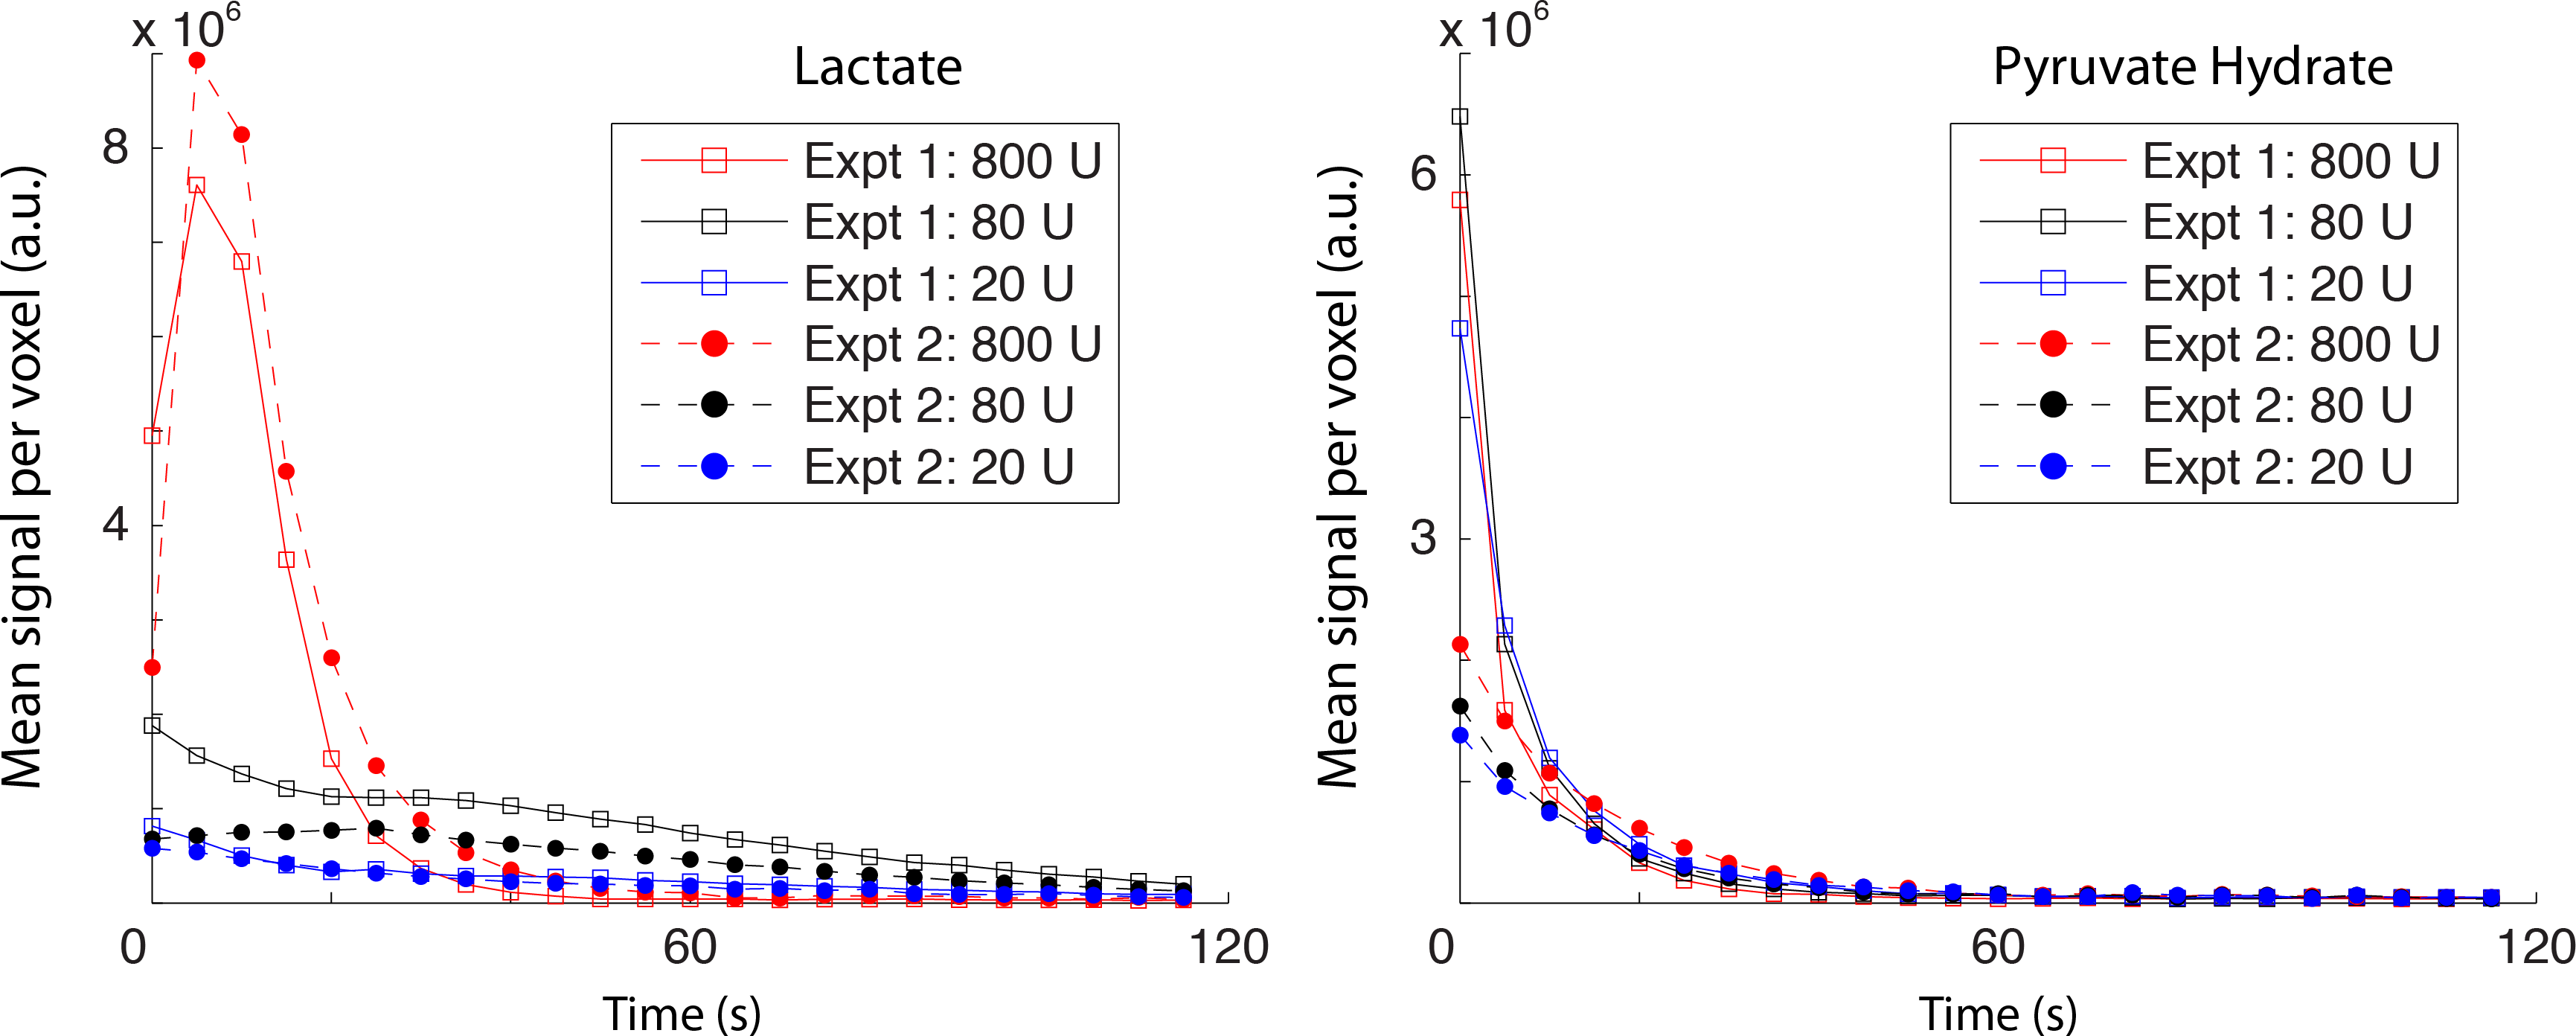
Complete separation of the two excited resonances of ethylene glycol is demonstrated in Figure 2. As an extension of the single time point imaging presented by Walker et al. [7], a series of representative time-resolved images of three syringes with different LDH activities is shown in Figure 3. Separation was suboptimal for time points within the injection period. Dynamic curves showing the mean signal per voxel in each of the three catalyzing syringes are shown in Figure 4.
Representative in vivo images of the rat kidney are shown in Figure 5. Good separation between the pyruvate hydrate and lactate signals was achieved for both mild and severe cases of off-resonance.
Discussion
The wider spectral passband offers greater frequency tolerance with respect to signal loss, with less than 10% loss at 50 Hz off-resonance and less than 33% loss at 100 Hz off-resonance. The risk of image shading due to poor shim is also reduced. Furthermore, the shorter pulse alone gives an 18% gain in SNR (assuming T2* ≈ 30 ms) compared to the 18.8 ms pulse used in our previous work [8].
One major advantage of spectral-spatial excitation is the independent control over lactate and pyruvate flip angles. As shown in Figure 1, the pyruvate interleaf also excites alanine, but the small flip angle used for this interleaf results in negligible signal contamination from alanine, which is typically much smaller than the substrate signal. On the other hand, the lactate interleaf excites pyruvate hydrate, resulting in a simple two-signal decomposition problem.
Conclusions
The off-resonance robustness of this 13C data acquisition pipeline was demonstrated in vitro and in vivo. The improved tolerance to incorrect frequency prescription and pyruvate hydrate contamination will be greatly appreciated as we move further towards translation of this imaging paradigm into human clinical studies.Acknowledgements
The authors thank Jennifer Barry for assistance with animal experiments. JYC Lau would like to thank Dr. Stuart Foster for the Geoff Lockwood and Kevin Graham Medical Biophysics Graduate Award.References
[1] Nelson SJ, Kurhanewicz J, Vigneron DB, Larson PE, Harzstark AL, Ferrone M, van Criekinge M, Chang JW, Bok R, Park I, Reed G, Carvajal L, Small EJ, Munster P, Weinberg VK, Ardenkjaer-Larsen JH, Chen AP, Hurd RE, Odegardstuen L-I, Robb FJ, Tropp J, Murray JA. Metabolic Imaging of Patients with Prostate Cancer Using Hyperpolarized [1-13C]Pyruvate. Science Translational Medicine. 2013 Aug 14;5(198):198ra108.
[2] Cunningham CH, Lau JY, Chen AP, Geraghty BJ, Perks WJ, Roifman I, Wright GA, Connelly KA. Hyperpolarized 13C Metabolic MRI of the Human Heart: Initial Experience. Circulation Research. 2016 Sep 15:CIRCRESAHA-116.
[3] Reeder SB, Brittain JH, Grist TM, Yen YF. Least-Squares Chemical Shift Separation for 13C Metabolic Imaging. Journal of Magnetic Resonance Imaging. 2007 Oct 1;26(4):1145-52.
[4] Wiesinger F, Weidl E, Menzel MI, Janich MA, Khegai O, Glaser SJ, Haase A, Schwaiger M, Schulte RF. IDEAL Spiral CSI for Dynamic Metabolic MR Imaging of Hyperpolarized [1-13C]Pyruvate. Magnetic Resonance in Medicine. 2012 Jul 1;68(1):8-16.
[5] Geraghty BJ, Chen AP, Cunningham CH. Dual-Echo EPI Sequence for Integrated Distortion Correction in 3D Time-Resolved Hyperpolarized 13C MRI. Proceedings of the 24th Annual Meeting of ISMRM, Singapore, 2016.
[6] Chen NK, Wyrwicz AM. Correction for EPI distortions using multi-echo gradient-echo imaging. Magnetic Resonance in Medicine. 1999 Jun 1;41(6):1206-13.
[7] Walker CM, Lee J, Ramirez MS, Schellingerhout D, Millward S, Bankson JA. A Catalyzing Phantom for Reproducible Dynamic Conversion of Hyperpolarized [1-13C]-Pyruvate. PloS ONE. 2013 Aug 15;8(8):e71274.
[8] Lau JY, Chen AP, Gu YP, Cunningham CH. Voxel-by-voxel correlations of perfusion, substrate, and metabolite signals in dynamic hyperpolarized 13C imaging. NMR in Biomedicine. 2016 Aug 1;29(8):1038-47.
Figures