3688
Slice Selective Adiabatic Refocusing Pulses for High Field, Pre-Clinical Hyperpolarized C-13 Imaging1Bioengineering, UCSF, Albany, CA, United States, 2Radiology & Biomedical Imaging, University of California - San Francisco, CA, United States
Synopsis
Due to limited transmit coil volume, refocusing pulses spoil magnetization located around the edge of the coil even with adiabatic pulses. This is a major problem for hyperpolarized 13C MRI, as this can destroy precious magnetization. To overcome this drawback, we propose to use a high bandwidth slice-selective adiabatic pulse to replace the original non-selective pulse. We designed and optimized the pulse via simulation. Then the slice-selective double spin echo sequence was tested on both phantom and in vivo studies.
Introduction
MRI with hyperpolarized (HP) 13C substrates is a promising method for non-invasive imaging of metabolism. HP [1-13C] pyruvate has been used in many cancer diagnosis studies because its metabolic conversion into lactate and alanine has been shown to distinguish malignant and indolent tumors [1]. For high-field studies, sampling with T2 rather than T2* may provide increased SNR for HP metabolites that exhibit JCH coupling, such as lactate, would ameliorate signal loss due to the increased susceptibility at high field strength, and would be useful for simultaneous assessment of metabolism and metabolites compartmentalization. A double spin-echo (DSE) sequence using two identical inverse adiabatic pulses can provide these benefits [2]. However, for many applications, the transmit coil is smaller than the patient or object being imaged. In this fringe field region, the refocusing pulse would act as an excitation pulse, destroying magnetization in that region [3]. Adding a slice-selective gradient during the adiabatic refocusing pulse would eliminate magnetization loss at the edge of the coil, but may exacerbate slice profile effects [4] or or may result in unwanted sensitivity to motion. In this work, we simulated and optimized the slice selective adiabatic pulse for hyperpolarized dynamic imaging, and tested the sequence on both phantom and in vivo studies.Methods
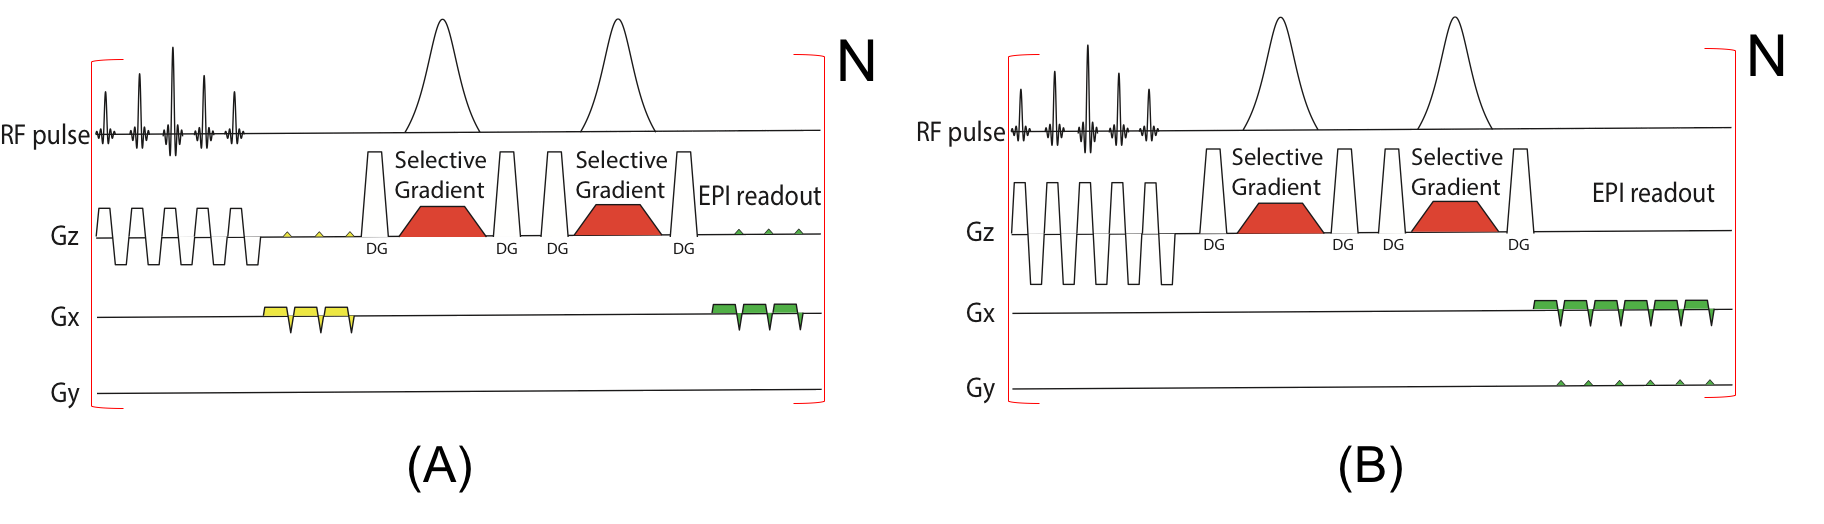
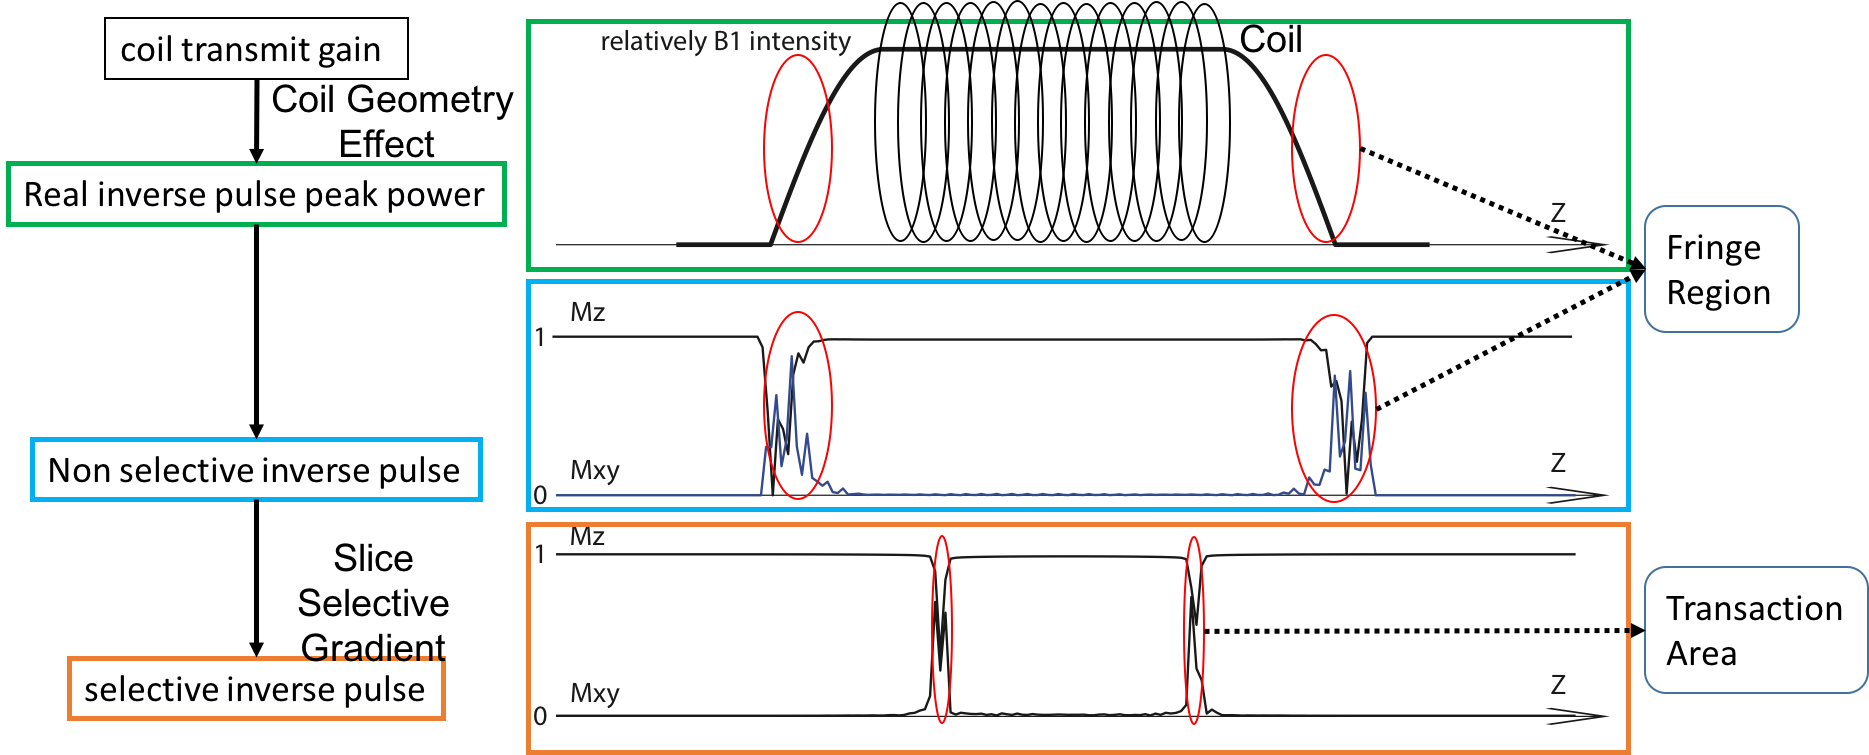
The slice-selective DSE (ss-DSE) sequences in this work are shown in Figure 1. In the sequence, the slice selective adiabatic pulse design should fulfill some specific requirements[5]. We designed a 9kHz bandwidth pulse with 15 mm slice selective thickness. The simulation results of comparison between non-selective and slice selective pulse sequence are shown in Figure 2. The optimized selective pulse transition area is much smaller than the fringe field area at the coil edge. For both phantom and in vivo study, the HP samples were prepared through following steps. 24μL aliquots of [1-13C] pyruvate (Cambridge Isotopes, Cambridge, Massachusetts, USA) were polarized for 60 minutes in a HyperSense polarizer (Oxford Instruments).[6] For phantom study, a syringe containing 5mL of hyperpolarized pyruvate was placed into the scanner. Images from the GRE and DSE acquisition were fit to a mono-exponential decay to quantify the decay rate induced by the adiabatic DSE pulses. For the in vivo study, three different sequences were used: a gradient-echo EPI readout, a DSE EPI readout with frequency selective adiabatic refocusing pulses, and a DSE EPI readout with slice-selective adiabatic refocusing pulses. Imaging started 15s after the start of injection. Pyruvate (θ = 10°) and lactate (θ = 30°) images were acquired every 2s, with an 8 mm thick slice and 2 x 2 mm in-plane resolution. Dynamic pyruvate and lactate data were fit to a mono-exponential decay to quantify the decay rate induced by the adiabatic DSE pulses.Results and Discussion
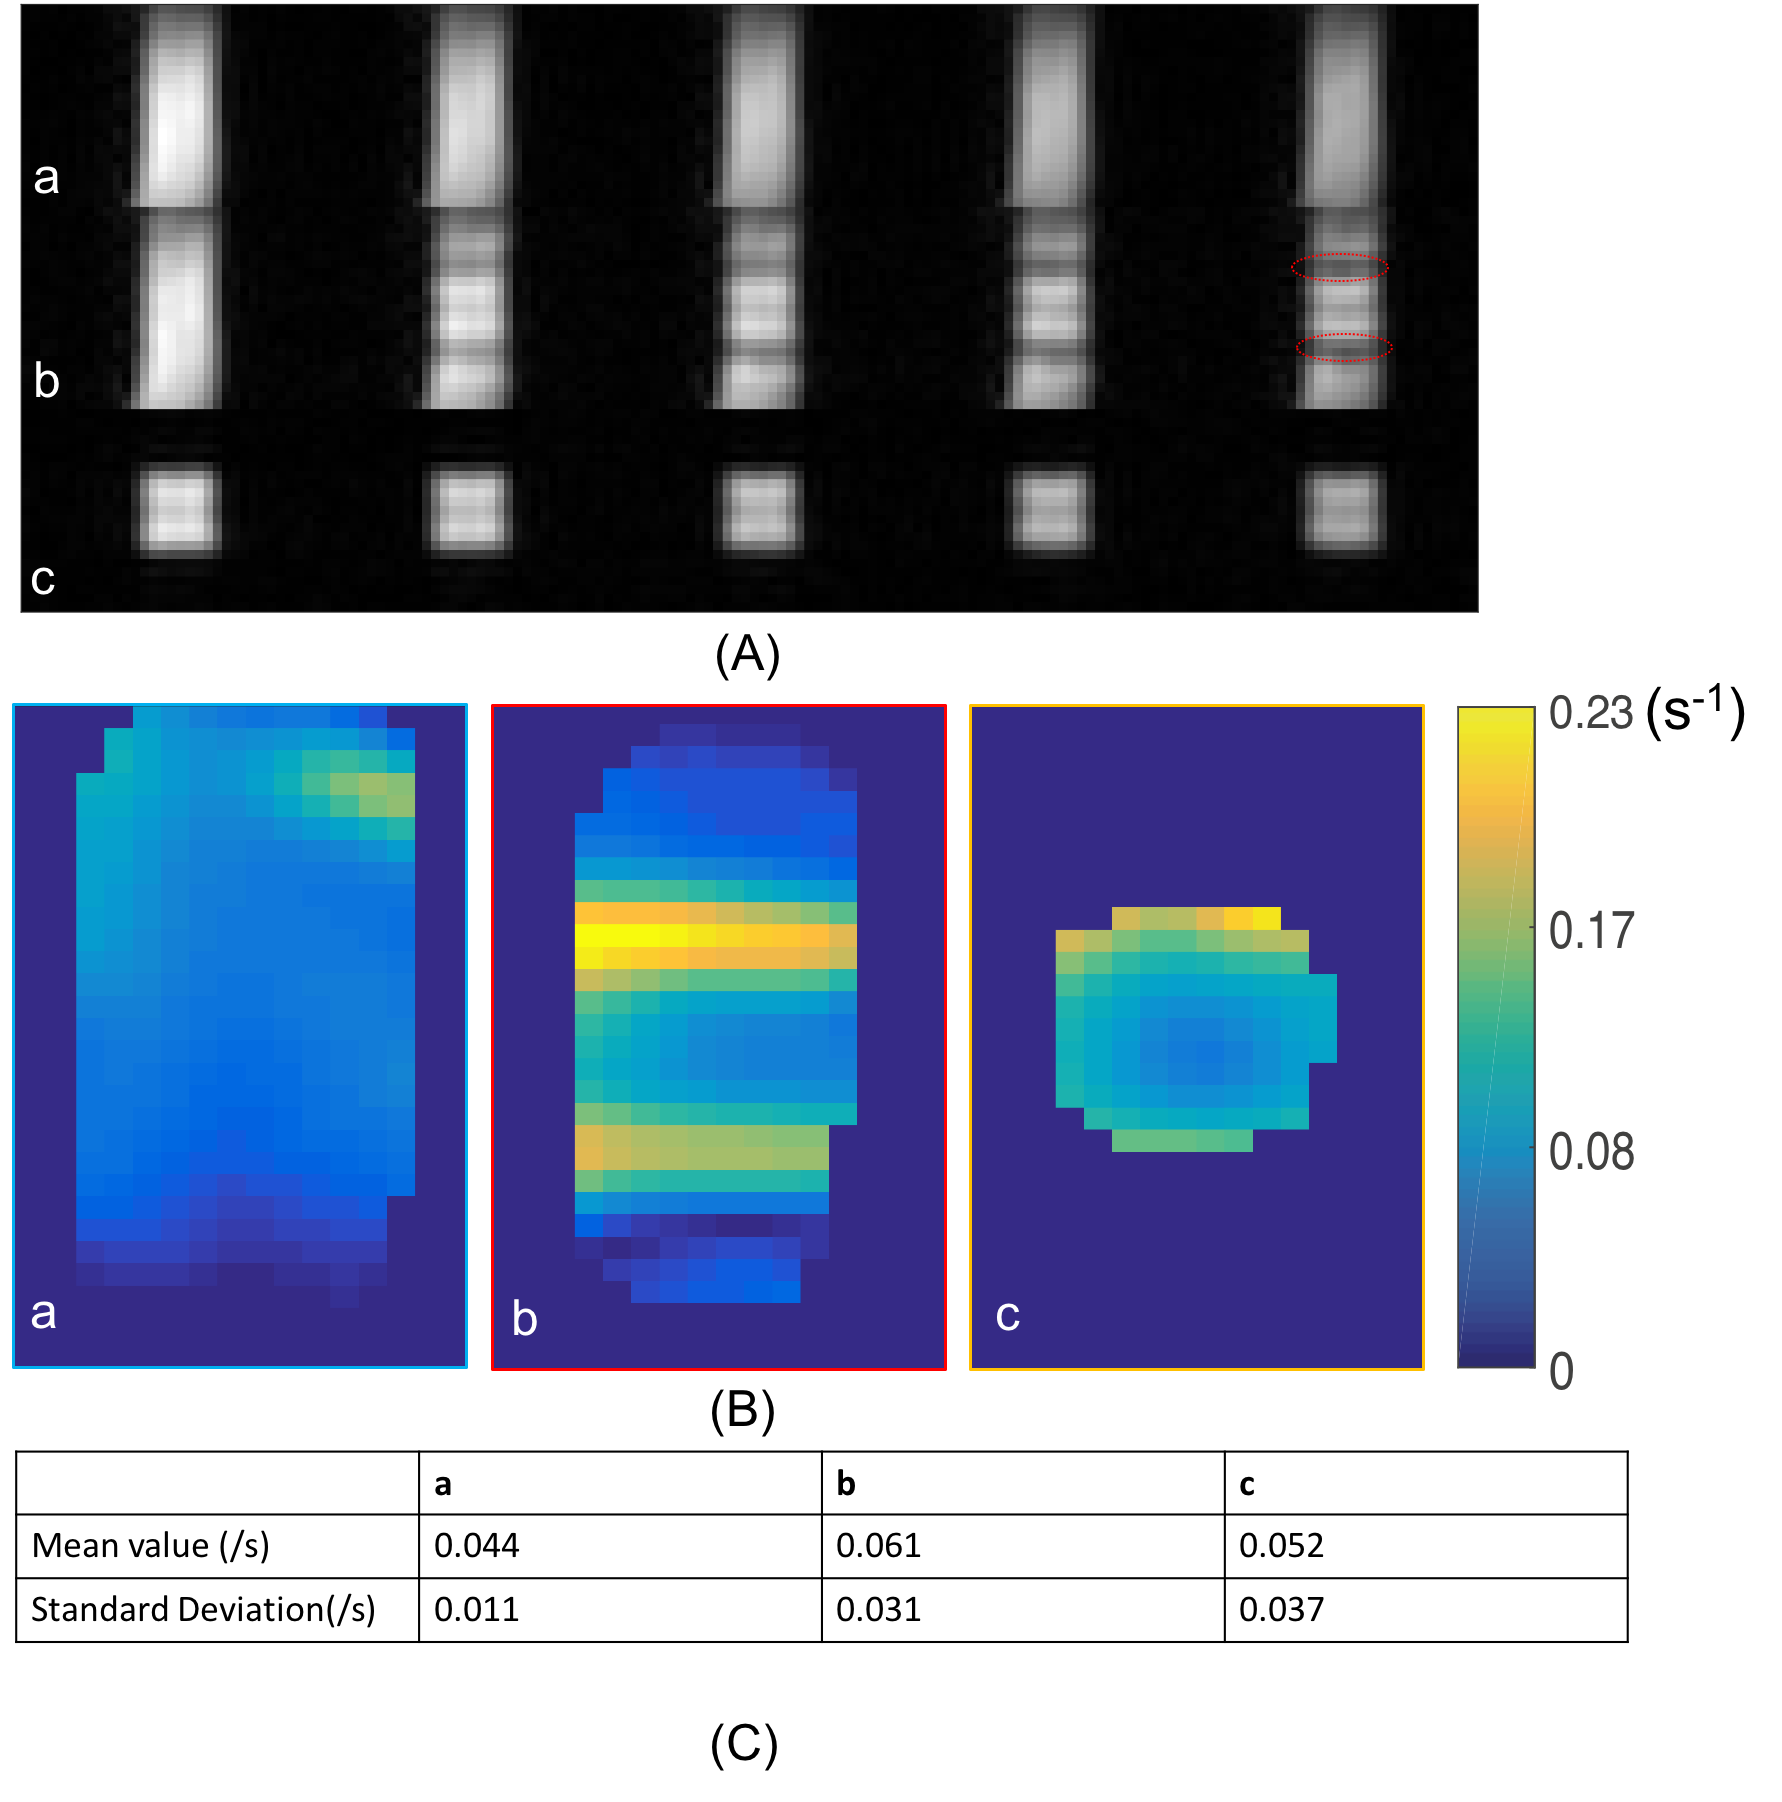
HP pyruvate phantom study results are shown in Figure 3. According to phantom study, we find that ss-DSE sequence perfectly excites the central area of the phantom with a small transition area (red circles in Fig. 3A). From the decay rate estimation maps (Fig. 3B), we calculated the refocused area decay rate for quantitative comparison, mean values and standard deviations were presented in Fig. 3C. Decay rates were almost the same for each acquisition strategies. Thus, the selective pulse only saturated the magnetization of transition area without affecting magnetization outside of the transition area.
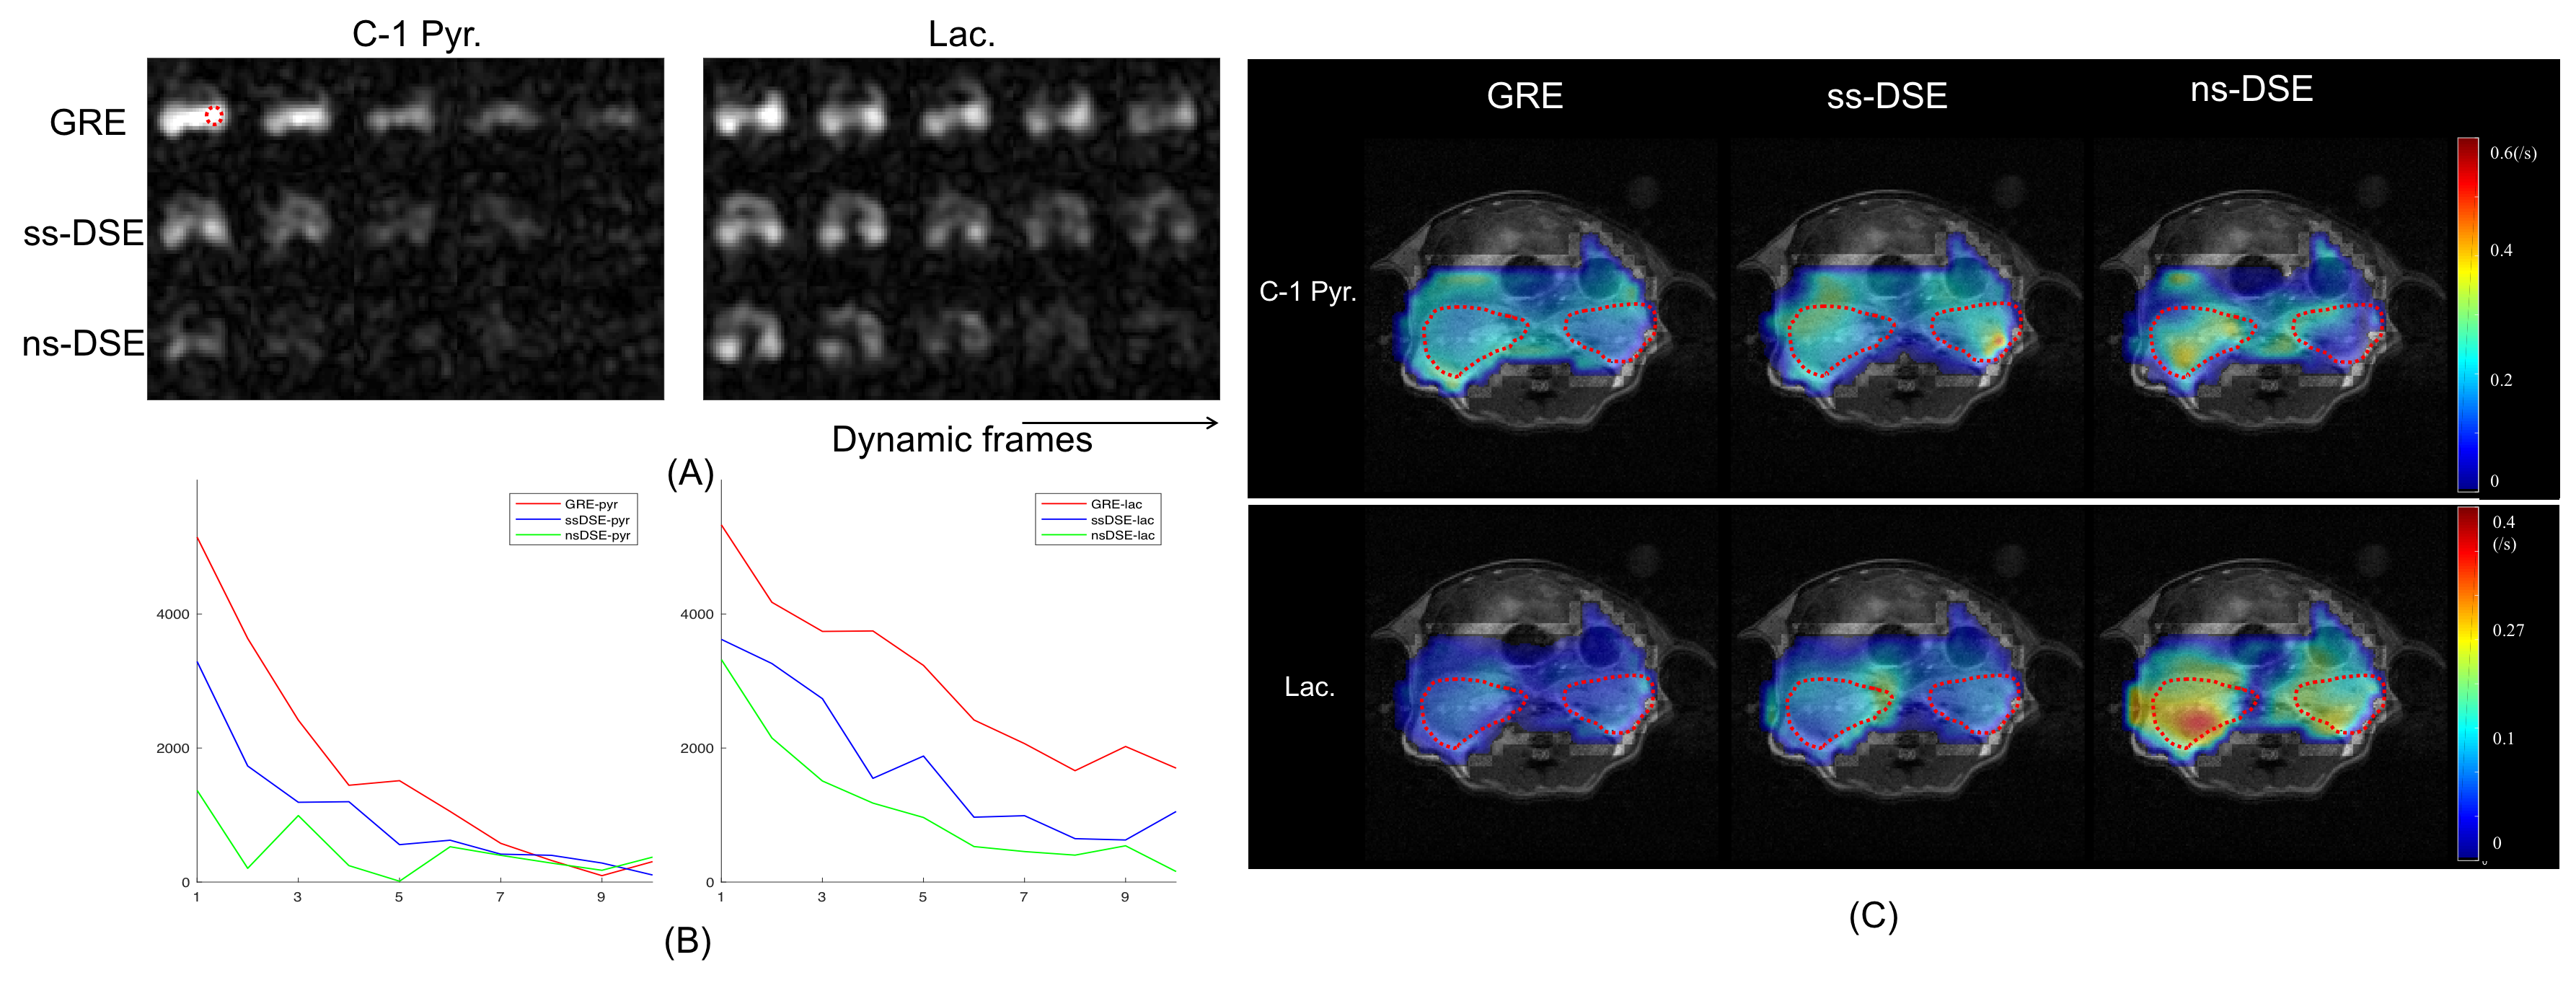
In vivo study data are summarized in Figure 4. According to the dynamic images in (Fig. 4A), both HP pyruvate and lactate signal intensity with ss-DSE acquisition are higher than with non-selective DSE (ns-DSE) acquisition. We also chose one kidney as ROI for signal change comparison among different acquisition. To quantitatively evaluate the result, we quantified the decay rate. From Fig. 4C, decay rates of both metabolites with ss-DSE acquisition are similar to GRE acquisition. The signal intensity of C-1 pyruvate with ns-DSE decayed to almost noise level after two dynamic acquisitions (Fig. 4A), highlighting the impact of saturation of circulating pyruvate from the fringe field of the coil. The decay rates of both metabolites with ss-DSE acquisition are much smaller than with ns-DSE acquisition. Due to the narrower transition area, ss-DSE largely reduced the magnetization saturation effects compared with ns-DSE sequence.
Conclusion
A dynamic double spin-echo sequence is a promising approach for imaging with T2 weighting as opposed to T2* weighting, and simultaneously assess metabolism and metabolite compartmentalization. However, fringe field effects at the edge of the coil will lead to unwanted magnetization loss. Slice-selective adiabatic refocusing pulses reduce the HP magnetization saturation caused by coil geometry without introducing other drawbacks.Acknowledgements
This work was supported by NIH grants R01EB016741 and P41EB013598. We would like to thank Dr. Robert Bok for experiment handling.References
[1] Albers, Mark J., et al. "Hyperpolarized 13C lactate, pyruvate, and alanine: noninvasive biomarkers for prostate cancer detection and grading." Cancer research 68.20 (2008): 8607-8615. [2] Cunningham, Charles H., et al. "Double spin-echo sequence for rapid spectroscopic imaging of hyperpolarized 13 C." Journal of magnetic resonance 187.2 (2007): 357-362. [3] Josan, Sonal, et al. "Application of double spin echo spiral chemical shift imaging to rapid metabolic mapping of hyperpolarized [1− 13 C]-pyruvate." Journal of Magnetic Resonance 209.2 (2011): 332-336. [4] Gordon, Jeremy W., et al. "Mis-estimation and bias of hyperpolarized apparent diffusion coefficient measurements due to slice profile effects." Magnetic Resonance in Medicine (2016). [5] Conolly, Steven, Dwight Nishimura, and Albert Macovski. "A selective adiabatic spin-echo pulse." Journal of Magnetic Resonance (1969) 83.2 (1989): 324-334. [6] Gordon, JW et al., “In Vivo Hyperpolarized 13C Diffusion Weighted MRI Measures Lactate Efflux and Changes in MCT4 Expression in Prostate Cancer.” ISMRM (2016)Figures