3686
Investigation of Brain Tissue Fixation on Iron Concentration, Magnetic Susceptibility and Effective Transverse Relaxation Rate1Medical Physics Group, Institute for Diagnostic and Interventional Radiology, Jena University Hospital – Friedrich Schiller-University, Jena, Germany, 2Section of Experimental Neurology, Department of Neurology, Essen University Hospital, Essen, Germany, 3Center for Brain Research, Medical University of Vienna, Vienna, Austria, 4Department of Radiologic Technology, Carinthia University of Applied Sciences, Klagenfurt, Austria, 5Institute for Applied Research on Ageing, Carinthia University of Applied Sciences, Klagenfurt, Austria, 6High Field Magnetic Resonance Centre, Department of Biomedical Imaging and Image-guided Therapy, Medical University of Vienna, Vienna, Austria, 7Department of Medical Engineering, Carinthia University of Applied Sciences, Klagenfurt, Austria, 8University Clinic for Trauma Surgery, Medical University of Vienna, Vienna, Austria, 9Center of Anatomy and Cell Biology, Medical University of Vienna, Vienna, Austria
Synopsis
We investigated the effect of brain tissue fixation on iron concentration and on quantitative maps of the magnetic susceptibility and effective transverse relaxation rate (R2*). Both R2* and susceptibility distributions of unfixed and fixed tissue were found to be similar, indicating similar underlying proportions of iron across tissues. Quantitatively, however, severe decreases of iron concentration of 25% in putamen and about 15% in white matter were measured after tissue fixation. The iron concentration change due to tissue fixation was captured by R2* and susceptibility which needs to be considered when directly comparing experiments performed with unfixed and fixed brain tissue.
Introduction
Non-invasive quantification of iron in the human brain is of utmost
interest for the characterization of neurodegenerative and psychiatric diseases.1-4 While iron-sensitive MRI already provides visualization of iron stores in vivo,5-8 accurate iron quantification across the whole brain still requires a
deeper understanding of the biophysical origins on MRI signal formation. Post-mortem MRI with subsequent
histological tissue preparation is an important avenue to bridge the gap
between the measured MRI signal variations and the underlying tissue composition.
Tissue fixation is most frequently used in histopathology to overcome autolysis
and to preserve the 3D tissue structure. Phosphate buffered formalin fixation,
however, can decrease tissue iron levels by up to 40% 9 and substantially affects
myelin-sensitive MRI measures.10 Therefore, we investigated the
effect of brain tissue fixation on iron concentration and on quantitative maps
of the magnetic susceptibility and effective transverse relaxation rate (R2*).Methods
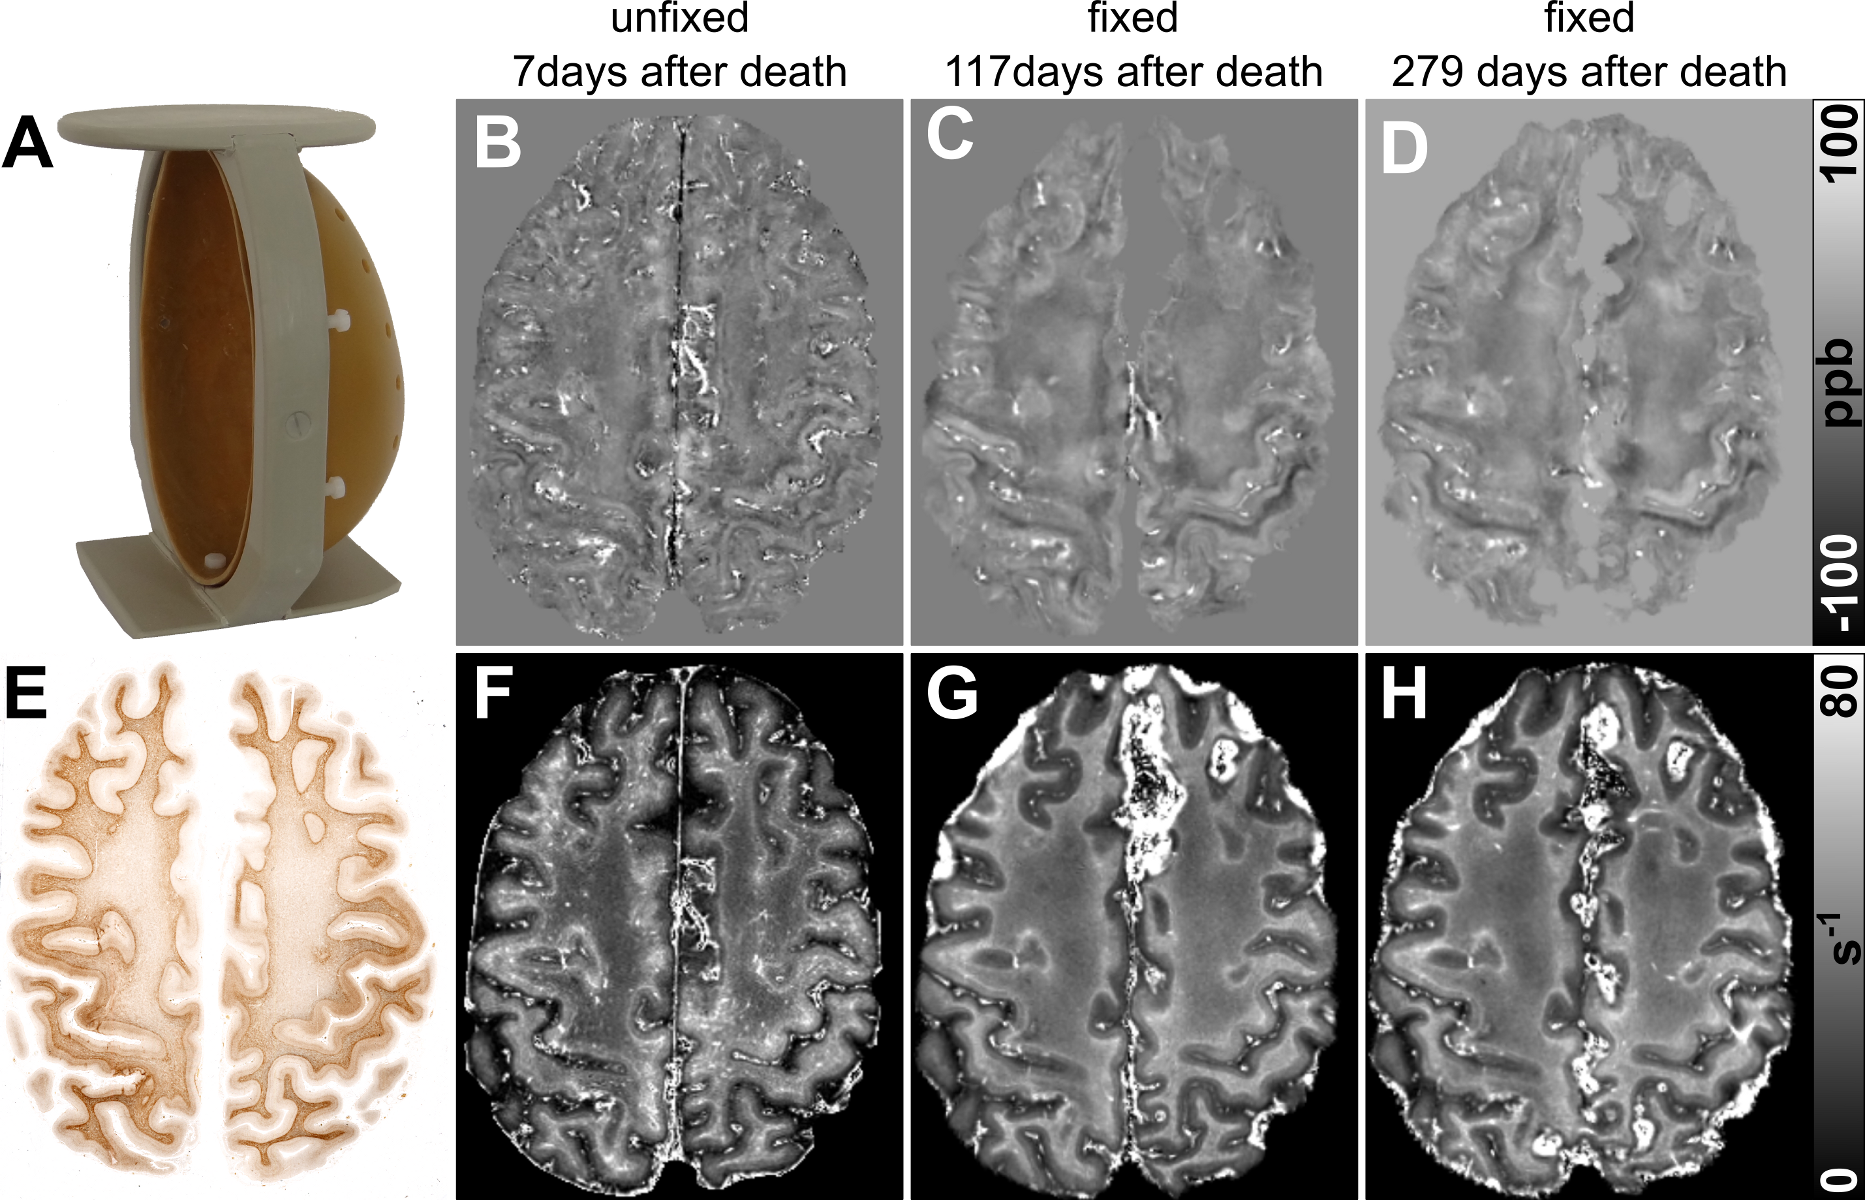
Multi-echo gradient-echo (GRE) data (TE1/TE2/TE3/TE4 = 4ms/9ms/15ms/22ms, TR/FA/BW1-4 = 26ms/15°/391Hz/px, voxel size = 0.43 mm × 0.43 mm × 0.65 mm) of two unfixed human cadaver heads (brain#1: 92 year old female, brain#2: 72 year old female) were acquired with a 7T MRI-system. From the magnitude signal decay and the phase evolution of the multi-echo GRE data R2* and susceptibility maps were computed, respectively, as described in reference 11. Following MRI, the brains were extracted from the cadaver heads. The complete brain#1 and the right hemisphere of brain#2 were fixed for 3 days in 37% formalin, subsequently immersed in 4% neutral-buffered formalin for further 21 days, and finally preserved in 1% neutral-buffered formalin. The fixed brains were re-scanned with the same MRI protocol after more then 100 days (brain#1: 117 and 279 days, brain#2: 121 days) after death using a custom-made sample holder (Fig. 1A) to ensure the same brain orientation as during the in situ acquisition. Iron concentration was measured in homogenized tissue samples (diameter: 5 mm, slice thickness: 6 mm) harvested in homogenous white matter (WM) and putamen of the unfixed left hemisphere (1 day after MRI) and the fixed right hemisphere of brain#2 using the colorimetric ferrozine assay.12 Mean magnetic susceptibility and R2* were determined in volumes of interest (VOI) in the same anatomical areas where iron concentration was measured in tissue samples of brain#2 and in WM and gray matter (GM) regions of brain#1.Results
The unfixed
susceptibility and R2* maps exhibited a patchy appearance due to the
presence of deoxygenated blood, in particular in cortical GM and superficial
white matter (WM) (Fig. 1B,F). Corresponding maps of the fixed brain
appeared rather smooth with increased contrast between cortical GM and adjacent
WM (Fig. 1C,D,G,H). Higher iron concentrations were discernible in
superficial WM and lower concentrations in central WM and cortical GM
(Fig. 1E). This distribution was similarly reflected in the R2*
maps, where superficial WM presented with high and cortical GM and central WM
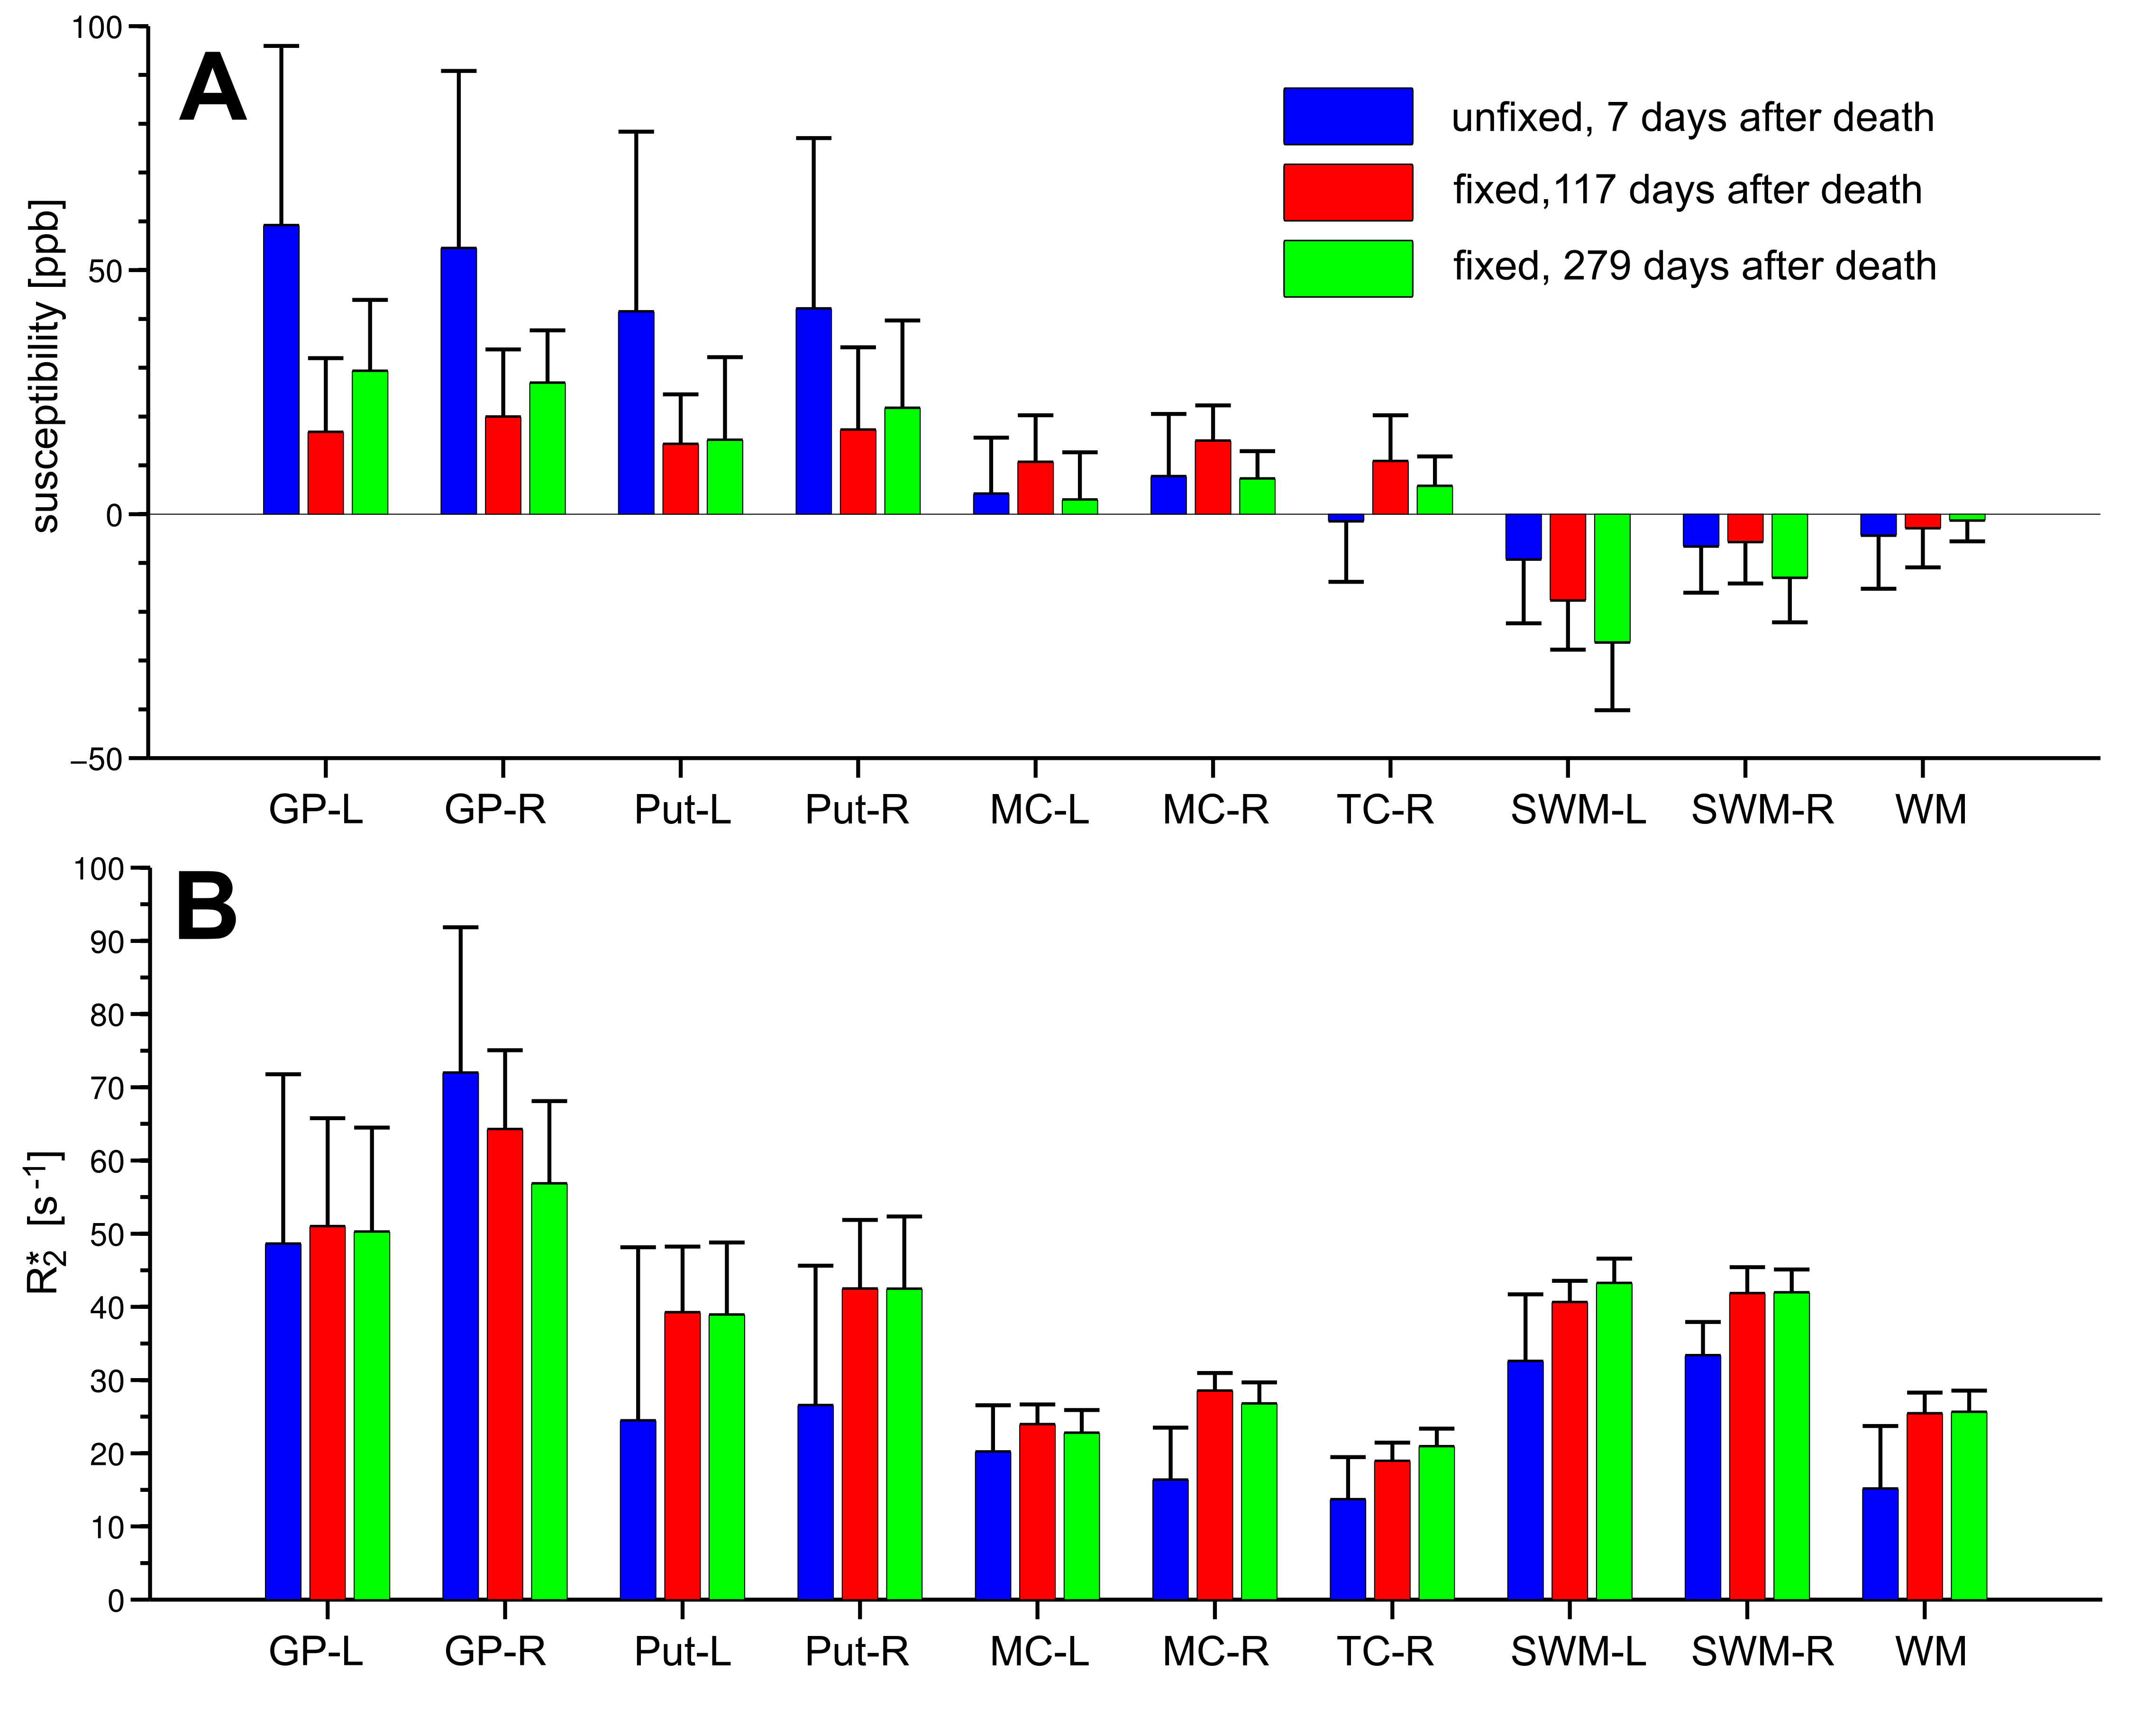
with low R2* values. Quantitative evaluation of magnetic
susceptibility and R2* revealed variations between unfixed and fixed
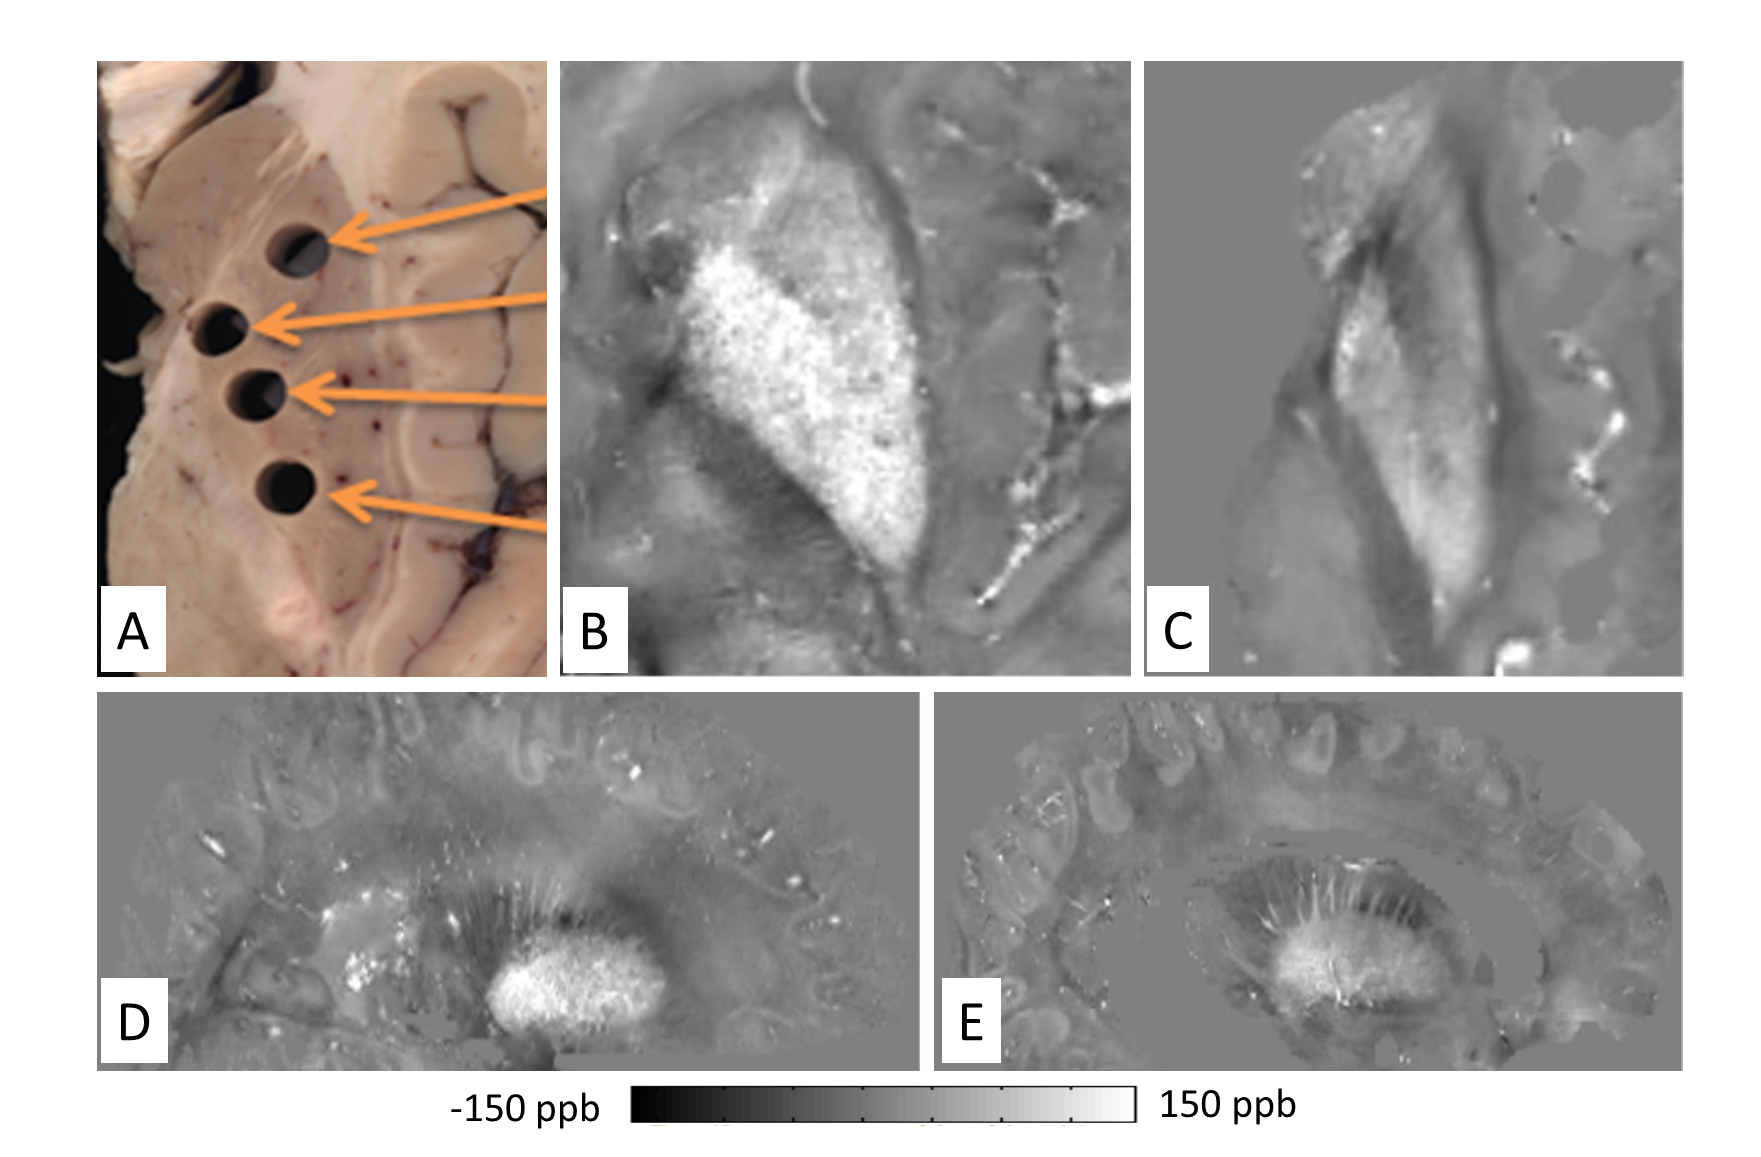
brain tissue examinations (Fig. 2). Figure 3 illustrates susceptibility
maps showing the basal ganglia of the unfixed and fixed brain. In line with
Figure 2, magnetic susceptibility in deep gray matter substantially decreased
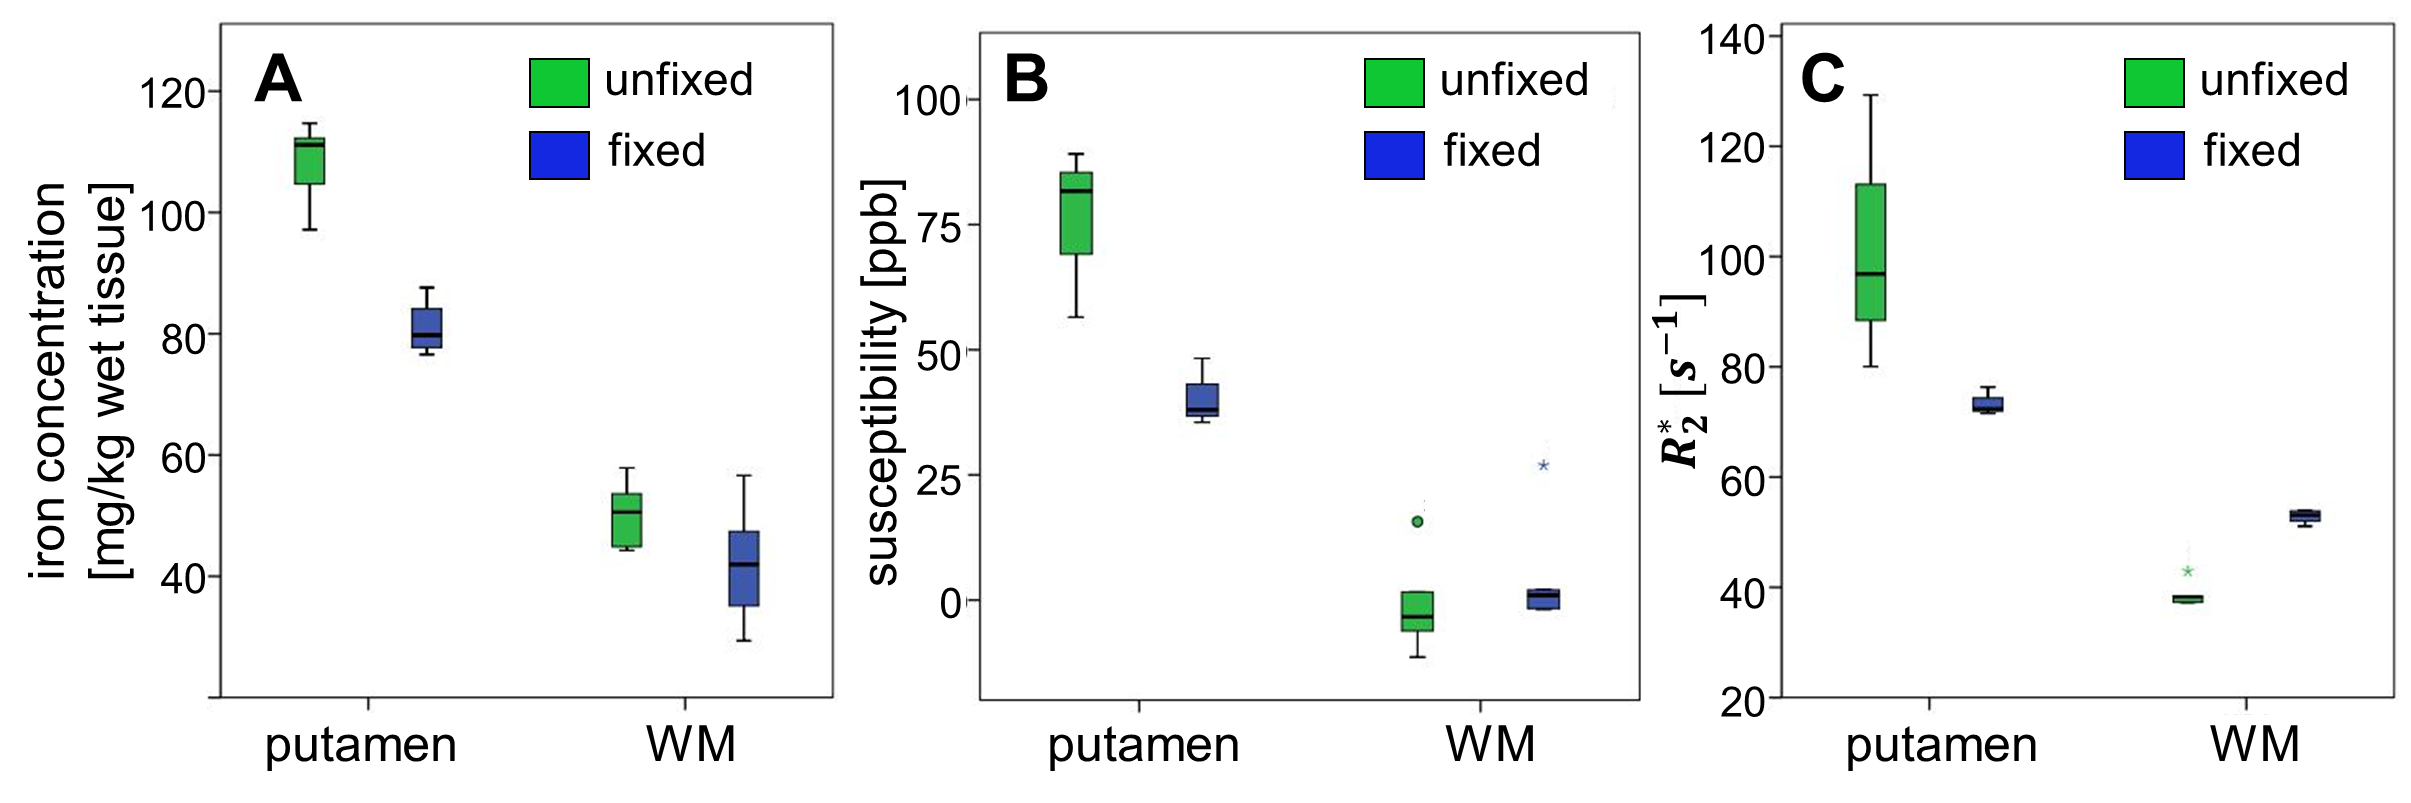
after tissue fixation. Assuming that iron is similarly distributed in the left
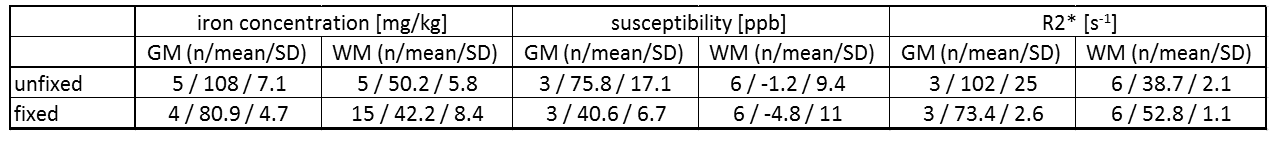
and right hemisphere of the same brain, Figure 4 and Table 1 indicate decrease in iron
concentration after tissue fixation in the putamen by 25% and a more moderate decrease
in white matter by about 15%. While the susceptibility in the white matter
regions of brain#2 was barely affected by tissue fixation, R2* increased
more substantially.Discussion and Conclusion
Overall, R2* and magnetic susceptibility distributions of unfixed and fixed tissue are similar, indicating similar underlying proportions of iron across tissue. Quantitatively, we observed iron decreases up to 25% due to tissue fixation. It should, however, be noted that the measured changes of iron content may not only be induced by tissue fixation itself but also by different iron concentrations in the left and right hemispheres as well as by slightly different locations of the harvested tissue samples in the fixed and unfixed hemispheres. The change in iron concentration due to tissue fixation is reflected in both R2* and magnetic susceptibility (Figs. 2 and 4), whereas susceptibilities in WM are less affected than R2*. In conclusion, regional variations in iron content, R2* and magnetic susceptibility exist that have to be considered when directly comparing experiments performed with unfixed and fixed brain tissue.Acknowledgements
This work was supported by the Österreichische Nationalbank Anniversary Fund project no. 16153.References
1. Dexter DT, Wells FR, Lees AJ, et al. Increased nigral iron content and alterations in other metal ions occurring in brain in Parkinson's disease. J Neurochem. Jun 1989;52(6):1830-1836.
2. Dexter DT, Carayon A, Javoy-Agid F, et al. Alterations in the levels of iron, ferritin and other trace metals in Parkinson's disease and other neurodegenerative diseases affecting the basal ganglia. Brain. Aug 1991;114 ( Pt 4):1953-1975.
3. LeVine SM. Iron deposits in multiple sclerosis and Alzheimer's disease brains. Brain Res. Jun 20 1997;760(1-2):298-303.
4. Bouras C, Giannakopoulos P, Good PF, Hsu A, Hof PR, Perl DP. A laser microprobe mass analysis of brain aluminum and iron in dementia pugilistica: comparison with Alzheimer's disease. Eur Neurol. 1997;38(1):53-58.
5. Haacke EM, Cheng NY, House MJ, et al. Imaging iron stores in the brain using magnetic resonance imaging. Magn Reson Imaging. Jan 2005;23(1):1-25.
6. Langkammer C, Krebs N, Goessler W, et al. Quantitative MR imaging of brain iron: a postmortem validation study. Radiology. Nov 2010;257(2):455-462.
7. Langkammer C, Schweser F, Krebs N, et al. Quantitative susceptibility mapping (QSM) as a means to measure brain iron? A post mortem validation study. NeuroImage. Sep 2012;62(3):1593-1599.
8. Deistung A, Schäfer A, Schweser F, Biedermann U, Turner R, Reichenbach JR. Toward in vivo histology: a comparison of quantitative susceptibility mapping (QSM) with magnitude-, phase-, and R2*-imaging at ultra-high magnetic field strength. NeuroImage. Jan 15 2013;65:299-314.
9. Schrag M, Dickson A, Jiffry A, Kirsch D, Vinters HV, Kirsch W. The effect of formalin fixation on the levels of brain transition metals in archived samples. Biometals. Dec 2010;23(6):1123-1127.
10. Schmierer K, Wheeler-Kingshott CA, Tozer DJ, et al. Quantitative magnetic resonance of postmortem multiple sclerosis brain before and after fixation. Magn Reson Med. Feb 2008;59(2):268-277.
11. Deistung A, Schäfer A, Schweser F, et al. High-Resolution MR Imaging of the Human Brainstem In vivo at 7 Tesla. Front Hum Neurosci. 2013;7:710.
12. Fish WW. Rapid colorimetric micromethod for the quantitation of complexed iron in biological samples. Methods Enzymol. 1988;158:357-364.
Figures