3683
Ultrashort Echo Time Quantitative Susceptibility Mapping (UTE-QSM): Limitations in Quantifying High Iron ConcentrationXing Lu1,2, Alexey Dimov3, Qun He1, Yajun Ma1, Yi Wang3, Eric Y Chang1,4, and Jiang Du1
1Department of Radiology, University of California, San Diego, CA, United States, 2Institute of Electrical Engineering, Chinese Academy of Science, Beijing, People's Republic of China, 3Department of Radiology, Weill Cornell Medical College, New York, NY, United States, 4Radiology Service, VA San Diego Healthcare System, San Diego, CA, United States
Synopsis
Iron overload can affect not only the central nervous system, but the liver, pancreas, myocardium, endocrine glands, and musculoskeletal structures. A reliable quantitative method to detect and measure high concentration iron in vivo would be of great clinical utility. Ultrashort echo time (UTE) sequences have echo times (TE) 100-1000 times shorter than clinical sequences, and may detect signal from high iron concentration. In this study, we aimed to evaluate the capability of UTE-QSM sequence in quantifying high iron concentration with an Iron phantom study and the results show that UTE-QSM techniques can quantify high iron concentration up to 22 mM or higher.
Introduction
Iron is an essential element for life and is involved in many integral biologic processes. However, iron is also a potentially toxic substance. If iron stores exceed the amount that the body can chelate, free iron will accumulate. Iron overload can affect not only the central nervous system, but the liver, pancreas, myocardium, endocrine glands, and musculoskeletal structures1. A reliable quantitative method to detect and measure high concentration iron in vivo would be of great clinical utility. Quantitative susceptibility mapping (QSM) is a quantitative method for the magnetic susceptibility based on the phase information, and can detect iron distribution in human body 2-4. However, QSM based on conventional clinical sequences cannot evaluate high iron concentration, which may lead to very low T2*s and thus too low signal with regular sequences with relatively long TEs. Ultrashort echo time (UTE) sequences have echo times (TE) 100-1000 times shorter than those of clinical sequences, and may detect signal from high iron concentration. In this study, we aimed to evaluate the capability of UTE-QSM sequence in quantifying high iron concentration.Method
An iron phantom was prepared with six tubes, each filled with 2 mL of Feridex I.V. solution (Berlex Laboratories, Wayne, New Jersey, USA), with six different concentrations of 2, 6, 10, 14, 18, 22 mMol. The tubes were put in a cylinder container (10 cm in diameter) filled with agarose gel (0.9% by weight) with the longitudinal direction of the tubes placed parallel to the B0 field. Equation [1] describes the phase relationships with the magnetic susceptibility c:$$ φ=-γδBT_{e}, δB=B_0 (χ⨂d) [1]$$ It is obvious that selection of TE will dramatically affect the phase, which is the basis for phase unwrapping procedure and calculation of c. MEDI based QSM was performed under 3T GE scanner using the 3D UTE cones sequence, which employed a short rectangular pulse excitation followed by 3D spiral trajectory with a conical view ordering. To study the effect of TE spacing, five echo spacing (∆TE=0.06, 0.1, 0.3, 0.6, 1.2 ms) were investigated with the first TE keeps 0.032ms. To study the effect of the first TE (TE1), six TE1s (0.032, 0.132, 0.232, 0.332, 0.632, 0.932 ms) were investigated with five TEs and a ∆TE of 0.1 ms. The normalized QSM value is calculated by dividing QSM values of each dataset to the QSM value of the second TE of the corresponding dataset. R2*(1/T2*) map was also fitted and calculated from the multi-echo images using a single-exponential decay model as shown in Equation [2]: $$s(T_{e})=s_0×e^{-\frac{T_{e}}{T2*}}+Base [2]$$Results
Figure 1 shows the iron phantom together with T2*/R2* maps and T2*/R2* as a function of iron concentration. T2* dropped to less than 1 ms with an iron concentration of 6 mM or higher, “invisible” with conventional clinical MR sequences. An excellent linear relationship was observed between R2* and iron concentration (R2 = 0.9998). Figure 2 shows UTE-QSM maps with five different echo spacing ranging from 0.06 to 1.2 ms. Monotonically increased susceptibility was observed with ∆TEs of 0.06 and 0.1 ms. With a ∆TE of 0.3 ms, iron concentration higher than 22 mM could not be quantified. Further increase in ∆TE to 1.2 ms leads to failure in quantifying iron concentration up to 10 mM. Figure 3 shows the effect of different TE1 on UTE-QSM maps. Increased TE1 leads to failure in quantifying high iron concentration. A TE1 of 0.932 ms can only accurately measure susceptibility up to 10 Mm, while a TE1 of 0.032 ms can quantify iron concentration up to 22 mM or higher.Discussion and Conclusion
According the MEDI based QSM results, UTE-QSM techniques can quantify high iron concentration up to 22 mM or higher. This capability is reduced with increasing ∆TE and TE1. In patients with hemophilia or thalassemia where iron concentration can be very high (30 mM or higher), an initial T2* measurement would be helpful for the choice of ∆TE. The accuracy of absolute QSM value may be affected due to the changing gradient strength along the acquisition period with the extreme short ∆TE and TE1, further study and optimized TE selection of the sequence is still needed. Clinical evaluation of the UTE-QSM sequence remains to be done in future studies.Acknowledgements
The authors acknowledge grant funding from grant funding from the NIH (R01AR062581-01A1 and R01AR068987-01), the VA Clinical Science R&D Service (Merit Award I01CX001388), National Natural Science Foundation of China (NSFC 51607169) and Chinese Scholarship Council Grant (CSC 201504910174).References
1. Taher AT, Musallam KM, Inati A. Iron overload: consequences, assessment, and monitoring. Hemoglobin. 2009; 33(S1):S46-57. 2. Liu T, Spincemaille P, de Rochefort L, Kressler B, Wang Y. Calculation of susceptibility through multiple orientation sampling (COSMOS): a method for conditioning the inverse problem from measured magnetic field map to susceptibility source image in MRI. Magn Reson Med 2009;61:196–204 3. de Rochefort L, Liu T, Kressler B, Liu J, Spincemaille P, Lebon V, Wu J, Wang Y. Quantitative susceptibility map reconstruction from MR phase data using bayesian regularization: validation and application to brain imaging. Magn Reson Med 2010;63:194–206. 4. Liu T, Liu J, de Rochefort L, et al. Morphology enabled dipole inversion for quantitative susceptibility mapping using structural consistency between the magnitude image and the susceptibility map. Neuroimage 2012;59:2560–2568Figures
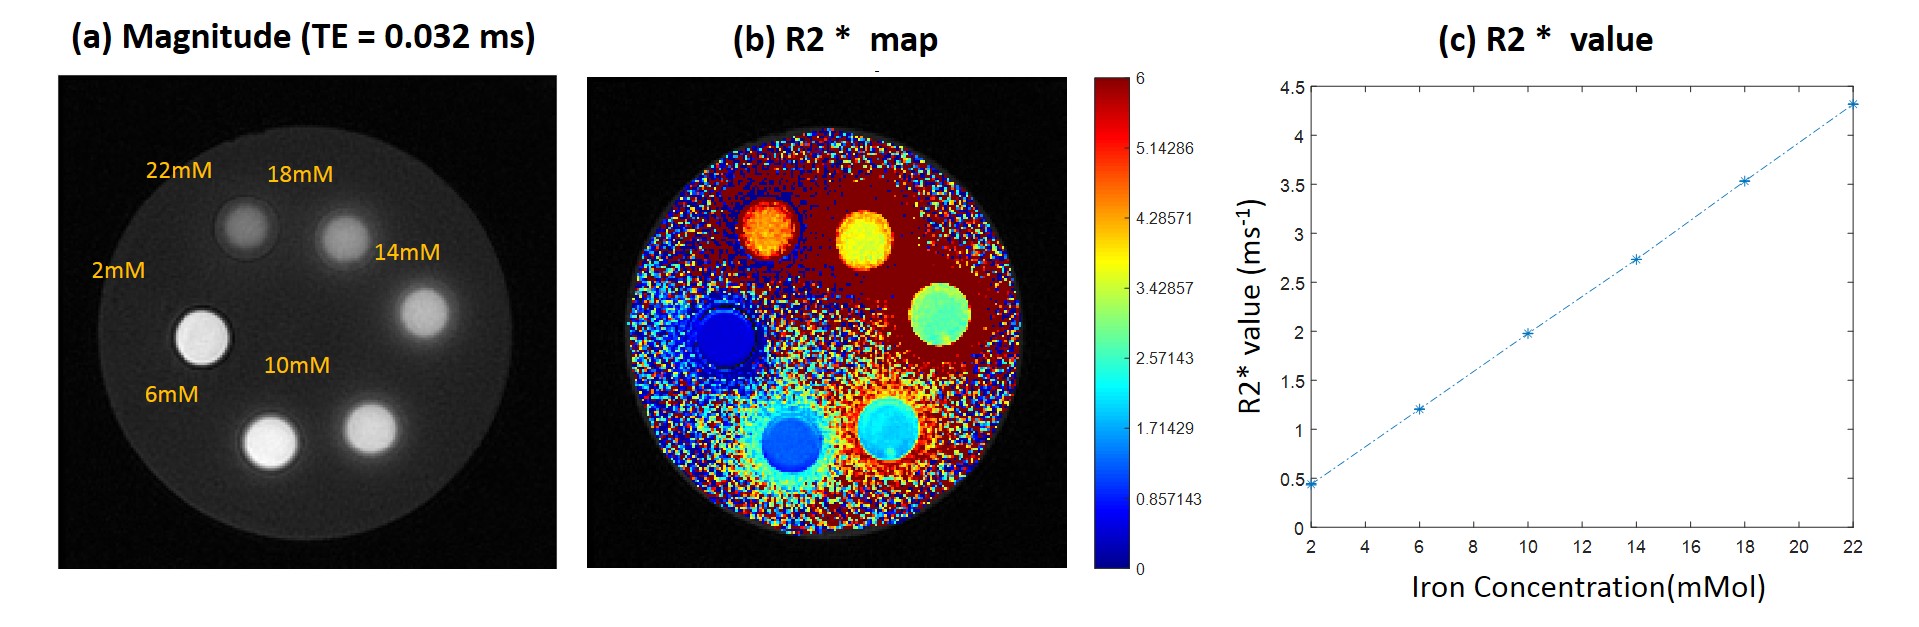
Figure 1. Iron Phantom and R2* measurement
results. (a) Magnitude at TE = 0.032ms. (b) R2* fitting map of the phantom. (c)
R2* value for each tube with different Iron concentration.
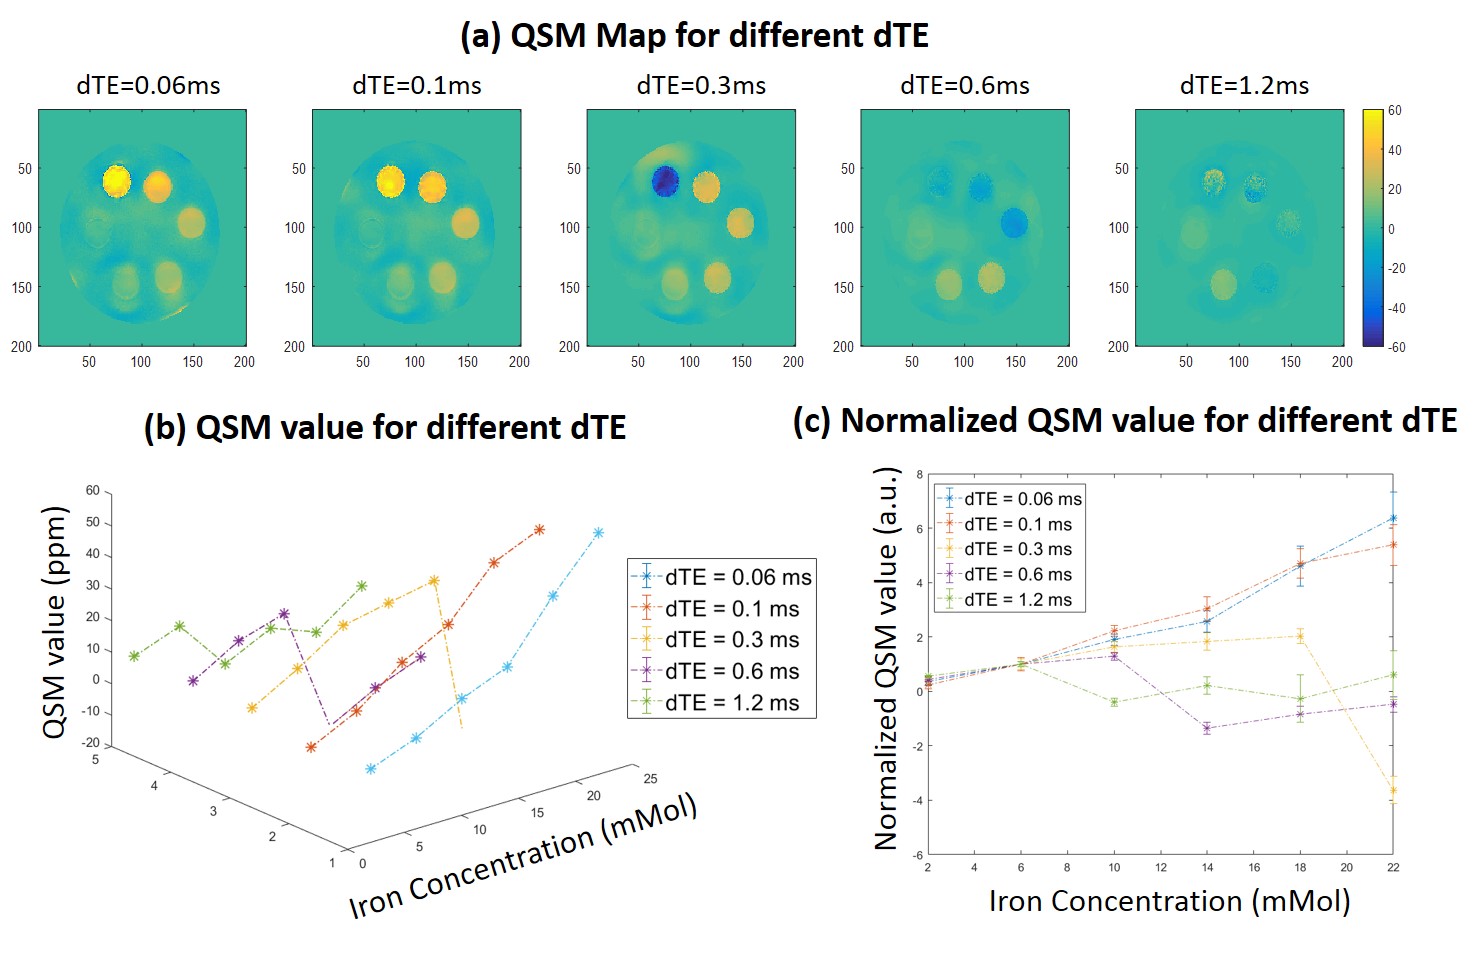
Figure 2. QSM measurement for TE
selections with different echo spacing (dTE). (a) QSM map at different dTE. (b)
QSM value for different dTE at different Iron concentration. (c) Normalized QSM
value (divided by 6mMol QSM) for comparison.

Figure 3. QSM measurement for TE selections
with first TE (TE1). (a) QSM map at different TE1. (b) QSM value for different TE1
at different Iron concentration. (c) Normalized QSM value (divided by 6mMol
QSM) for comparison.