3682
Texture analyses of quantitative susceptibility maps to differentiate patients with Parkinson’s disease from healthy controls1Shanghai Key Laboratory of Magnetic Resonance and Department of Physics, East China Normal University, Shanghai, People's Republic of China, 2Department of Neurology, East Hospital, Tongji University School of Medicine, Shanghai, People's Republic of China, 3Department of Radiology, Weill Medical College of Cornell University, NY, United States
Synopsis
QSM provides excellent contrast of iron-rich deep nuclei to quantify iron in the brains. Clinicians are interested in using QSM to diagnose patients with Parkinson’s disease (PD). Texture analyses of QSM images in substantia nigra (SN) was performed to differentiate PD from healthy controls (HC). Most of the texture parameters were significantly different between PD and HC. The second-order textures were more efficient in differentiating PD from HC than did the first-order ,which suggests that the second-order texture parameters are more suitable and sensitive for the diagnosis of PD.
Purpose
Several studies demonstrate that the susceptibility of the whole SN or substantia nigra pars compacta (SNpc) in the PD is significantly higher than that in healthy controls1-3. Texture analysis of MR images provides quantitative means to describe tissue properties and enhances the diagnosis accuracy4 . The objective of this study was to differentiate PD from HC using a texture analysis in the SN of quantitative susceptibility maps (QSMs).Materials and Methods
Twenty nine patients with PD (12 males and 17 females, 67.9±6.7 years old) and Twenty eight healthy controls (HC) (12 males and 16 females, 64.1±7.9 years old) were studied on a clinical 3T MR imaging scanner (Magnetom Trio Tim, Siemens Healthcare, Erlangen, Germany) with a 12 channel matrix coil. The QSM images were generated from a three dimensional (3D) spoiled multi-echo gradient-echo (GRE) sequence with the following parameters: TR = 60ms, TE1 = 6.8ms, ΔTE = 6.8ms, echoes number = 8, flip angle = 15˚, FOV = 240*180 mm2, in-plane resolution=0.625*0.625mm2, slice thickness= 2mm, number of slices = 96. Conventional MR images, including T1-weighted, T2-weighted and T2-weighted fluid-attenuated inversion recovery (FLAIR) were also acquired.
QSM maps were reconstructed from the phase data using the Morphology Enabled Dipole Inversion (MEDI) algorithm 5. Regions of interest (ROI) of the SN were drawn manually. The 3D texture analyses were performed using MaZda software (http://www.eletel.p.lodz.pl/programy/mazda/, Lodz, Poland) 6. The first-order texture parameters were mean and standard deviation (SD). The second texture parameters included AngScMom, contrast, correlation, difference of variance, entropy, inverse different moment, sum of entropy, SumAverg, SumVarnc, DifEntrp, and SumOfSqs.
The first- and second-order texture parameters of the QSM images were obtained to evaluate group differences using two-tailed t-test. The sensitivity and specificity of the first- and second-order texture parameters of QSMs to distinguish patients with PD from healthy individuals were analyzed by receiver operating characteristic (ROC) curves in the SN. MedCalc statistical software was used to conduct all statistical analyses.
Results
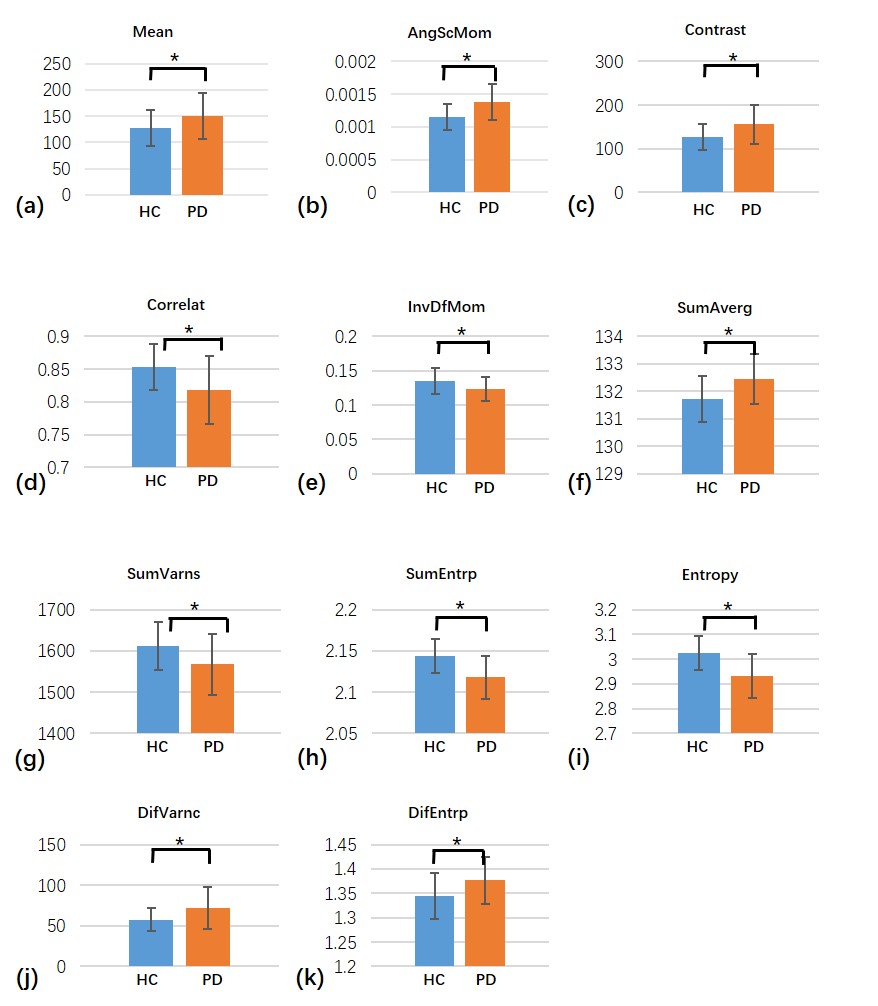
The results of the first- and second-order texture analyses of the QSMs in the two subject groups are shown in Fig. 1, except for SD and SumOfSqs, which showed no significant differences. For the first-order analysis, the mean susceptibility of SN showed a significant difference between PD and HC (p = 0.031). For the second-order analysis, significant differences were found between the two groups in AngScMom(p=0.0008), Contrast(p=0.0058), Correlation(p=0.0047), InvDfMom (p=0.0214), SumAverg(p=0.0024), SumVarnc(p=0.0145), SumEntrp(p=0.0001), Entropy (p=0.0001), DifVarnc(p=0.0127), and DifEntrp(p=0.0152).
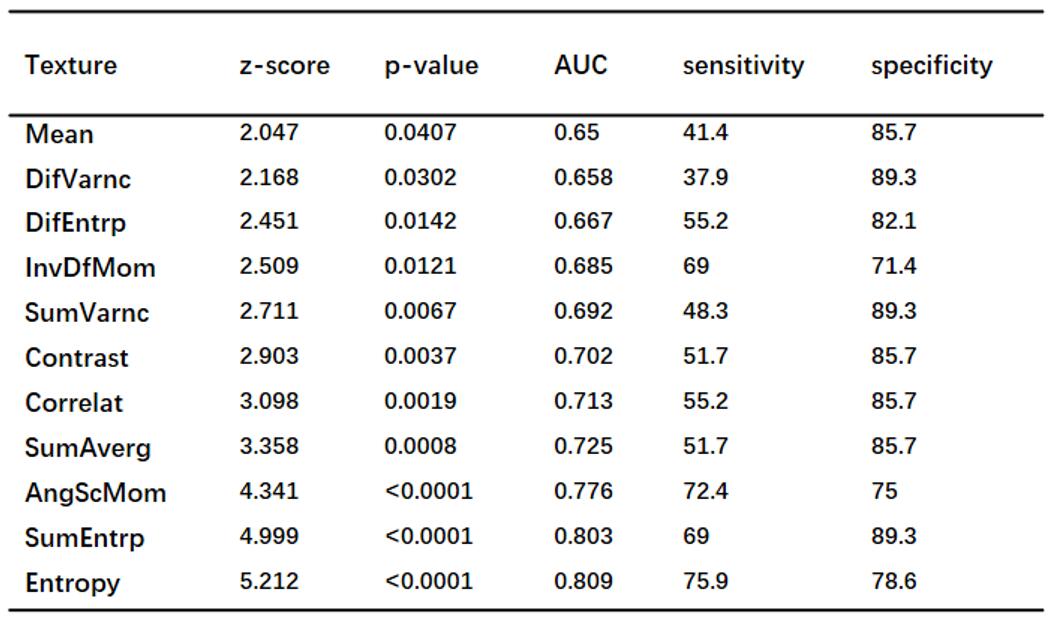
The results of the ROC curve analyses of the QSM texture parameters between HC and PD are summarized in Table 1. The second-order texture parameters had relatively higher accuracy to classify PD patients than the first-order texture parameters. Entropy provided the highest AUC = 0.809 at SN.
Discussion and conclusions
This was the first study to evaluate the textures of QSM in PD. The QSM texture analysis successfully distinguished HC and PD. Results of the ROC curve tell us how the QSM image texture parameters could contribute to diagnosis of Parkinson’s disease. First, The texture parameters of QSM images revealed different characteristics of PD. Second, PD was better characterized by the QSM textures. Finally, although multiple analyses were performed separately to yield first-and second-order texture parameters, the second-order textures parameters were more efficient in differentiating PD from HC than did the first-order, which would enable better disease prediction.
In summary, texture analysis in the QSM of substantia nigra could be used to differentiating PD from HC. The second-order textures were more efficient in differentiating PD from HC than did the first-order.
Acknowledgements
No acknowledgement found.References
1. Murakami Y, Kakeda S, Watanabe K, et al. Usefulness of quantitative susceptibility mapping for the diagnosis of Parkinson disease. Am J Neuroradiol.2015;36(6): 1102-1108.
2. Barbosa JH, Santos AC, Tumas V, et al. Quantifying brain iron deposition in patients with Parkinson's disease using quantitative susceptibility mapping, R2 and R2*. Magn Reson Imag. 2015;33(5): 559-565.
3. He N, Ling H, Ding B, et al. Region-specific disturbed iron distribution in early idiopathic Parkinson's disease measured by quantitative susceptibility mapping. Hum Brain Mapp. 2015; 36(11):4407-20.
4. Zhang J, Yu C, Jiang G, Liu W, et al, 3D texture analysis on MRI images of Alzheimer’s disease. Brain Imag Behav. 2012;6(1): 61–69.
5. Liu T, Surapaneni K, Lou M, et al. Cerebral microbleeds: burden assessment by using quantitative susceptibility mapping. Radiology. 2012;262(1): 269-278.
6. Hwang EJ, Kim HG, Kim D, et al. Texture analyses of quantitative susceptibility maps to differentiate Alzheimer’s disease from cognitive normal and mild cognitive impairment. Medical Physics. 2016;43(8): 4718-4728.
Figures